DIGE difference gel electrophoresis Built upon the classical
 • Built upon the classical gel approach to protein quantification")
DIGE (difference gel electrophoresis) • Built upon the classical gel approach to protein quantification (gel densitometry) • Separate Samples are treated with unique fluorophore tags (binding covalently with lysine ε-amino groups) • Samples are combined and run on the same 2 D gel (ΔMW of proteins is negligible) • Quantitative Analysis is based on relative intensities of fluorescing labels at specific spots (relative quantitation) or to labeled standard (absolute quantitation).

Practical Approach to DIGE Amersham Pharmacia Biotech, Life Science News, 7, 2001
 Incorporate Stable Light Isotope Sample 2")
Accurate Quantitation Using Isotope Dilution Sample 1 (Reference) Incorporate Stable Light Isotope Sample 2 Incorporate Stable Heavy Isotope Combine Samples Analyze by Mass Spectrometer • heavy/light analytes are chemically identical specific signal in MS • Ratio of heavy/light signals indicates ratio of analytes

Mass Spectrometry and Quantitative Measurements H Rel. Abund. equimolar mixture of 2 peptides A Q E Mass spectrometry is inherently not a quantitative technique. The intensity of a peptide ion signal does not accurately reflect the amount of peptide in the sample. B m/z equimolar mixture of 2 peptides [Val 5]-Angiotensin II Lys-des-Arg 9 -Bradykinin 1031. 5188 (monoisotopic) 1031. 5552 (monoisotopic) 516. 725 m/z 516. 828

Mass Spectrometry and Quantitative Measurements equimolar mixture of 2 peptides H Q E Rel. Abund. 13 C A B 2 D 2 D A B H Q 13 C E m/z Two peptides of identical chemical structure that differ in mass because they differ in isotopic composition are expected to generate identical specific signals in a mass spectrometer. Methods coupling mass spectrometry and stable isotope tagging have been developed for quantitative proteomics.

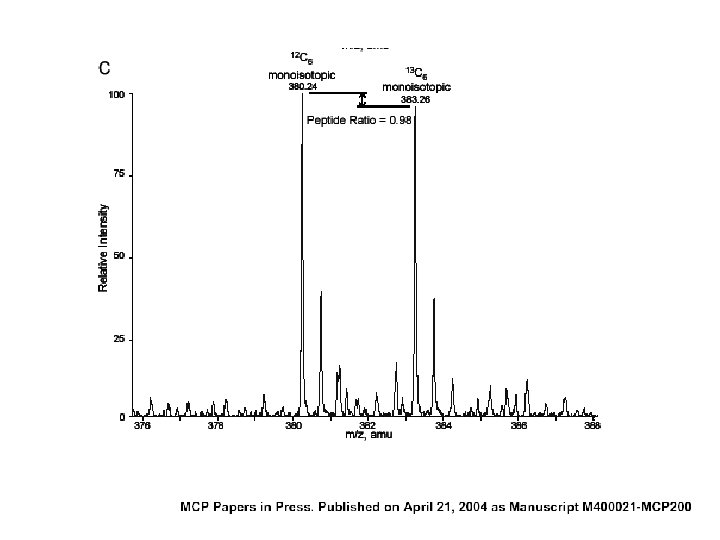
Relative quantitation : stable isotope labelling is very fashionable! Sample A : light isotope Sample B : heavy isotope mix, digest Quantitate and identify ( MS) Dm = 9 Da Peptide from sample A Peptide from sample B

How to label ? -chemically, post protein synthesis “specific” chemical modification of AA side chain (+) any sample can be done (-) side reactions -metabolically, during protein synthesis àIncorporation of one or more labelled amino acid (+) “native” proteins (-) need cultivable organism
: a quantitative method • Label protein samples with heavy and")
ISOTOPE-CODED AFFINITY TAG (ICAT): a quantitative method • Label protein samples with heavy and light reagent • Reagent contains affinity tag and heavy or light isotopes Chemically reactive group: forms a covalent bond to the protein or peptide Isotope-labeled linker: heavy or light, depending on which isotope is used Affinity tag: enables the protein or peptide bearing an ICAT to be isolated by affinity chromatography in a single step

Example of an ICAT Reagent Biotin affinity tag Thiol-reactive group note similarity to iodoacetamide binds tightly to streptavidinagarose resin * * Linker Heavy version will have deuteriums at * Light version will have hydrogens at *
-ICAT")
Cell State 1 New Methods : ICAT: quantitation and identification Modify with (H 8)-ICAT HH HH Biotin HH HH O N H Cell State 2 Modify with (d 8)-ICAT DD DD I O Biotin Combine samples N H DD DD HS- -SH • Digest Trypsin • Purify Cys-containing peptides on avidin column Intensity aa 4 aa 3 aa 2 Intensity Identify proteins by MS/MS aa 1 A 1 B 2 B 1 A 2 A 3 m/z I Quantitate protein levels by H 8 / D 8 peak heigth ratios
 and (-) - relative protein quantification by MS + - simplification of")
ICAT (+) and (-) - relative protein quantification by MS + - simplification of complex mixtures by selecting a subset of peptides after digestion - eliminate analytical variability by mixing samples - protein quantification unreliable for weak signals - - affinity purification (avidin) : losses for low amounts - multiple side reactions possible ~15 different isotope labelling methods developed in the last 5 years !!
 LC MS/MS is then utilized for identity and")
c. ICAT (cleavable isotope-coded affinity tags) LC MS/MS is then utilized for identity and quantification (relative abundance based on peak integration of Δ 8 Da peaks) http: //dir. niehs. nih. gov/proteomics/emerg 2. htm
 • Uses up to 4")
i. TRAQ (isobaric tags for relative and absolute quantification) • Uses up to 4 tag reagents that bind covalently to the N-terminus of the peptide and any Lysine side chains at the anime group (global tagging). • Each sample set is digested separately and then mixed with the specific i. TRAQ tag A B C D DIGEST Label A Label B Label C Label D

Isobaric Labels
 Mol Cell Proteomics 3(12): 1154 -69")
i. TRAQ Ross, P. L. et al. (2004) Mol Cell Proteomics 3(12): 1154 -69
 • Fragmentation of the precursor")
i. TRAQ (isobaric tags for relative and absolute quantification) • Fragmentation of the precursor ion (MS/MS) will reliably separate the tag fragment from the peptide • The fragmented tag ions will show up from 114 to 117 m/z on the spectrum • Quantitative analysis can be made by comparing the relative intensities of each of the tagged peaks

i. TRAQ Reduce & Trypsin Alkylate digest Label w/ 114 tag Sample 1 Sample 2 Sample 3 Sample 4 Label w/ 115 tag Label w/ 116 tag Mix, dilute in SCX buffer SCX Label w/ 117 tag Ross, P. L. et al. (2004) Mol Cell Proteomics 3(12): 1154 -69 Capillary RPLC-MS
 • Tags were designed to")
i. TRAQ (isobaric tags for relative and absolute quantification) • Tags were designed to produce fragments in a “quiet” spectral region
 Mol Cell Proteomics 3(12): 1154 -69")
i. TRAQ Ross, P. L. et al. (2004) Mol Cell Proteomics 3(12): 1154 -69

i. TRAQ - Peptides have the same mass from each of the samples - MS/MS of selected mass yields - Fragmentation spectra for the identification of peptide - Reporter group gives relative abundance information Ross, P. L. et al. (2004) Mol Cell Proteomics 3(12): 1154 -69

SILAC Ong SE, Blagoev B, Kratchmarova I, Kristensen DB, Steen H, Pandey A, Mann M. Stable isotope labeling by amino acids in cell culture, SILAC, as a simple and accurate approach to expression proteomics. Mol Cell Proteomics. 2002 May; 1(5): 376 -86. • Label light / heavy cultures (Leu d 0 / d 3) • Stimulate heavy cells • Mix cells or lysates • Purify fraction of interest • Analyse by LC-MS/MS (->ID) • Quantify signals of ion pairs
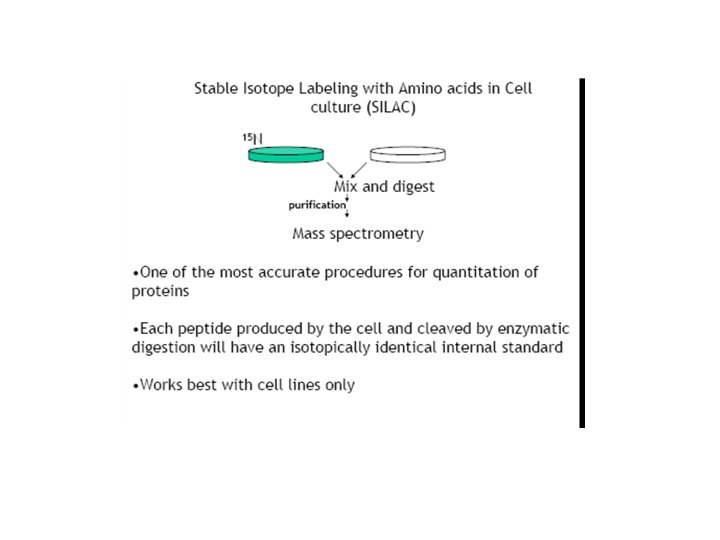

Stable Isotope Amino Acid or 15 N- in vivo Labeling • Metabolic stable isotope coding of proteomes • An equivalent number of cells from 2 distinct cultures are grown on media supplemented with either normal amino acids or 14 Nminimal media, or stable isotope amino acids (2 D/13 C/15 N) or 15 N-enriched media. • These mass tags are incorporated into proteins during translation.
 and (-) • relative protein quantification by MS + • eliminate praparative")
SILAC (+) and (-) • relative protein quantification by MS + • eliminate praparative variability by mixing samples immediately after culture • eliminate analytical variability • peptides in native state (no side reactions) • protein quantification unreliable for very weak signals - • mass shift variable (dependent on number of residues) • only feasible with organisms in culture

Enzymatic Stable Isotope Coding of Proteomes • Enzymatic digestion in the presence of 18 O-water incorporates 18 O at the carboxy-terminus of peptides • Proteins from 2 different samples are enzymatically digested in normal water or H 218 O. (Arg, Lys) R 1 R 2 R 3 R 4 . . . NH-CH-CO-NH-CH-CO-NH-CH-COOH Trypsin /H 218 O R 1 R 2 R 3 R 4 . . . NH-CH-CO-NH-CH-COO 2 HH NH 2 -CH-CO-NH-CH-COOH -1818 O C-terminal peptide

Advantages vs. Disadvantages • Estimates relative protein levels between samples with a reasonable level of accuracy (within 10%) • Can be used on complex mixtures of proteins • Cys-specific label reduces sample complexity • Peptides can be sequenced directly if tandem MS-MS is used • Yield and non specificity • Slight chromatography differences • Expensive • Tag fragmentation • Meaning of relative quantification information • No presence of cysteine residues or not accessible by ICAT reagent

PROTEIN LABELING Stable Isotope Labeling Strategies Metabolic stable isotope labeling Isotope tagging by chemical reaction Label Digest DATA COLLECTION Digest Intensity Mass spectrometry Intensity DATA ANALYSIS Stable isotope incorporation via enzyme reaction m/z m/z

Traditional Affinity-based proteomics Use antibodies to quantify proteins RPPA Western Blot Immunohistochemistry ELISA Immunofluorescence

Mass Spectrometry based proteomic quantitation Shotgun proteomics LC-MS 1. Records M/Z Targeted MS 1. Select precursor ion MS Digestion 2. Selects peptides based on abundance and fragments MS/MS 3. Protein database search for peptide identification Data Dependent Acquisition Fractionation MS 2. Precursor fragmentation MS/MS Lysis 3. Use Precursor-Fragment pairs for identification Uses predefined set of peptides
 Selected Reaction Monitoring (SRM) • • Triple Quadrupole acts as")
Multiple Reaction Monitoring (MRM) Selected Reaction Monitoring (SRM) • • Triple Quadrupole acts as ion filters Precursor selected in first mass analyzer (Q 1) Fragmented by collision activated dissociation (Q 2) One or several of the fragments are specifically measured in the second mass analyzer (Q 3)

Peptide Identification with MRM Mass Select Precursor Fragment Mass Select Fragment Ion Q 1 Q 2 Q 3 Transition • Transition: Precursor-Fragment ion pair are used for protein identification • Select both Q 1 and Q 3 prior to run – Pick Q 3 fragment ions based on discovery experiments, spectral libraries – Q 1 doubly or triply charged peptides • Use the 3 most intense transitions for quantitation

Peptide Identification with MRM • Used for to analyze small molecules since the late 1970 s • More recently, used for proteins and peptide quantitation in complex biological matrices • Particularly for biomarker discovery • With small molecules, the matrix and analyte have different chemical natures so separation step is able to remove other components from analytes Separation MS analysis • With proteomics, both the analytes and the background matrix are made up of peptides, so this separation cannot occur Separation MS analysis

Strengths of MRM • Can detect multiple transitions on the order of 10 msec per transition • Can analyze many peptides (100 s) per assay and the monitoring of many transitions per peptide • High sensitivity • High reproducibility • Detects low level analytes even in complex matrix • Golden standard for quantitation!

Weaknesses of SRM • Focuses on defined set of peptide candidates – Need to know charge state, retention time and relative product ion intensities before experimentation • Physical limit to the number of transitions that can be measured at once – Can get around this by using time-scheduled SRM, monitor transitions for a peptide in small window near retention time

Workflow of SRM proteomics Define Set of Proteins Clinical/Biological Question Proteotypic Select Peptides LC and MS properties Intensity of transitions Select Transitions. Interferences Experimental Measurements Validate Transitions Protein Quantitation

Selecting Peptides • A few representative peptides will be used to quantify each protein • Need to fulfill certain characteristics – Have an unique sequence – Consistently observed by LC-MS methods – 8 -25 amino acids – Good ionization efficiency – m/z within the range of the instrument – No missed cleavages – Not too hydrophillic (poorly retained) or hydrophobic (may stick to column)

Identifying Proteotypic Peptides Set of Proteins Step 1: Full protein sequence in FASTA format Trypsin Peptides Step 2: Tryptic Peptides Ref. Seq Ensembl Uniprot PTPIQLNPAPDGSAVNGTSSAETNLEALQK LEAFLTQK PSNIVLVNSR LEELELDEQQR DDDFEK…. . Proteotypic Peptides Step 3: Compare to human reference -Contain all peptide sequences database -Find all peptides that only map back to one gene PTPIQLNPAPDGSAVNGTSSAETNLEALQK Match LEAFLTQK Match PSNIVLVNSR peptide to proteins to LEELELDEQQR DDDFEK…. . proteins genes (Reference Protein DB) (Using protein names and genomic

LC/MS Properties: Skyline -Compares peptides to MS/MS spectral library -Predicts most abundant transitions

Applications of MRM Metabolic pathway analysis Protein complex subunit stoichiometry Phosphorylation Modifications within protein Biomarkers: protein indicator correlating to a disease state Can enrich for proteins/peptides using antibody
- Slides: 41