
Differential Gene Expression Dennis Kostka Christine Steinhoff Slides










- Slides: 59
Differential Gene Expression Dennis Kostka, Christine Steinhoff Slides adapted from Rainer Spang
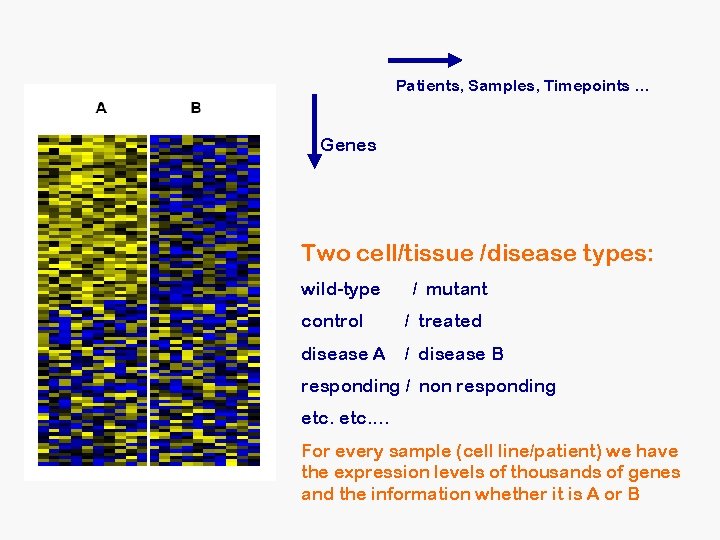
Patients, Samples, Timepoints. . . Genes Two cell/tissue /disease types: wild-type / mutant control / treated disease A / disease B responding / non responding etc. . . . For every sample (cell line/patient) we have the expression levels of thousands of genes and the information whether it is A or B
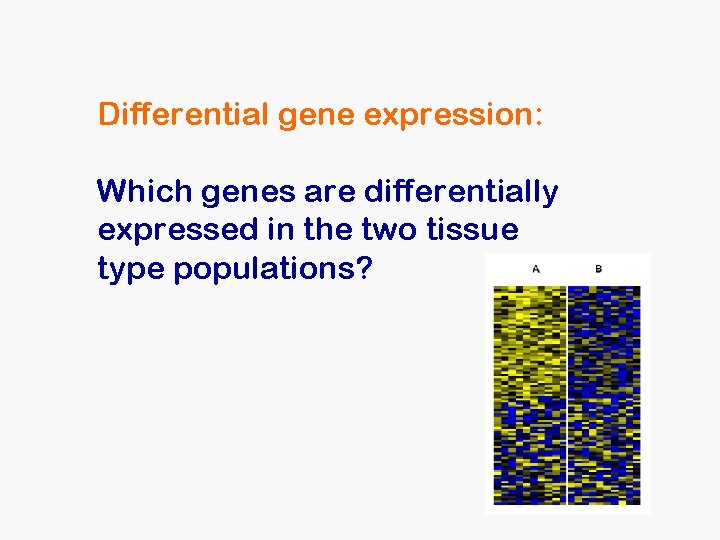
Differential gene expression: Which genes are differentially expressed in the two tissue type populations?
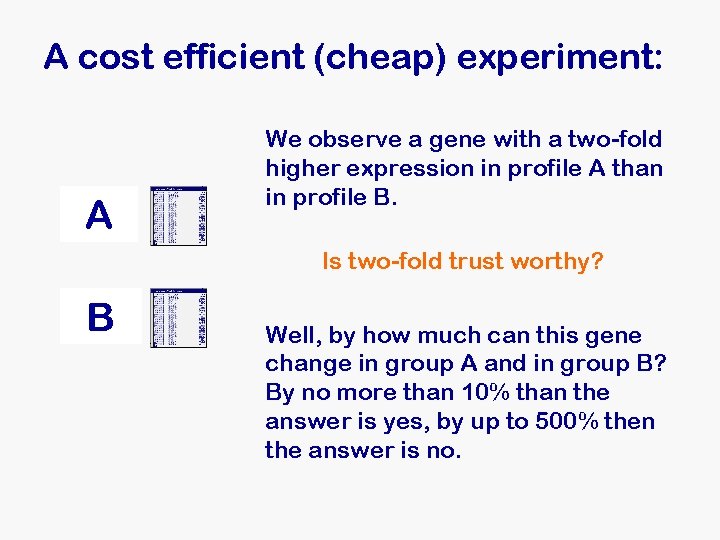
A cost efficient (cheap) experiment: A We observe a gene with a two-fold higher expression in profile A than in profile B. Is two-fold trust worthy? B Well, by how much can this gene change in group A and in group B? By no more than 10% than the answer is yes, by up to 500% then the answer is no.
A cost efficient (cheap) experiment II: A B Is a three-fold induced gene more trust worthy than a two-fold induced gene? Actually this depends on the within class variability of the two genes again, it can be the other way round.
Logratio Is a three-fold induced gene more trust worthy than a two-fold induced gene? Product intensity (logscale)
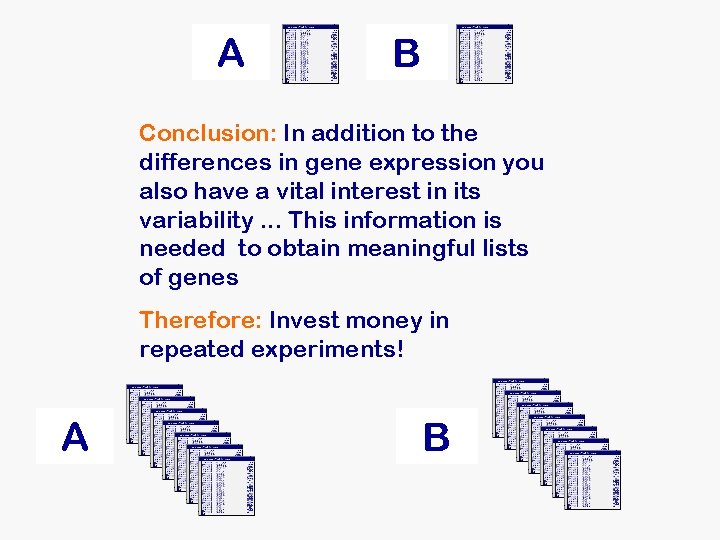
A B Conclusion: In addition to the differences in gene expression you also have a vital interest in its variability. . . This information is needed to obtain meaningful lists of genes Therefore: Invest money in repeated experiments! A B
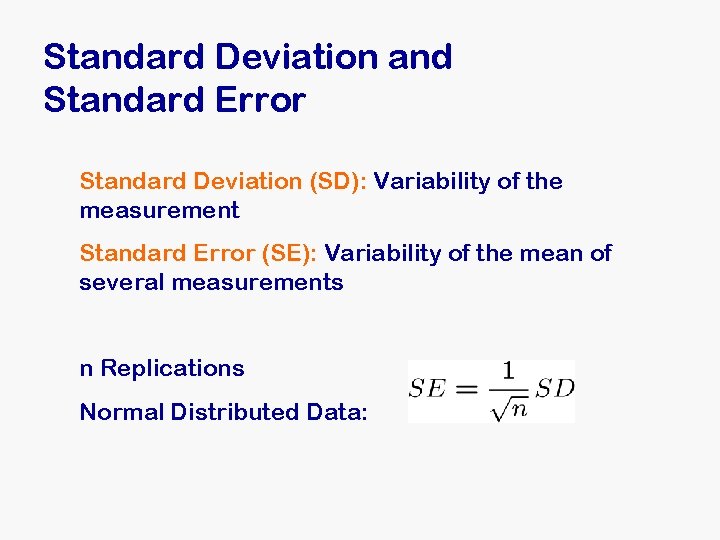
Standard Deviation and Standard Error Standard Deviation (SD): Variability of the measurement Standard Error (SE): Variability of the mean of several measurements n Replications Normal Distributed Data:
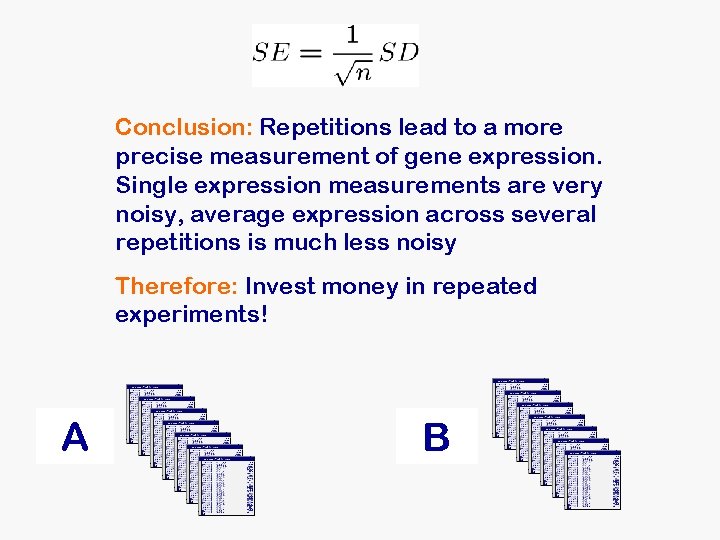
Conclusion: Repetitions lead to a more precise measurement of gene expression. Single expression measurements are very noisy, average expression across several repetitions is much less noisy Therefore: Invest money in repeated experiments! A B
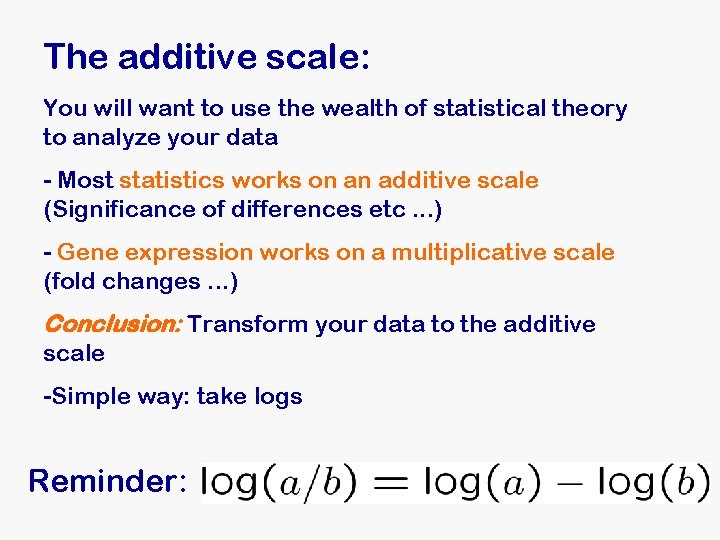
The additive scale: You will want to use the wealth of statistical theory to analyze your data - Most statistics works on an additive scale (Significance of differences etc. . . ) - Gene expression works on a multiplicative scale (fold changes. . . ) Conclusion: Transform your data to the additive scale -Simple way: take logs Reminder:
Questions: Which genes are differentially expressed? -> Ranking Are these results „significant“ -> Statistical Analysis
Ranking: Problem: Produce an ordered list of differentially expressed genes starting with the most up regulated gene and ending with the most down regulated gene Ranking means finding the right genes … drawing our attention to them In many applications it is the most important step
Ranking is not Testing Ranking: Finding the right genes Testing: Deciding whether genes are significant There is more then one way to rank There is more then one way to test The criteria for which ranking is best is different from the criteria which test is best … power is often no argument
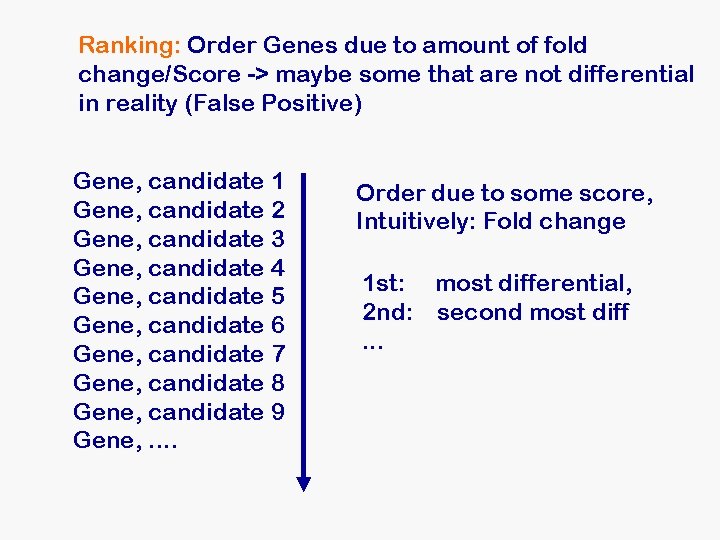
Ranking: Order Genes due to amount of fold change/Score -> maybe some that are not differential in reality (False Positive) Gene, candidate 1 Gene, candidate 2 Gene, candidate 3 Gene, candidate 4 Gene, candidate 5 Gene, candidate 6 Gene, candidate 7 Gene, candidate 8 Gene, candidate 9 Gene, . . Order due to some score, Intuitively: Fold change 1 st: most differential, 2 nd: second most diff. . .
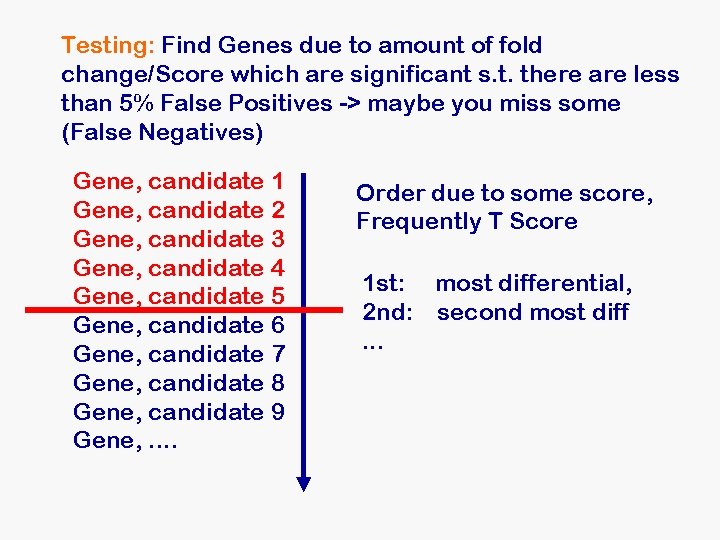
Testing: Find Genes due to amount of fold change/Score which are significant s. t. there are less than 5% False Positives -> maybe you miss some (False Negatives) Gene, candidate 1 Gene, candidate 2 Gene, candidate 3 Gene, candidate 4 Gene, candidate 5 Gene, candidate 6 Gene, candidate 7 Gene, candidate 8 Gene, candidate 9 Gene, . . Order due to some score, Frequently T Score 1 st: most differential, 2 nd: second most diff. . .
Which gene is more differentially expressed?
Ranking is Scoring You need to score differential gene expression Different scores lead to different rankings What scores are there?
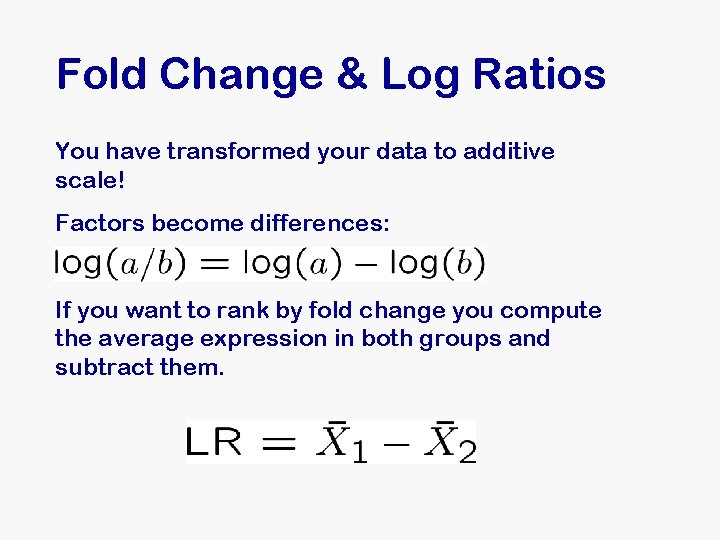
Fold Change & Log Ratios You have transformed your data to additive scale! Factors become differences: If you want to rank by fold change you compute the average expression in both groups and subtract them.
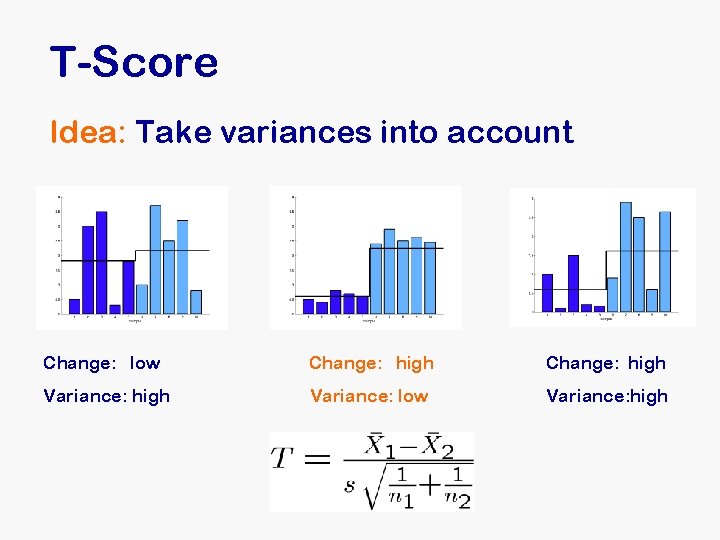
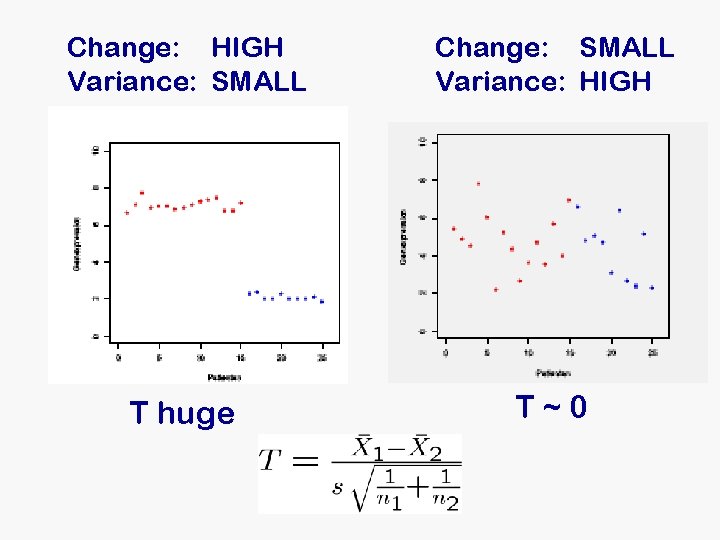
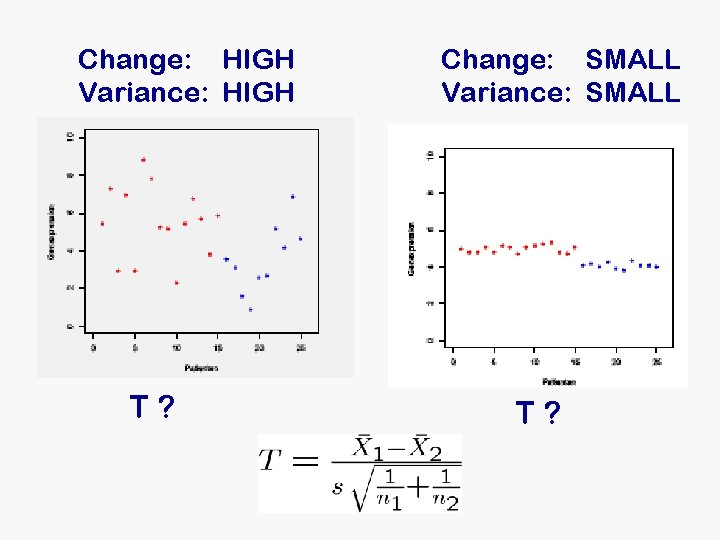
T-Score Idea: Take variances into account Change: low Change: high Variance: low Variance: high
Change: HIGH Variance: SMALL Change: SMALL Variance: HIGH T huge T~0
Change: HIGH Variance: HIGH T? Change: SMALL Variance: SMALL T?
T-Test PROBLEMS • There are many genes (-> tests) but only few repetitions • is „using s“ a estimate good? • if measured variance is small, T becomes easily very large Therefore: for microarray it is reasonable to use a modified version of the Ttest
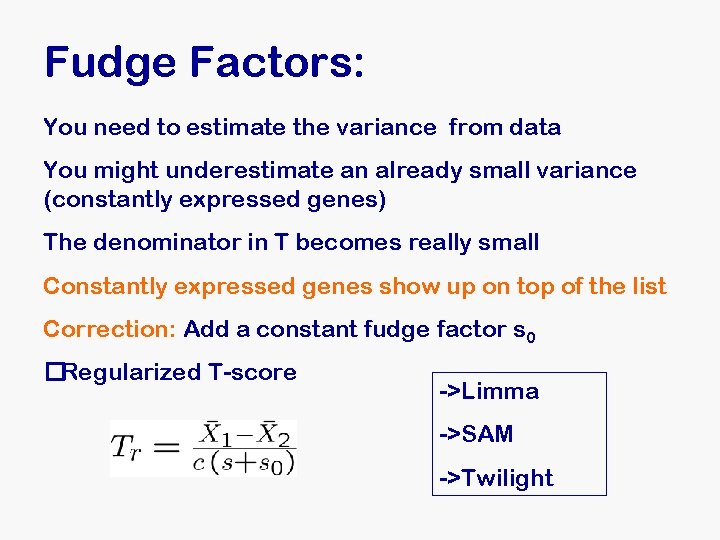
Fudge Factors: You need to estimate the variance from data You might underestimate an already small variance (constantly expressed genes) The denominator in T becomes really small Constantly expressed genes show up on top of the list Correction: Add a constant fudge factor s 0 �Regularized T-score ->Limma ->SAM ->Twilight
More Scores: - Wilcoxon Score (robust) - PAUc Score (separation) - paired t-Score (paired Data) - F-Score (more then 2 conditions) - Correlation to a reference gene - etc
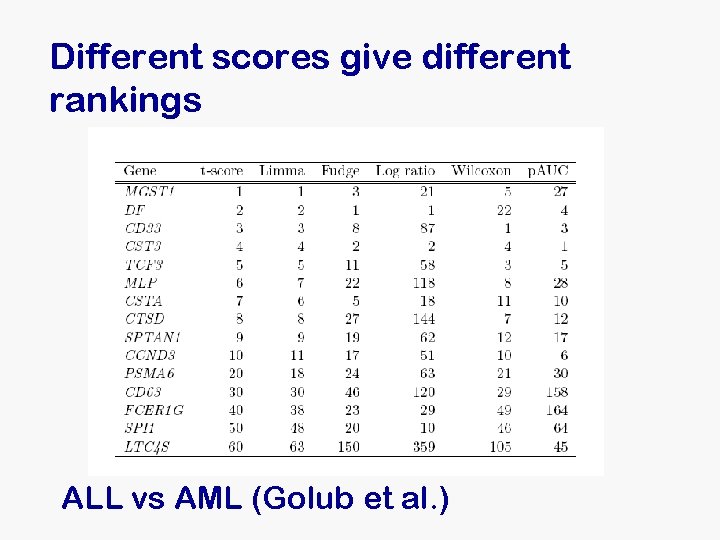
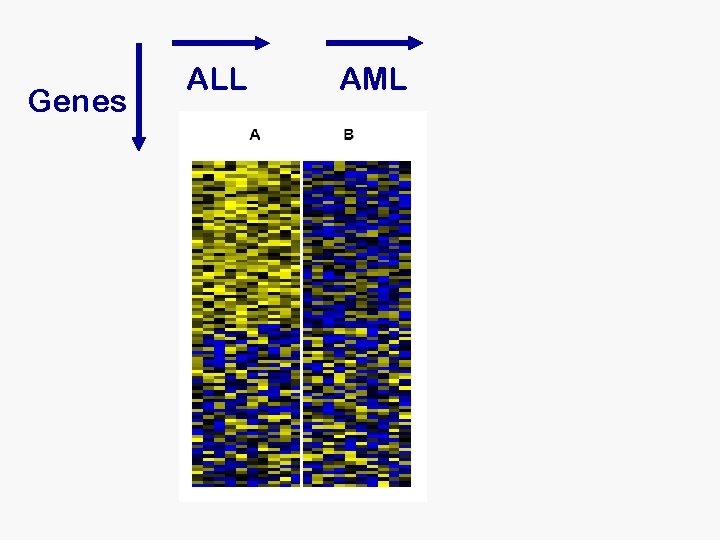
Different scores give different rankings ALL vs AML (Golub et al. )
Which Score is the best one? That depends on your problem. . .
Next Question: Ok, I chose a score and found a set of candidate genes Can I trust the observed expression differences? �Statistical Analysis
Coffee
P-Values Everyone knows that the p-value must be below 0. 05 is a holy number both in medicine and biology. . . what else should you know about pvalues
Rumors If the gene is not differentially expressed the p-value is high If the gene is differentially expressed the p-values is low Both these statements are wrong!
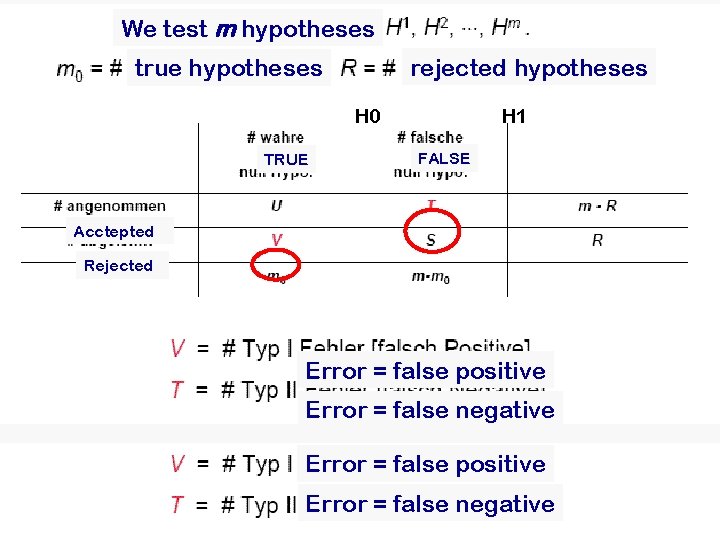
Reminder: Type I and Type II ERROR H 0 Null Hypothesis: Gene NOT differential Positive: Negative: H 1 Alternative Hypothesis: NOT H 0 rejected H 0 (differential gene) accepted H 0
Reminder: Type I and Type II ERROR H 0 H 1
The basic Idea behind p-values: We observe a score S =1. 27 Can this be just a random fluctuation? Assume: It is a random fluctuation = The gene is not differentially expressed = The null hypothesis holds Theory gives us the distribution of the score under this assumption P-Value: Probability that a random score is equal or higher to S =1. 27 in absolute value (two sided test)
Permutations and empirical p-values
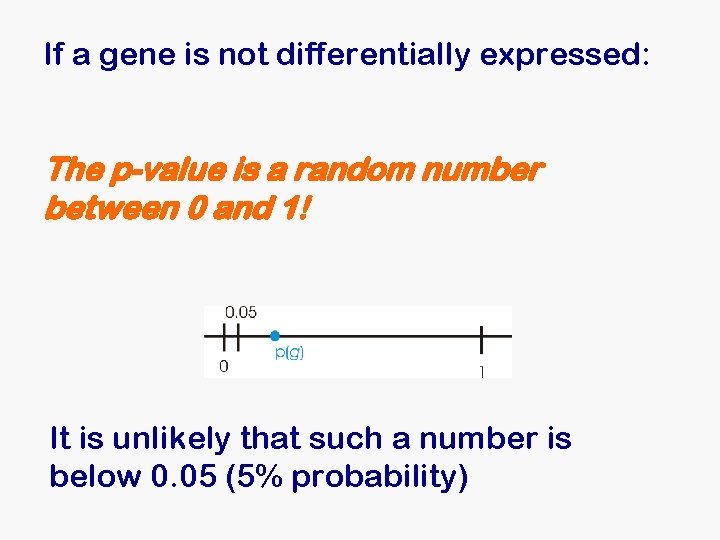
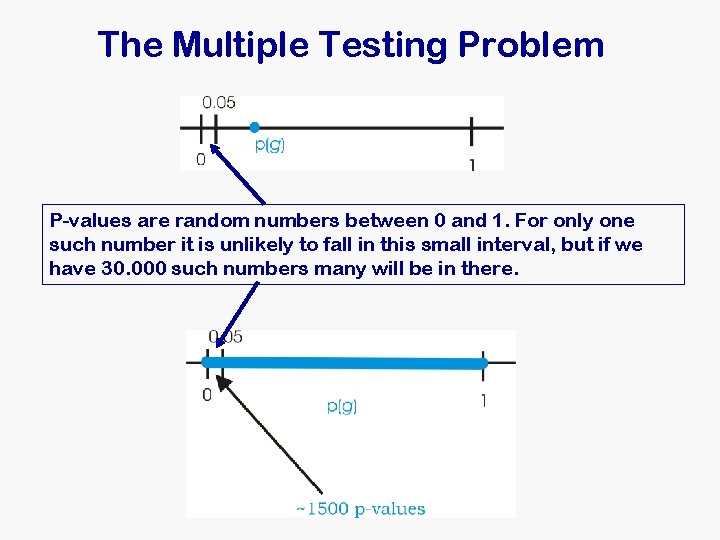
If a gene is not differentially expressed: The p-value is a random number between 0 and 1! It is unlikely that such a number is below 0. 05 (5% probability)
If a gene is differentially expressed: The p-value has no meaning, since it was computed under the assumption that the gene is not differentially expressed.
Testing only one gene: If the gene is not differentially expressed a small p-value is unlikely, hence we should be surprised by this observation. If we make it a rule that we discard the gene if the p-values is above 0. 05, it is unlikely that a random score will pass this filter
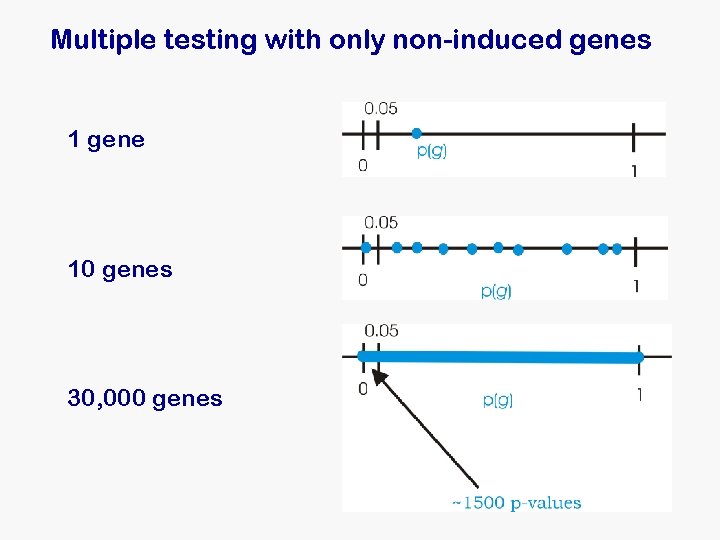
Multiple testing with only non-induced genes 1 gene 10 genes 30, 000 genes
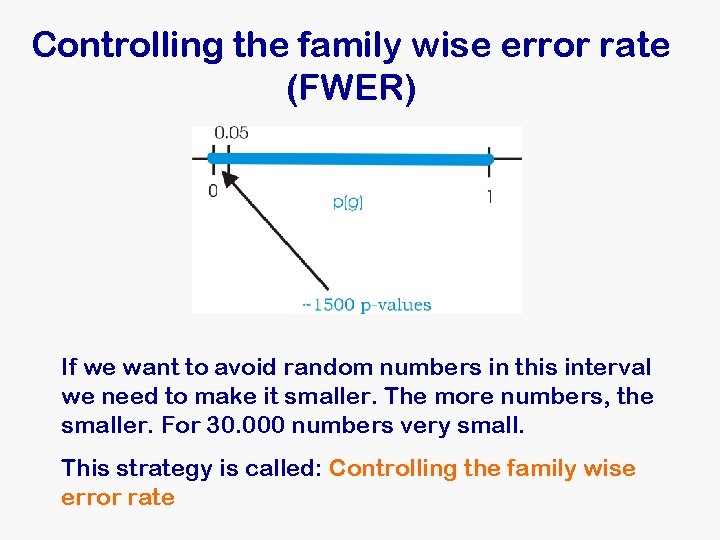
The Multiple Testing Problem P-values are random numbers between 0 and 1. For only one such number it is unlikely to fall in this small interval, but if we have 30. 000 such numbers many will be in there.
We test m hypotheses rejected hypotheses true hypotheses H 0 TRUE H 1 FALSE Acctepted Rejected Error = false positive Error = false negative
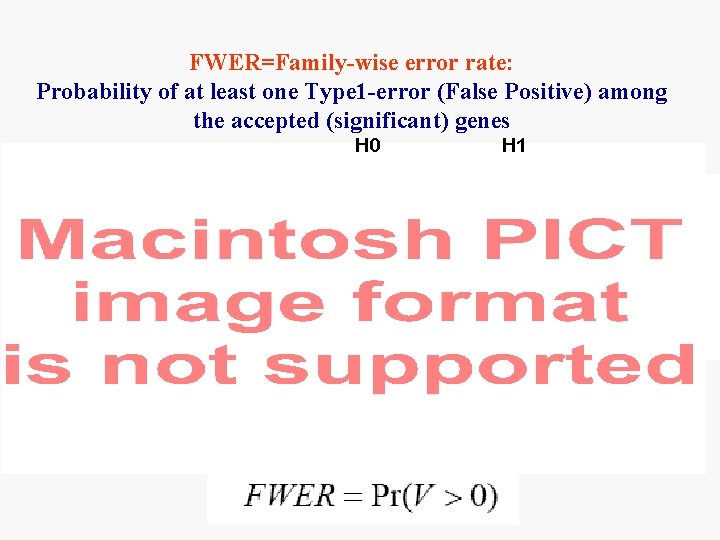
FWER=Family-wise error rate: Probability of at least one Type 1 -error (False Positive) among the accepted (significant) genes H 0 TRUE Accepted Rejected H 1 FALSE
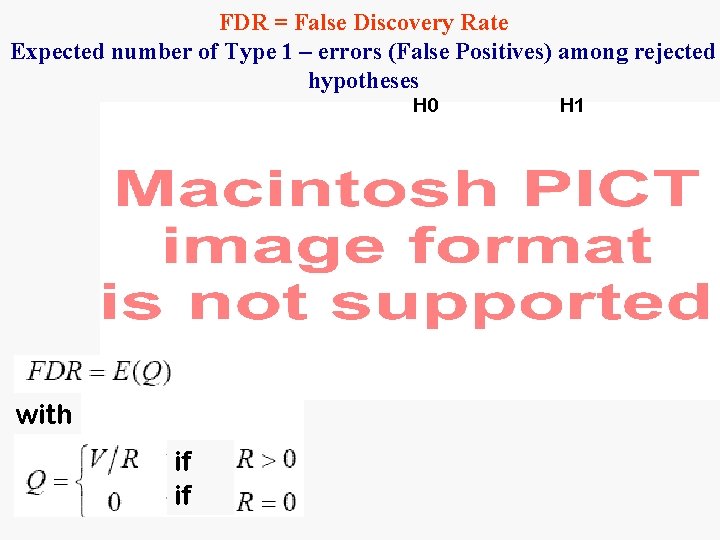
FDR = False Discovery Rate Expected number of Type 1 – errors (False Positives) among rejected hypotheses H 0 TRUE Accepted Rejected with if if FALSE H 1
Controlling the family wise error rate (FWER) If we want to avoid random numbers in this interval we need to make it smaller. The more numbers, the smaller. For 30. 000 numbers very small. This strategy is called: Controlling the family wise error rate
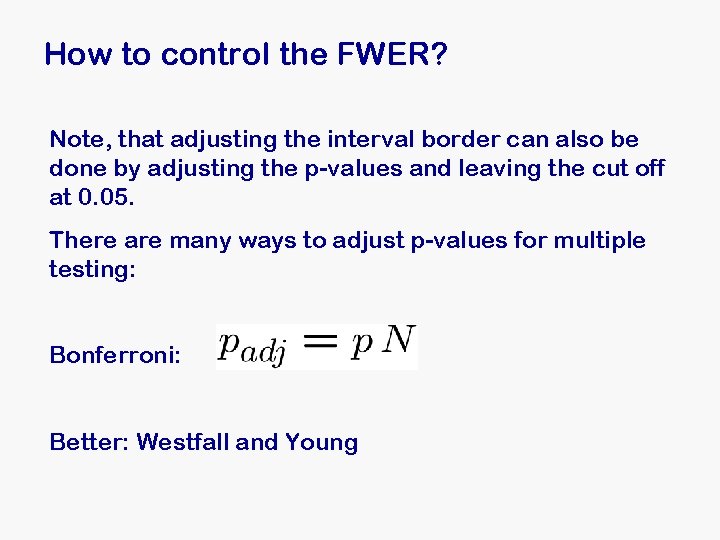
How to control the FWER? Note, that adjusting the interval border can also be done by adjusting the p-values and leaving the cut off at 0. 05. There are many ways to adjust p-values for multiple testing: Bonferroni: Better: Westfall and Young
In microarray studies controlling the FWER is not a good idea. . . It is too conservative. A different type of error measure became more popular The False Discovery Rate What is the idea?
The FDR 1. Score genes and rank them 2. Choose a cutoff 3. Loosely speaking: The FDR is the best guess for the number of false positive genes that score above the cutoff
The confusing literature: There are many different definitions of the false discovery rate in the literature: - Original: Benjamini-Hochberg - Positive FDR - Conditional FDR - Local FDR There is also a fundamental difference between controlling and estimating a FDR
In microarray analysis it became popular to use estimated FDRs Differences to p-values: The FDR refers to a list of genes. The p-value refers to a single gene. The p-value is based on the assumption that the gene is not differentially expressed, the FDR makes no such assumption. P-values need to be corrected for multiplicity, FDRs not!
Another difference in concept: If a 4 x change has a small p-value, this means that 4 x change is too high to be random fluctuation Conclusion: 4 x change is significant If a list of 150 genes with 4 x change or more has a small estimated FDR this means that we have more genes on this level than would be expected by chance. Conclusion: 4 x change can be noise, but 150 genes on that level are too many to be explained just by random fluctuation. In FWER Analysis the fold change 4 x is significant, in FDR Analysis it is the number 150 that is significant.
Histograms of the p-values of all genes on the array
FWER: Vertical cutoff FDR: Horizontal cutoff
The typical plots Expected random score vs observed scores: Deviations from the main diagonal are evidence for differentially expressed genes
What you typically observe No differential gene expression A lot of differential gene expression Global changes in gene expression
Summary • Replications are useful, not only for statistical reasons (5 -8 per leg) • Low FWER p-values will lead to many missed genes • FDR (SAM) seems more appropriate • Often there are many induced genes • There are many open questions related to this type of intensive multiple tests
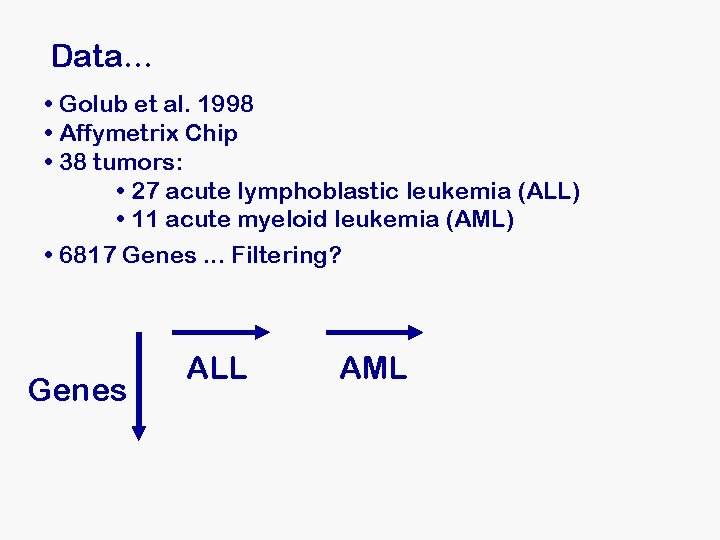
Data. . . • Golub et al. 1998 • Affymetrix Chip • 38 tumors: • 27 acute lymphoblastic leukemia (ALL) • 11 acute myeloid leukemia (AML) • 6817 Genes. . . Filtering? Genes ALL AML
Genes ALL AML
Questions ?
Coffee