Did the Sunspot Cycle Cause the Fall of


, English lawyer and scientist. “I think the cause of the")


 Sea-level pressure regressed on an index of the")
 850 -h. Pa height regressed on an index")
 Storm activity Ø 30% of winter variance HIGH")

![Evolution of Vortex Weakening ONSET [T] [u] EP Flux 30 20 10 0 40](https://slidetodoc.com/presentation_image_h/0ece473e58507b6c3f0e855bfc969583/image-35.jpg "Evolution of Vortex Weakening ONSET [T] [u] EP Flux 30 20 10 0 40")
![Evolution of Vortex Weakening GROWTH [T] [u] EP Flux 30 20 10 0 40](https://slidetodoc.com/presentation_image_h/0ece473e58507b6c3f0e855bfc969583/image-36.jpg "Evolution of Vortex Weakening GROWTH [T] [u] EP Flux 30 20 10 0 40")
![Evolution of Vortex Weakening MATURE [T] [u] EP Flux 30 20 10 0 40](https://slidetodoc.com/presentation_image_h/0ece473e58507b6c3f0e855bfc969583/image-37.jpg "Evolution of Vortex Weakening MATURE [T] [u] EP Flux 30 20 10 0 40")
![Evolution of Vortex Weakening DECLINE [T] [u] EP Flux 30 20 10 0 40](https://slidetodoc.com/presentation_image_h/0ece473e58507b6c3f0e855bfc969583/image-38.jpg "Evolution of Vortex Weakening DECLINE [T] [u] EP Flux 30 20 10 0 40")
![Evolution of Vortex Weakening DECAY [T] [u] EP Flux 30 20 10 0 40](https://slidetodoc.com/presentation_image_h/0ece473e58507b6c3f0e855bfc969583/image-39.jpg "Evolution of Vortex Weakening DECAY [T] [u] EP Flux 30 20 10 0 40")
 JET warmer STRATOSPHERE heat flux QBO momentum")


 and")


- Slides: 58
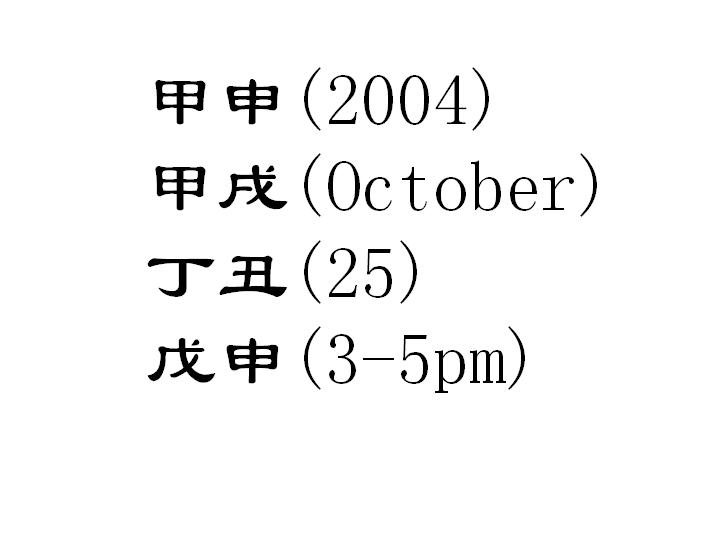
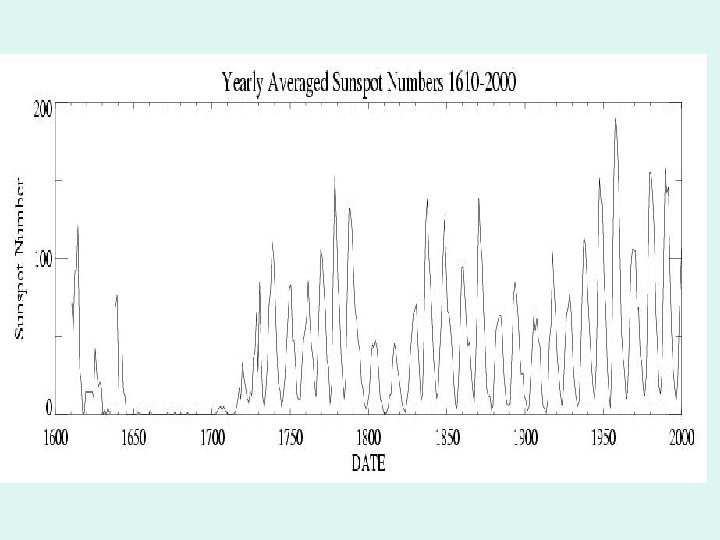
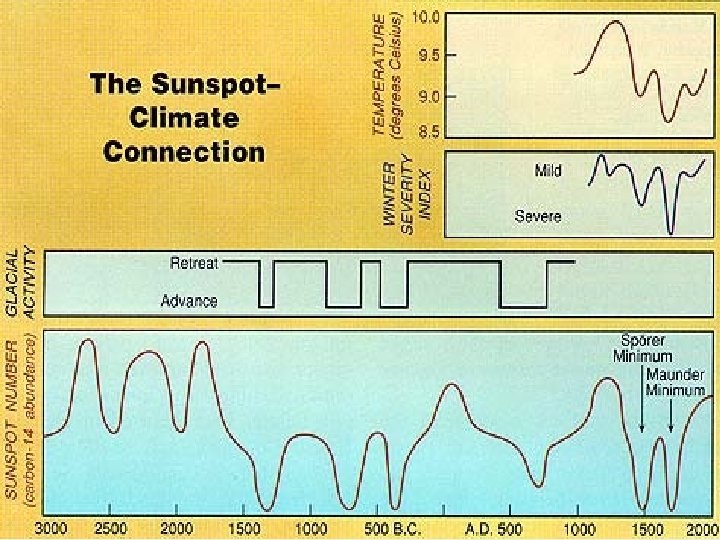
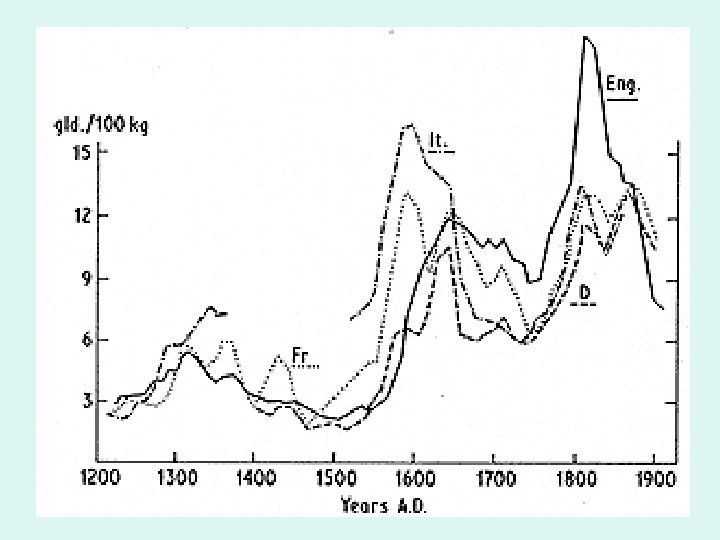
Did the Sunspot Cycle Cause the Fall of the Ming Dynasty? Yuk Ling Yung http: //www. gps. caltech. edu/faculty/yung CUHK 25 Oct 2004
1644. 3. 29 1944. 3. 29
49 52
68 100
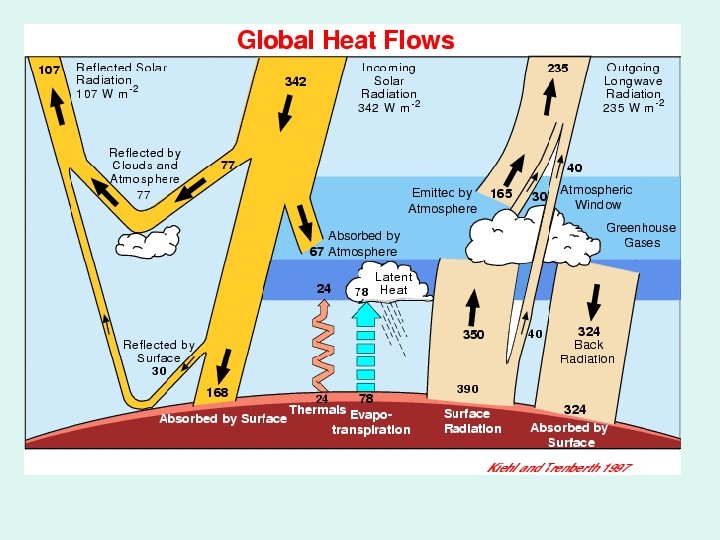
Surface Top-of-atmosphere Surface Net Shortwave Differences Kiehl and Trenberth 1997
Radiation TOA ASR OLR NET Quite strong structure due to clouds in ASR and OLR that mostly cancels in the net; some other albedo effects (e. g. , Sahara) and land-sea differences, but sun -Earth geometry explains most of pattern. Trenberth and Stepaniak, J. Clim. 2003
George Hadley (1685 -1768), English lawyer and scientist. “I think the cause of the general Trade-winds have not been explained by any of those who have wrote on that subject” (1735) The overturning Hadley cells are the main way the atmosphere transports energy polewards in low latitudes
Net Radiation TOA Difference due to ocean transports Total heating Q 1 -Q 2 Trenberth & Stepaniak, 2003
Annual mean net surface flux
OCEAN-ATMOSPHERE TRANSPORTS Estimate of the partitioning of meridional transports by the atmosphere and ocean. Trenberth and Caron, J. Clim. 2001 At 35° latitude, where the peak polewards transport occurs the atmosphere accounts for 78% (NH) and 92% (SH) of the total. Values estimated from atmospheric analyses agree with direct ocean estimates and those from the best coupled climate models (including CCSM).
Departures from annual mean: Equivalent ocean heat content (Ignores annual cycle in ocean heat transports)
Changing atmospheric composition: CO 2 Mauna Loa, Hawaii Data from Climate Monitoring and Diagnostics Lab. , NOAA. Data prior to 1973 from C. Keeling, Scripps Inst. Oceanogr.
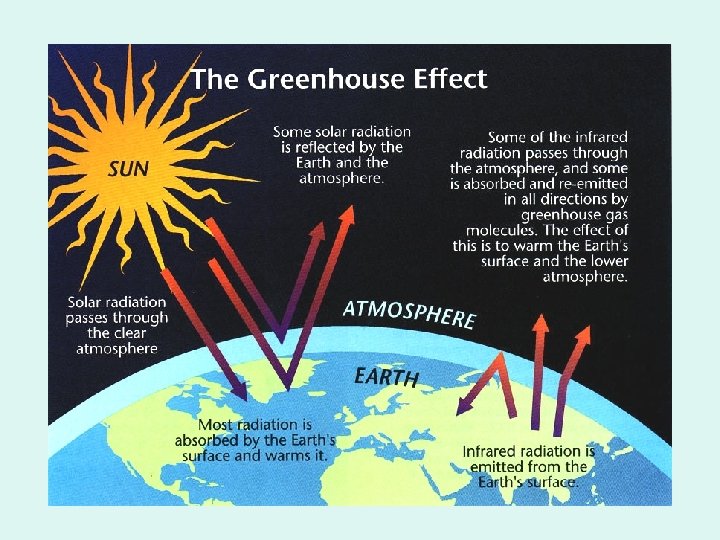
The enhanced greenhouse effect CO 2 has increased >30% If CO 2 were suddenly doubled then: • atmosphere must warm up to restore balance via radiation to space • In absence of other changes: warming is 1. 2°C • Feedbacks cause complications • Best estimate is warming of 2. 5°C so feedbacks roughly double change • Real world changes complex and more gradual
Annual mean departures from the 1961 -90 average for global temperatures, mean 14. 0°C, and carbon dioxide concentrations from ice cores and Mauna Loa (1958 on), mean 333. 7 ppmv. Karl and Trenberth 2003
The Global Mean Radiative Forcing of the Climate System for the Year 2000, Relative to 1750
What about changes in the ocean heat content? Changes in Ocean heat content in upper 3000 m Changes in Ocean heat content in upper 300 m Contributes to rise in sea level. Levitus et al. 2000
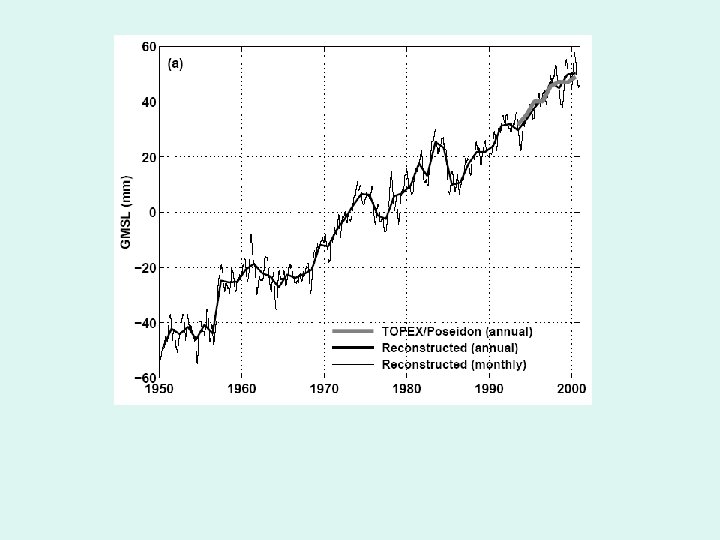
Oceans and Sea Level New global observations by satellite: TOPEXPoseiden, Jason 1993 -2003 Thermal expansion can account for almost all in 1990 s, but sea level rise from melting glaciers etc is about 1 mm/yr. Increased use (irrigation) and storage (reservoirs) on land – 1 mm/yr. If true: heat going into ocean could be 1. 5 W m-2 but other estimates are more like 0. 95 W m-2 Willis et al. 2004 *0. 7 to account for area of ocean. Cazenave and Nerem, 2004
Prince’s Dilemma It happens then as it does to physicians in the treatment of consumption, which in the commencement is easy to cure and difficult to understand; but when it has neither been discovered in due time nor treated upon a proper principle, it becomes easy to understand difficult to cure. The same happens in state affairs; by foreseeing them at a distance … the evils which might arise from them are soon cured; but when, from want of foresight, they are suffered to increase to such a height that they are perceptible to everyone, there is no longer any remedy.
The Northern Hemisphere annular mode (NAM) Sea-level pressure regressed on an index of the NAM e. g. , Thompson and Wallace 2000
The Southern Hemisphere annular mode (SAM) 850 -h. Pa height regressed on an index of the SAM e. g. , Kidson, Karoly, Trenberth, etc.
The Northern Hemisphere Annular Mode (NAM) Storm activity Ø 30% of winter variance HIGH LOW
Climate impacts of the NAM Surface temperature regressed on the NAM index Provided courtesy of Todd Mitchell, UW
Evolution of Vortex Weakening ONSET [T] [u] EP Flux 30 20 10 0 40 S 300 EQ 40 N 80 N 40 S EQ 40 N Height Field Altitude (km) 10 50 h. Pa 250 h. Pa 1000 h. Pa (c. i. = 3 dam) (c. i. = 1 dam) (c. i. = 0. 5 dam) 1000 80 N Pressure (h. Pa) 30
Evolution of Vortex Weakening GROWTH [T] [u] EP Flux 30 20 10 0 40 S 300 EQ 40 N 80 N 40 S EQ 40 N Height Field Altitude (km) 10 50 h. Pa 250 h. Pa 1000 h. Pa (c. i. = 3 dam) (c. i. = 1 dam) (c. i. = 0. 5 dam) 1000 80 N Pressure (h. Pa) 30
Evolution of Vortex Weakening MATURE [T] [u] EP Flux 30 20 10 0 40 S 300 EQ 40 N 80 N 40 S EQ 40 N Height Field Altitude (km) 10 50 h. Pa 250 h. Pa 1000 h. Pa (c. i. = 3 dam) (c. i. = 1 dam) (c. i. = 0. 5 dam) 1000 80 N Pressure (h. Pa) 30
Evolution of Vortex Weakening DECLINE [T] [u] EP Flux 30 20 10 0 40 S 300 EQ 40 N 80 N 40 S EQ 40 N Height Field Altitude (km) 10 50 h. Pa 250 h. Pa 1000 h. Pa (c. i. = 3 dam) (c. i. = 1 dam) (c. i. = 0. 5 dam) 1000 80 N Pressure (h. Pa) 30
Evolution of Vortex Weakening DECAY [T] [u] EP Flux 30 20 10 0 40 S 300 EQ 40 N 80 N 40 S EQ 40 N Height Field Altitude (km) 10 50 h. Pa 250 h. Pa 1000 h. Pa (c. i. = 3 dam) (c. i. = 1 dam) (c. i. = 0. 5 dam) 1000 80 N Pressure (h. Pa) 30
More Remarks VORTEX heat flux ALTITUDE (km) JET warmer STRATOSPHERE heat flux QBO momentum flux TROPOPAUSE TROPOSPHERE ENSO EQUATOR EAST LOW NAM WINTERTIME NORTH POLE
Example of inter-calibration • • A-SST off Portugal B-T Greenland C-T Antarctic Deep ocean T, carbonate shells
History of climate during last 43, 000 yrs. • O 18 (A, B) and Methane (C) • Major instabilities until 11, 000 ybp • Stability after Younger Dryas
Ocean circulation distributes temperature around globe • • Figure shows modern ocean convection • There are other “stable”convection patterns
Climate crisis, Younger Dryas • The last cold period before present; 12, 90011500 YBP • Cold and dry • Fast onset & cut-off--(75 years, )
Acknowledgements • • NASA NSF JPL K. Trenberth D. Thompson W. Chen V. Limpasuvan J. Feynman and A. Ruzmaikin