
Diagnostic Tests Afshin Ostovar Bushehr University of Medical
Diagnostic Tests Afshin Ostovar Bushehr University of Medical Sciences Bushehr, 2013 2/25/2021 1
A normal individual is a person; Who has not been sufficiently examined 2/25/2021 2
Introduction l It is necessary to distinguish between people in the population who have the disease and those who do not. l clinical arena l Public health arena l How good is the test in separating populations of people with and without the disease in question? 2/25/2021 3
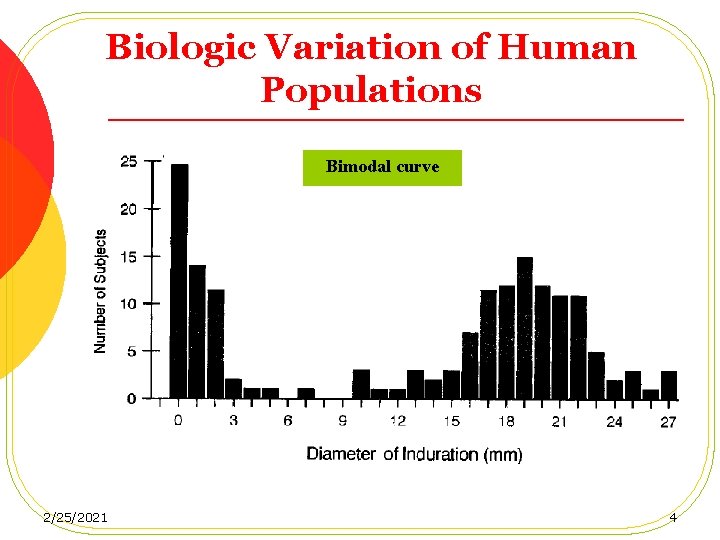
Biologic Variation of Human Populations Bimodal curve 2/25/2021 4
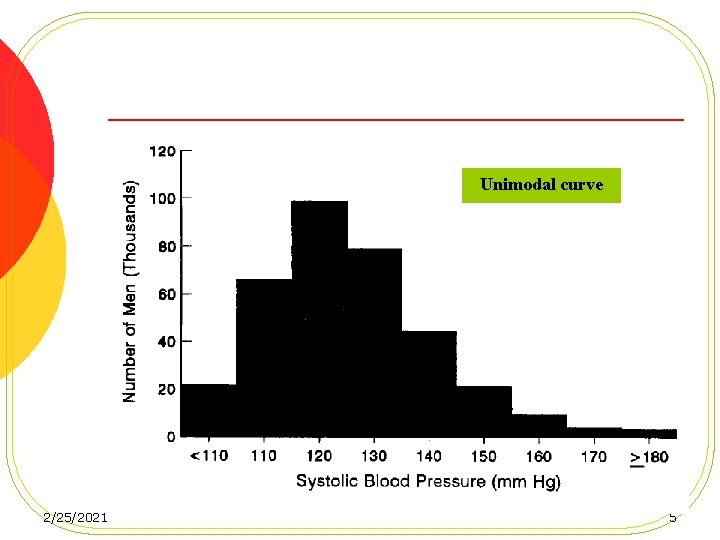
Unimodal curve 2/25/2021 5
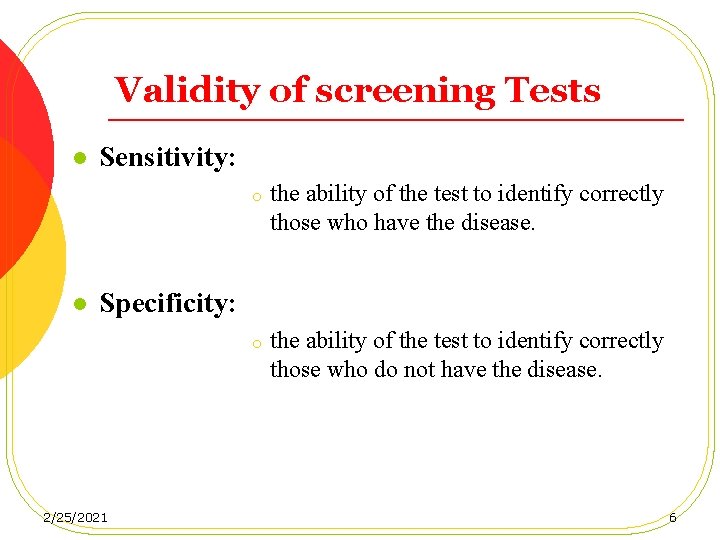
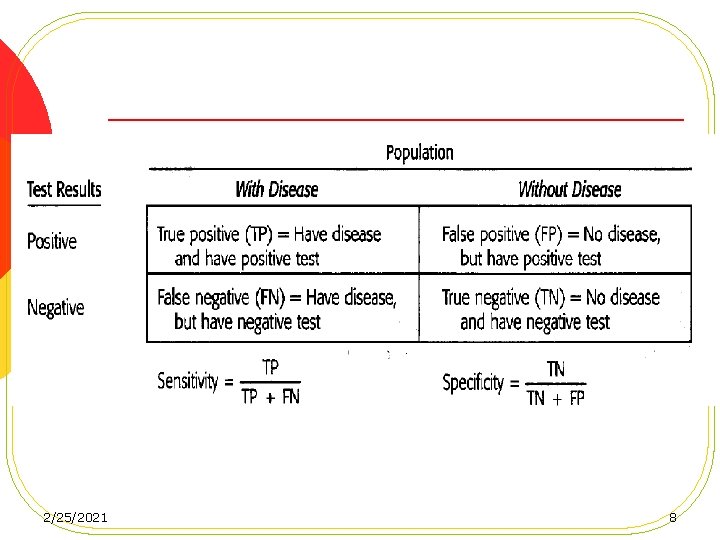
Validity of screening Tests l l Sensitivity: o the ability of the test to identify correctly those who have the disease. o the ability of the test to identify correctly those who do not have the disease. Specificity: 2/25/2021 6
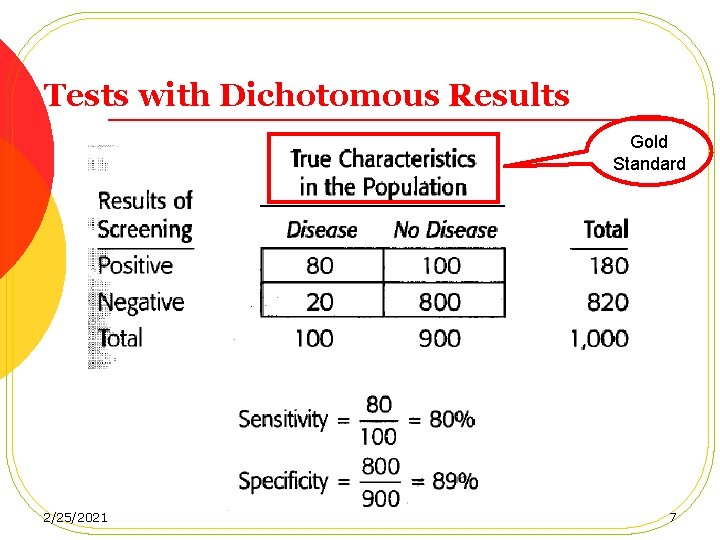
Tests with Dichotomous Results Gold Standard 2/25/2021 7
2/25/2021 8
False Positive effects l Burden on the health care system l Labeling effect 2/25/2021 9
False Negative effects l Deprivation from effective treatment l It depends on: l the nature and severity of the disease l the effectiveness of available intervention measure l Whether the effectiveness is greater if the intervention is administered early in the natural history of the disease 2/25/2021 10
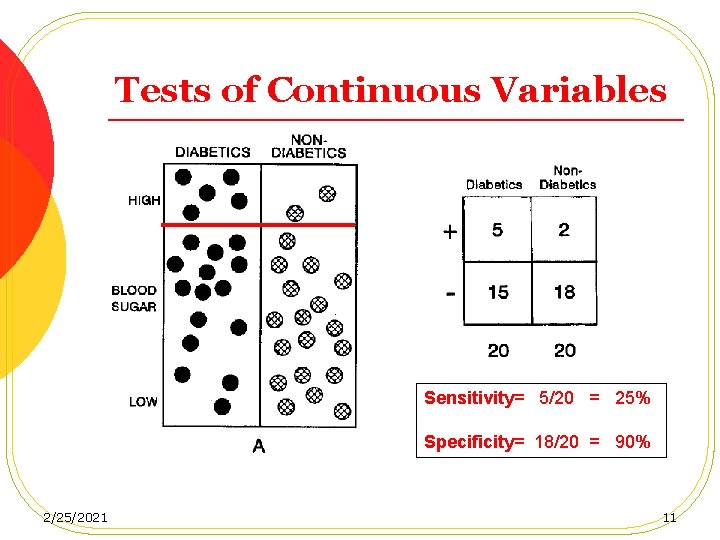
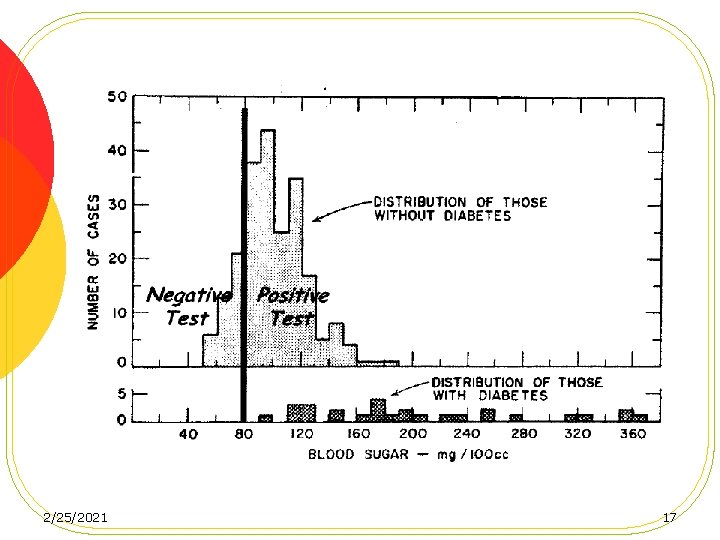
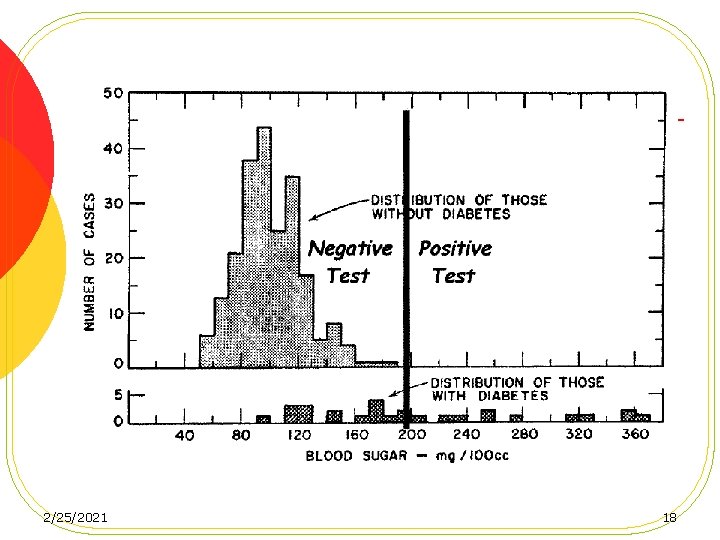
Tests of Continuous Variables Sensitivity= 5/20 = 25% Specificity= 18/20 = 90% 2/25/2021 11
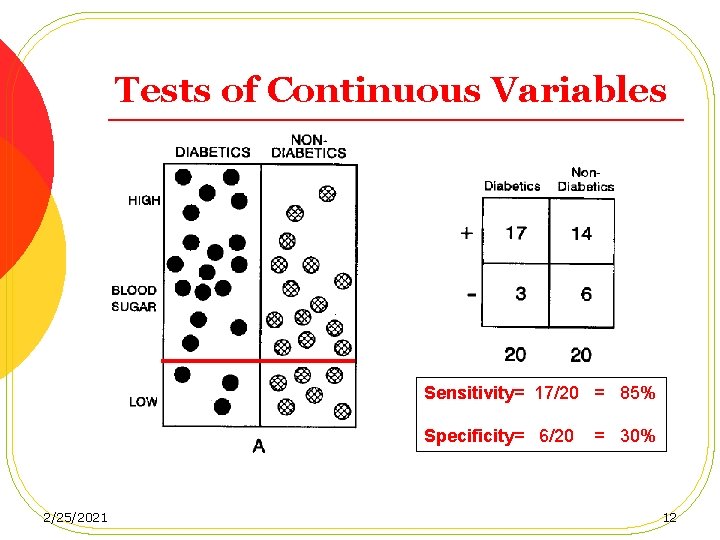
Tests of Continuous Variables Sensitivity= 17/20 = 85% Specificity= 6/20 2/25/2021 = 30% 12
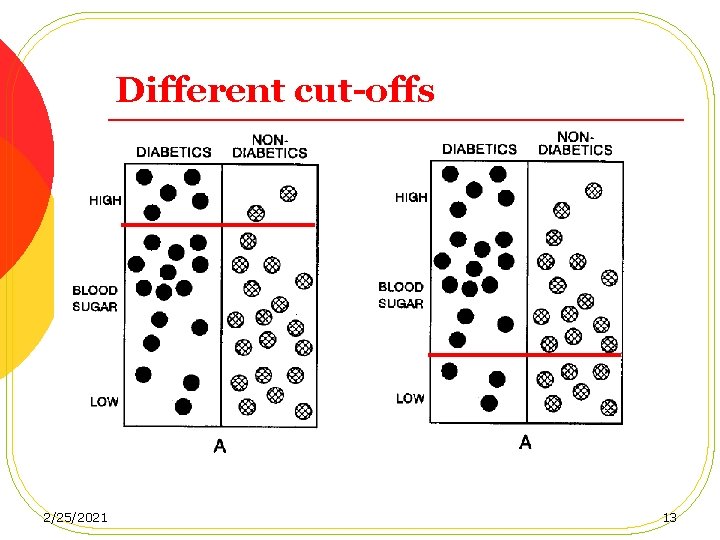
Different cut-offs 2/25/2021 13
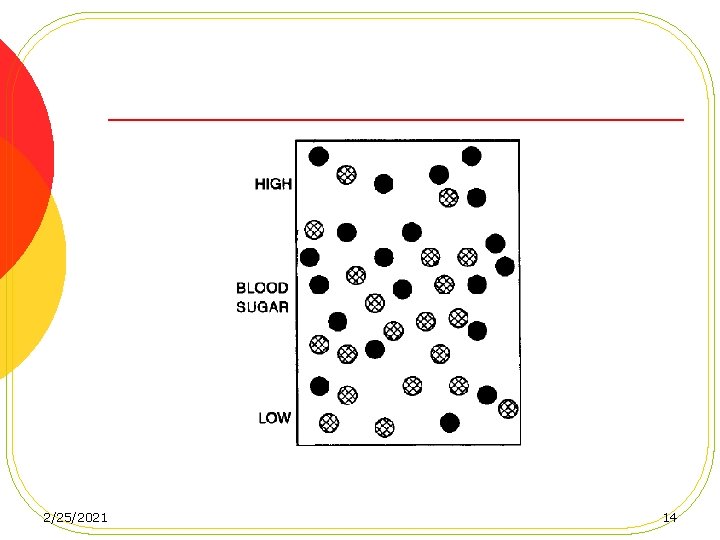
2/25/2021 14
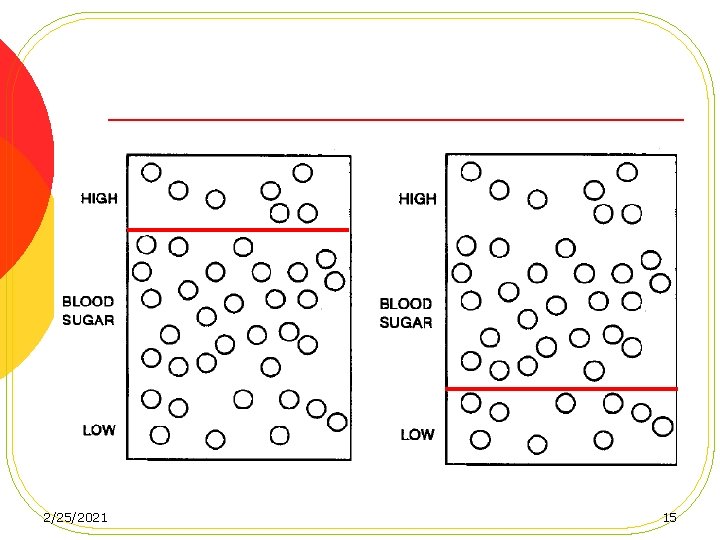
2/25/2021 15
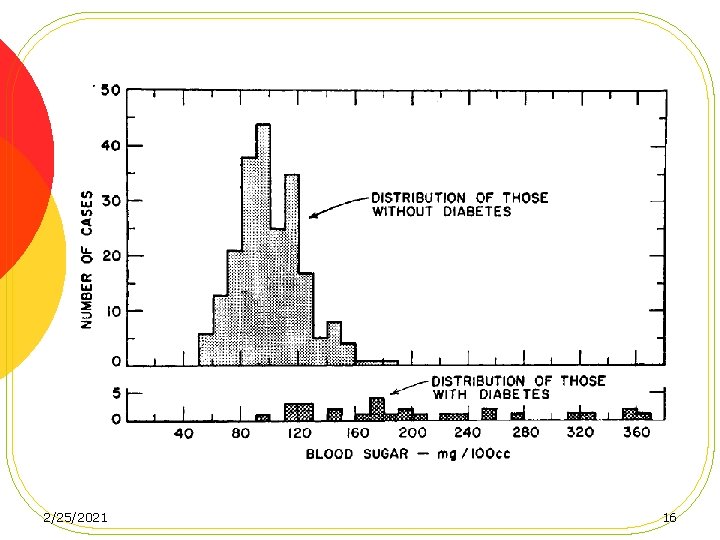
2/25/2021 16
2/25/2021 17
2/25/2021 18
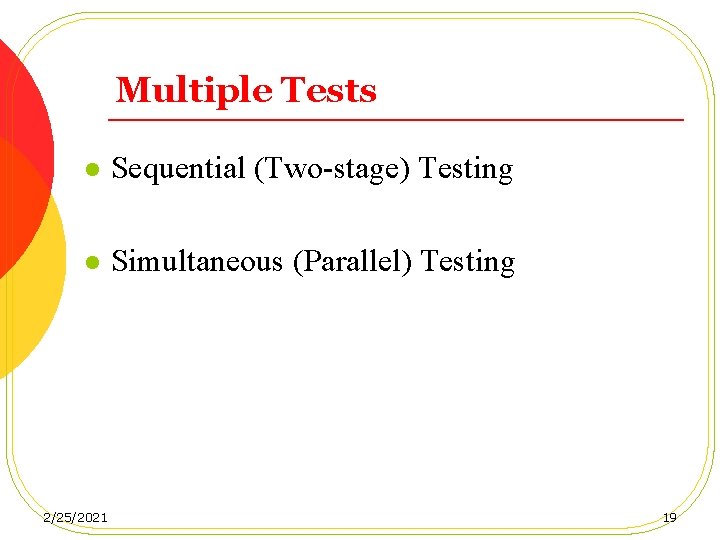
Multiple Tests l Sequential (Two-stage) Testing l Simultaneous (Parallel) Testing 2/25/2021 19
Sequential (Two-stage) Testing 2/25/2021 20
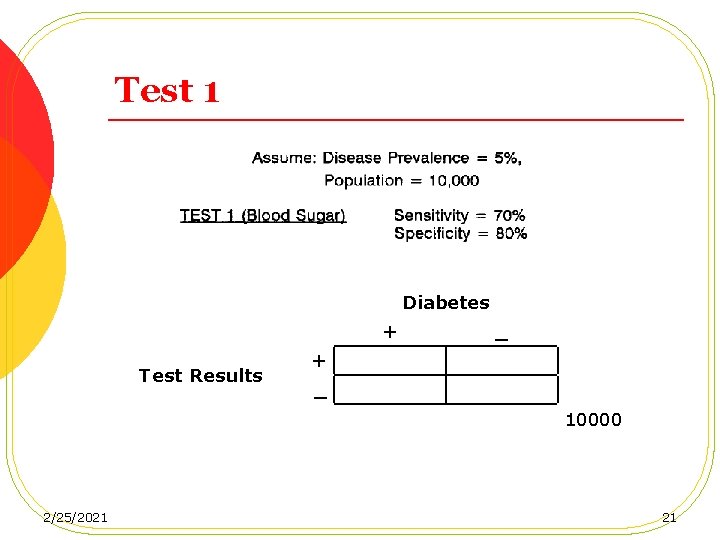
Test 1 Diabetes + Test Results _ + _ 10000 2/25/2021 21
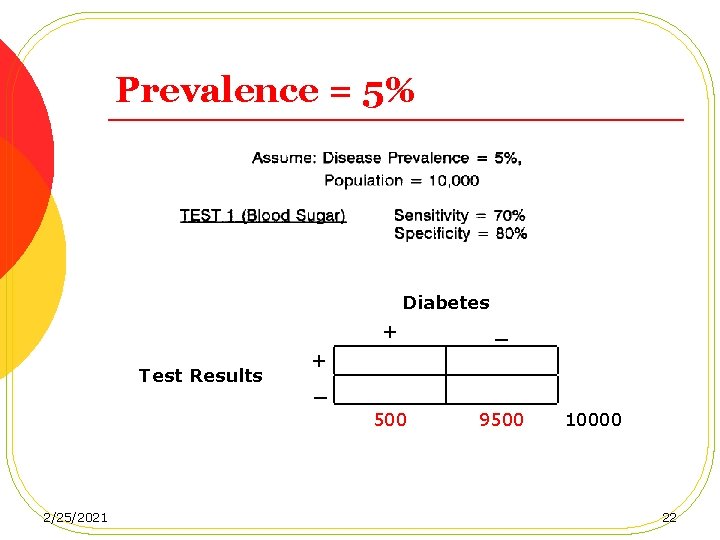
Prevalence = 5% Diabetes Test Results 2/25/2021 + _ 500 9500 + _ 10000 22
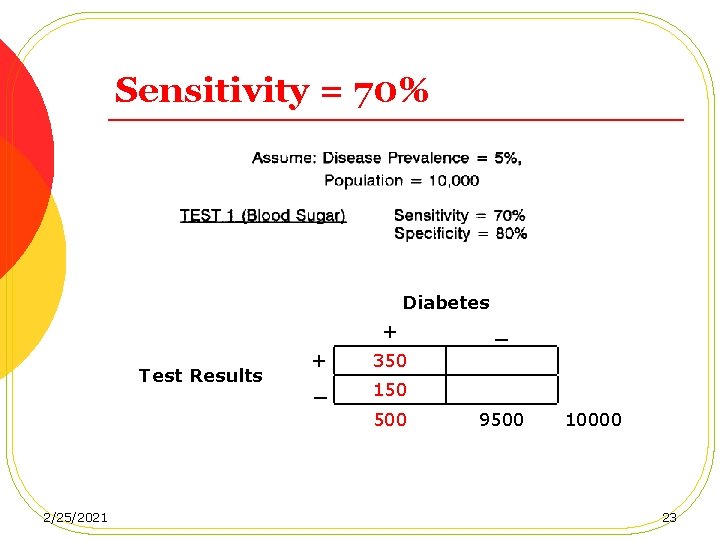
Sensitivity = 70% Diabetes + Test Results + 350 _ 150 500 2/25/2021 _ 9500 10000 23
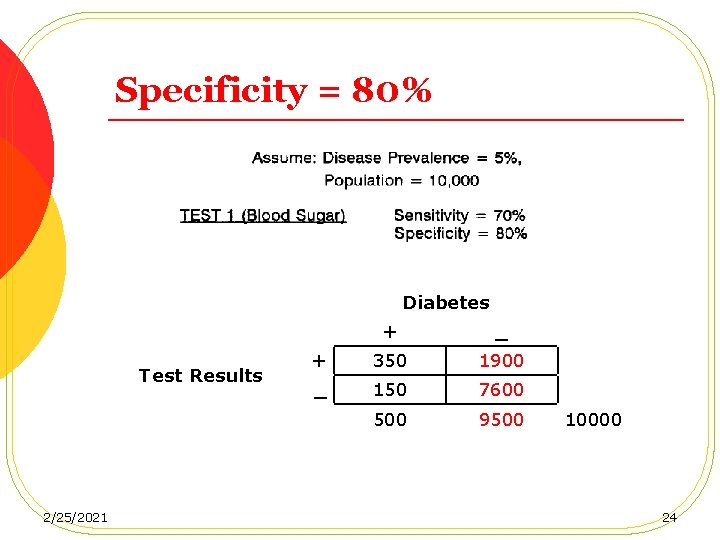
Specificity = 80% Diabetes Test Results 2/25/2021 + _ + 350 1900 _ 150 7600 500 9500 10000 24
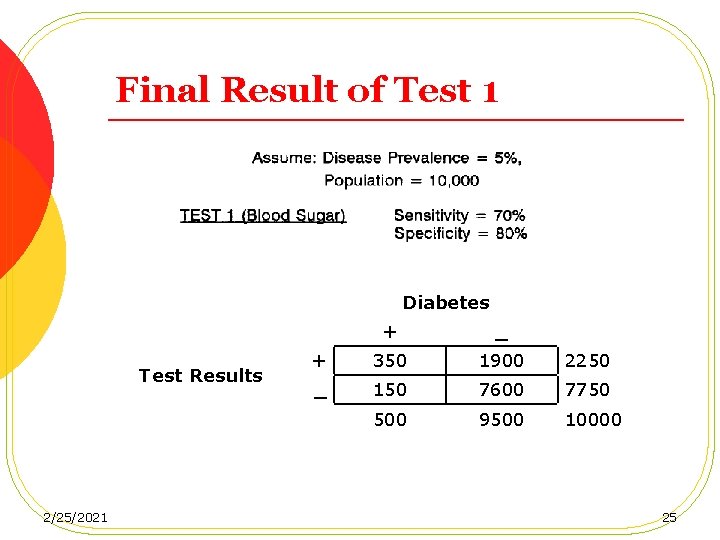
Final Result of Test 1 Diabetes Test Results 2/25/2021 + _ + 350 1900 2250 _ 150 7600 7750 500 9500 10000 25
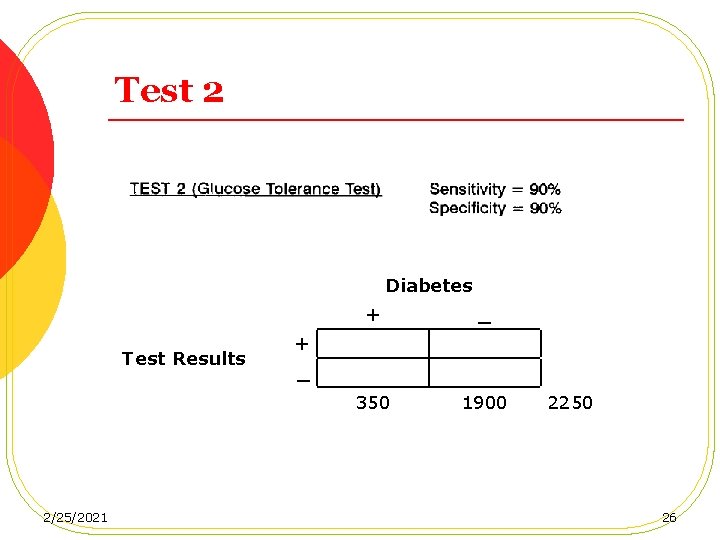
Test 2 Diabetes Test Results 2/25/2021 + _ 350 1900 + _ 2250 26
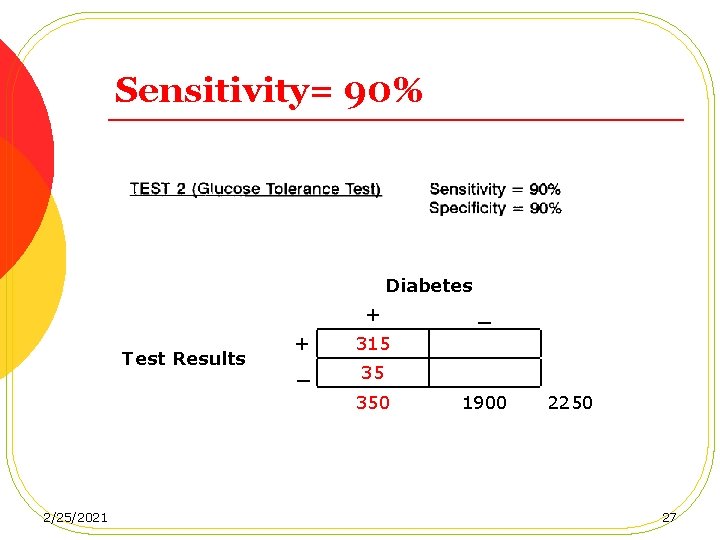
Sensitivity= 90% Diabetes + Test Results + 315 _ 35 350 2/25/2021 _ 1900 2250 27
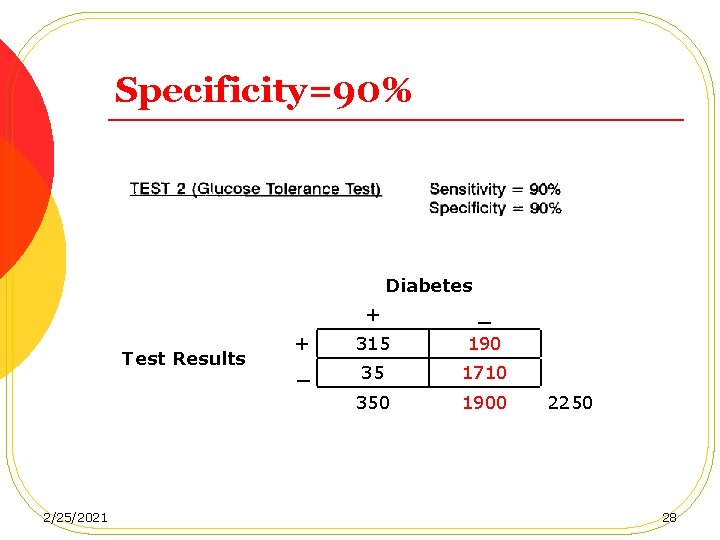
Specificity=90% Diabetes Test Results 2/25/2021 + _ + 315 190 _ 35 1710 350 1900 2250 28
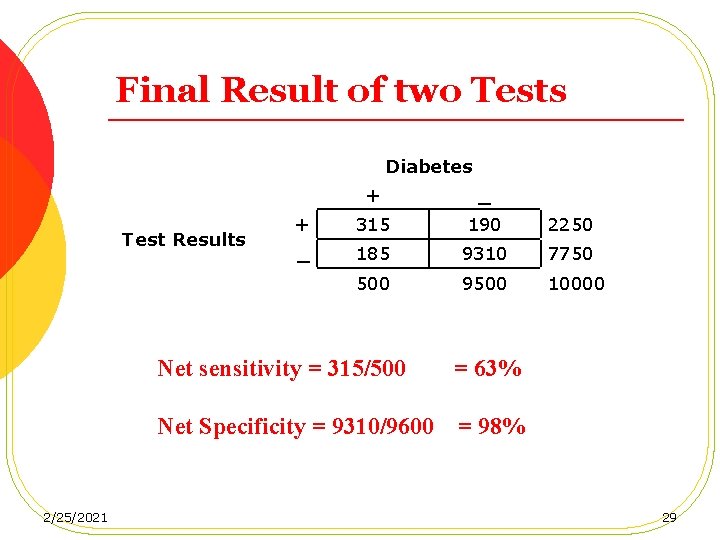
Final Result of two Tests Diabetes Test Results 2/25/2021 + _ + 315 190 2250 _ 185 9310 7750 500 9500 10000 Net sensitivity = 315/500 = 63% Net Specificity = 9310/9600 = 98% 29
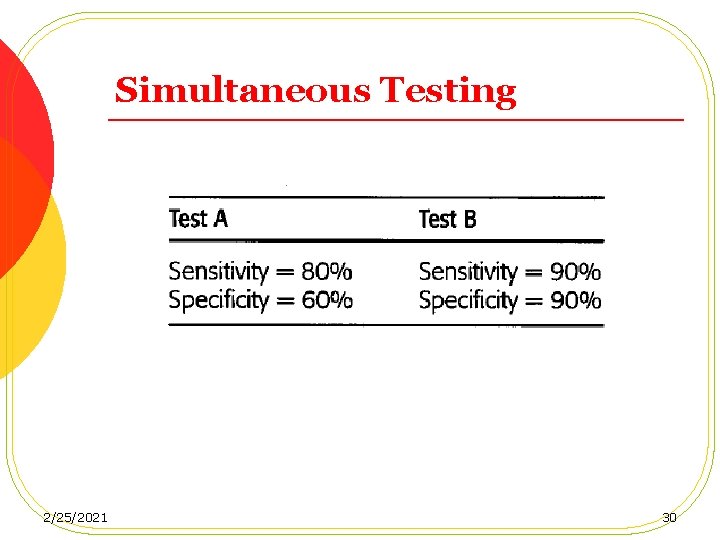
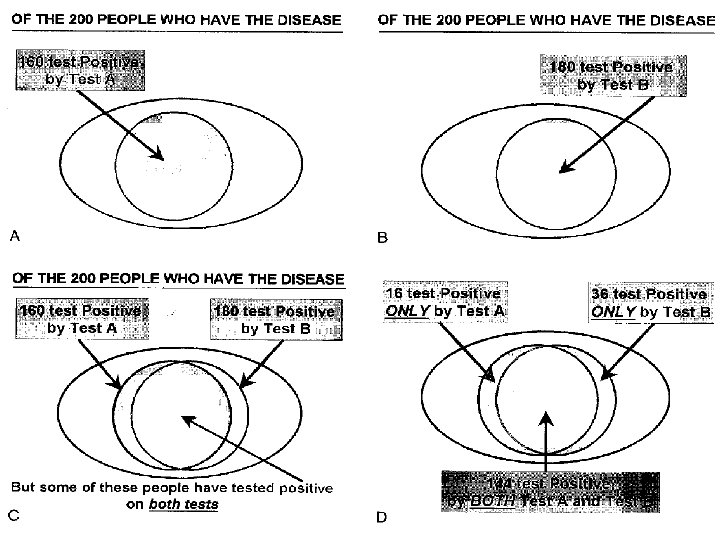
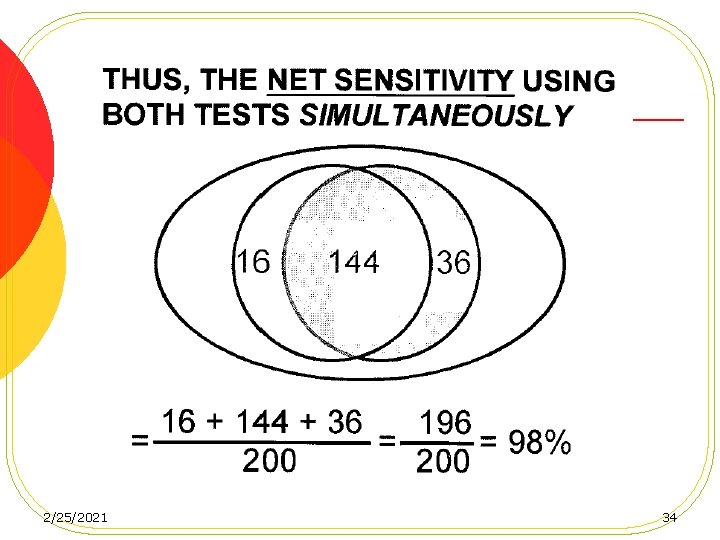
Simultaneous Testing 2/25/2021 30
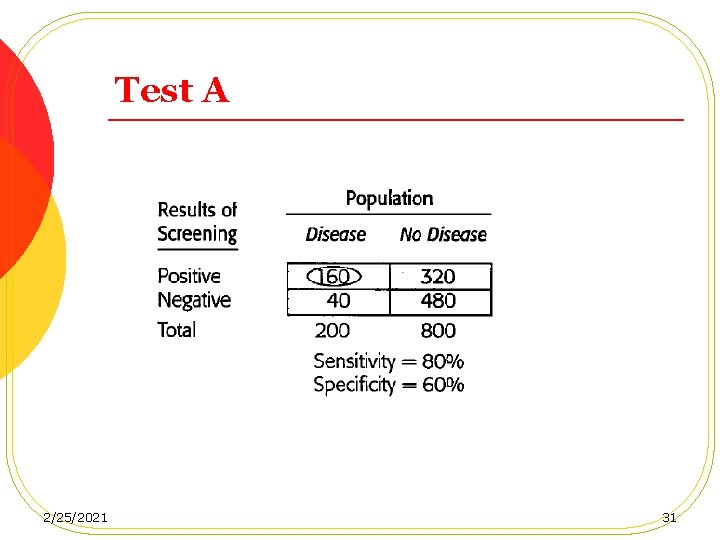
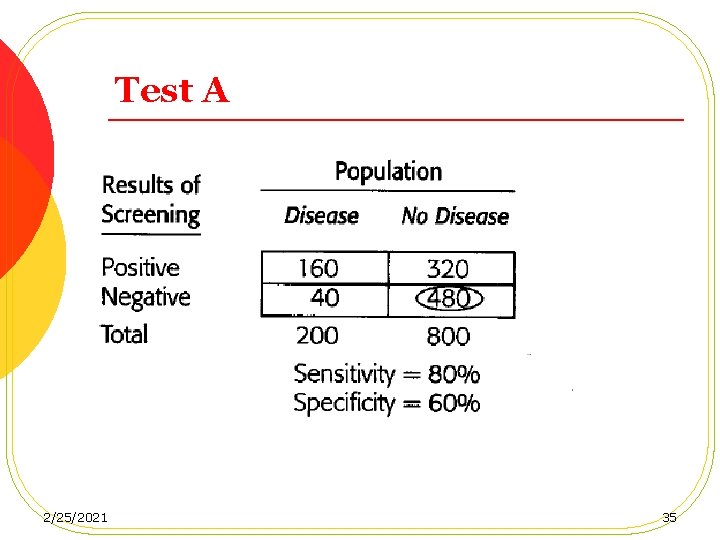
Test A 2/25/2021 31
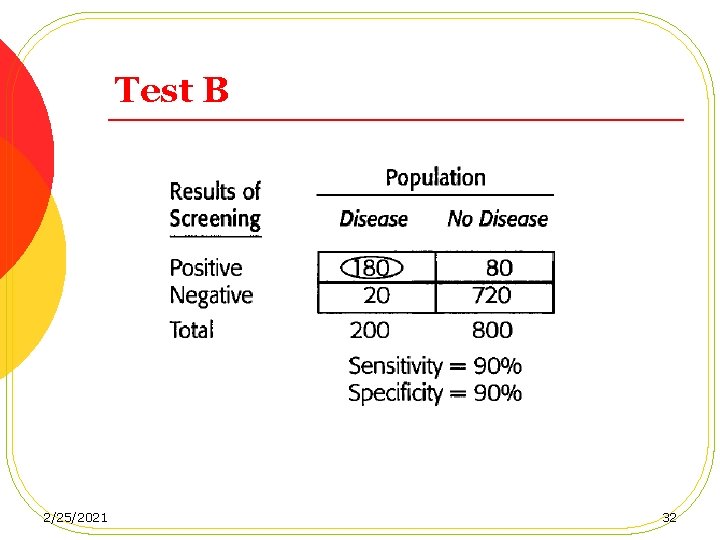
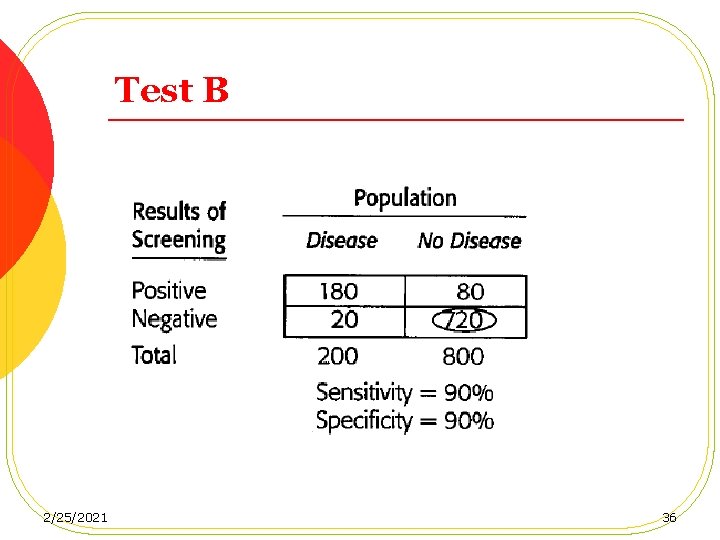
Test B 2/25/2021 32
2/25/2021 33
2/25/2021 34
Test A 2/25/2021 35
Test B 2/25/2021 36
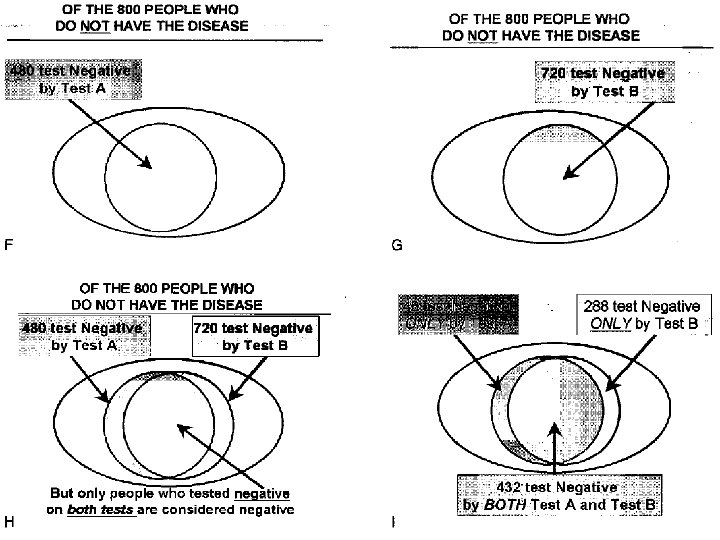
2/25/2021 37
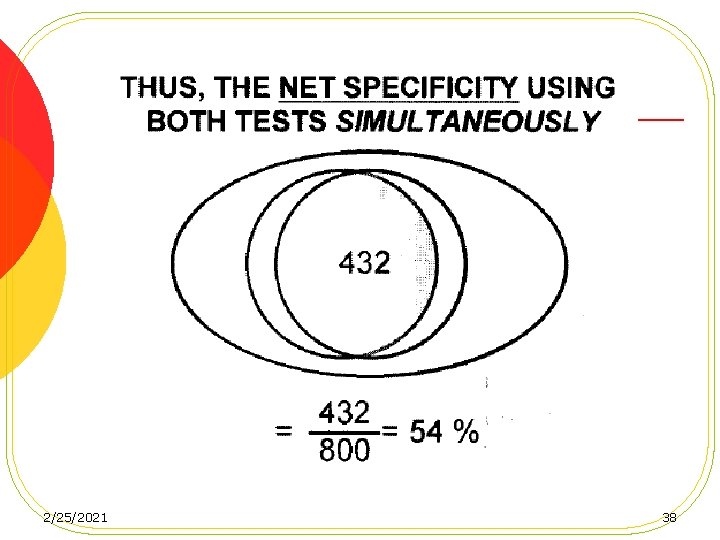
2/25/2021 38
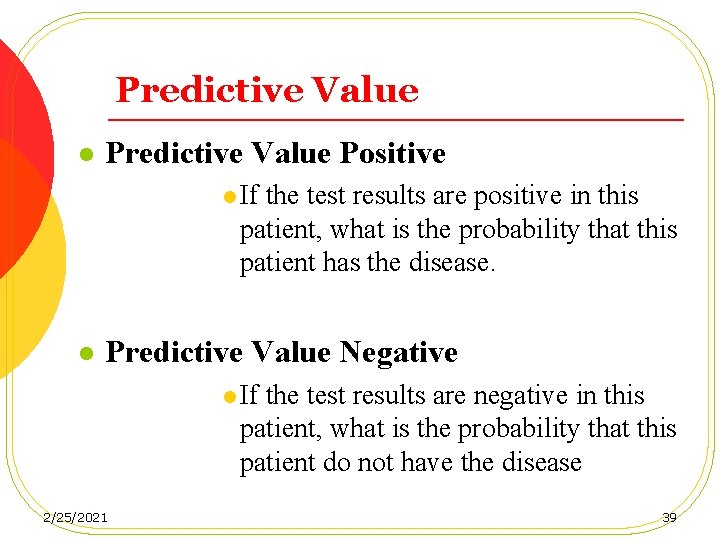
Predictive Value l Predictive Value Positive l If the test results are positive in this patient, what is the probability that this patient has the disease. l Predictive Value Negative l If the test results are negative in this patient, what is the probability that this patient do not have the disease 2/25/2021 39
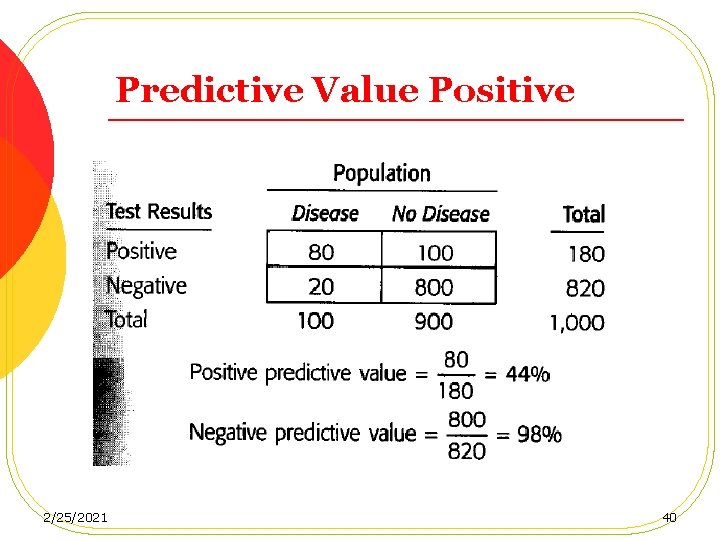
Predictive Value Positive 2/25/2021 40
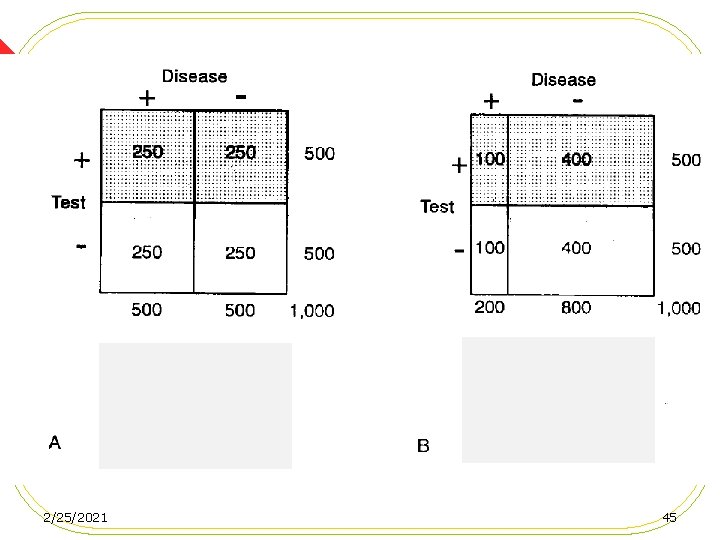
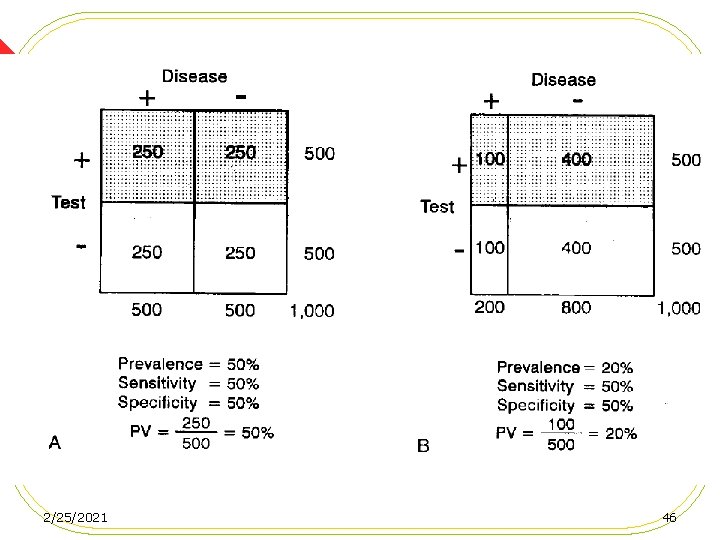
l The predictive value is affected by two factors: o the prevalence of the disease in the population tested o the specificity of the test being used, when the disease is infrequent. 2/25/2021 41
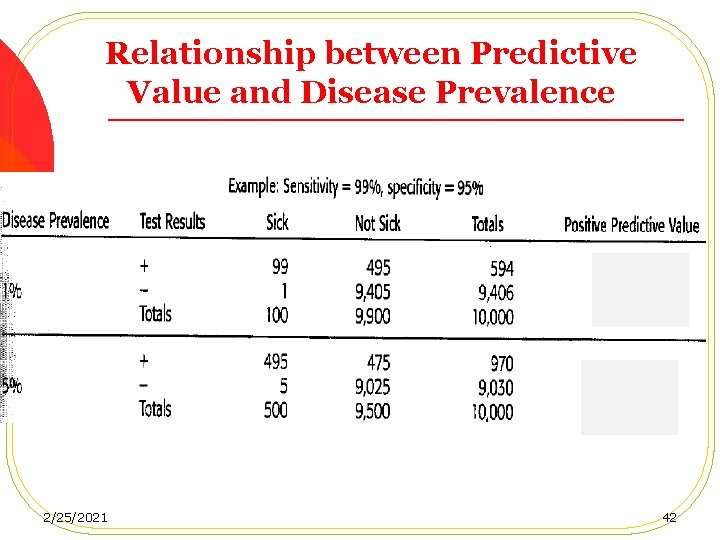
Relationship between Predictive Value and Disease Prevalence 2/25/2021 42
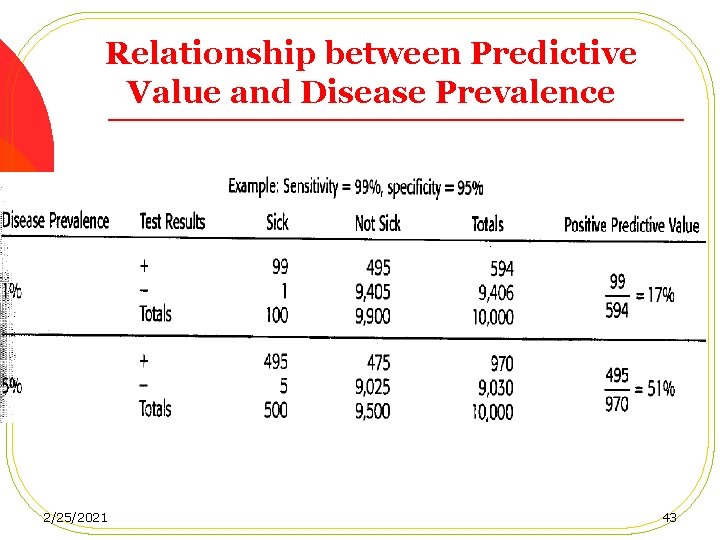
Relationship between Predictive Value and Disease Prevalence 2/25/2021 43
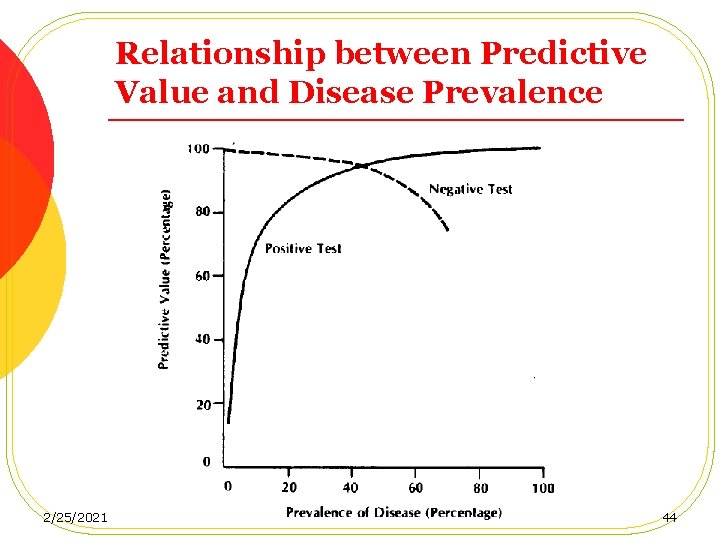
Relationship between Predictive Value and Disease Prevalence 2/25/2021 44
2/25/2021 45
2/25/2021 46
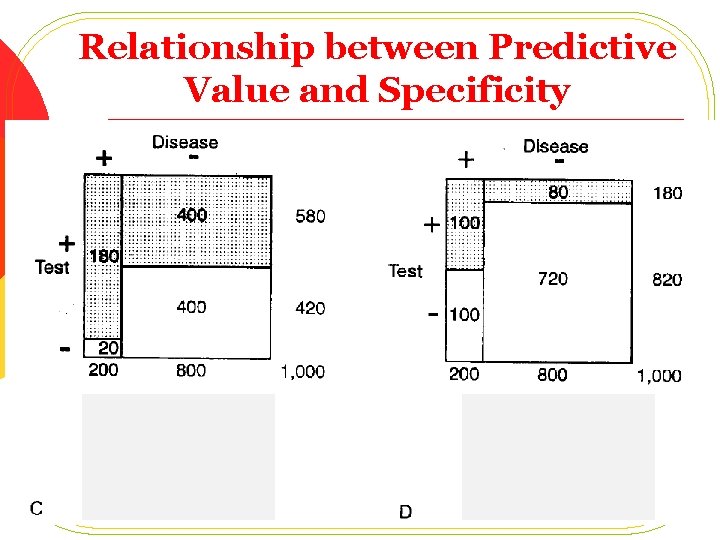
Relationship between Predictive Value and Specificity 2/25/2021 47
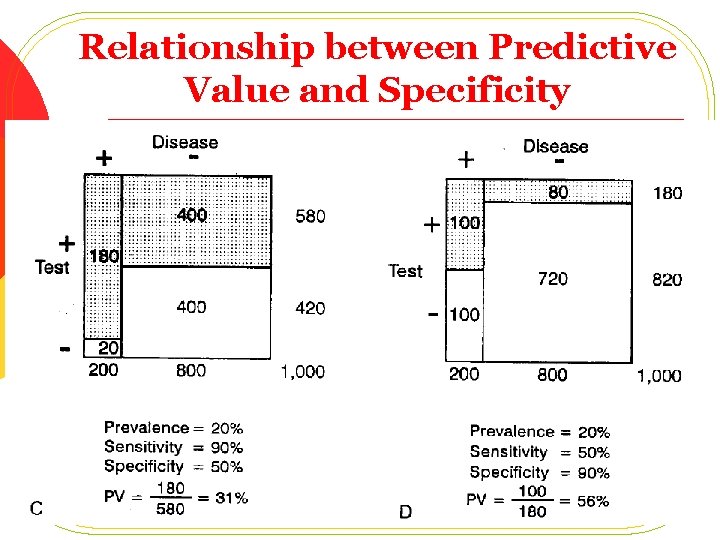
Relationship between Predictive Value and Specificity 2/25/2021 48
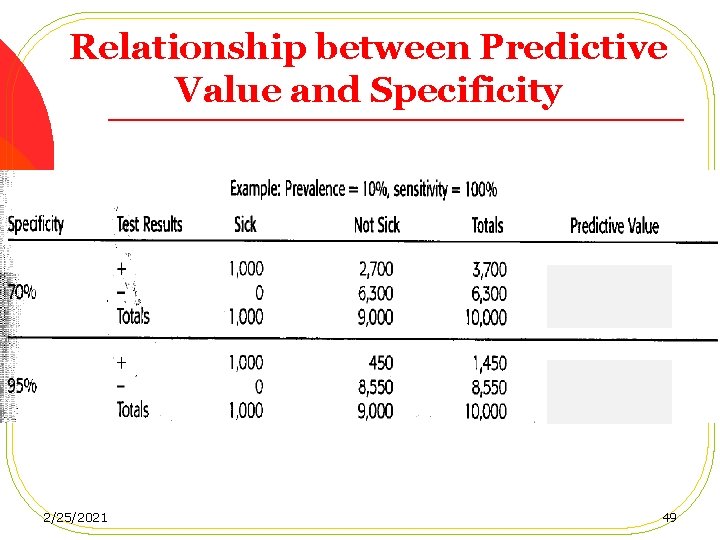
Relationship between Predictive Value and Specificity 2/25/2021 49
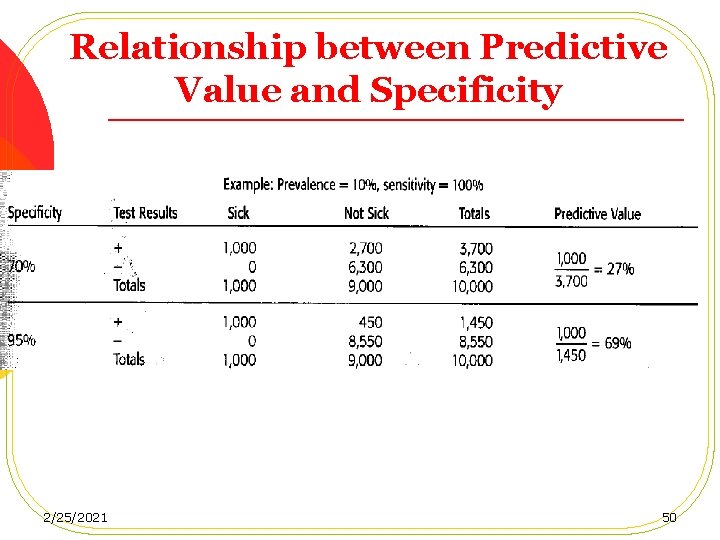
Relationship between Predictive Value and Specificity 2/25/2021 50
- Slides: 50