Diagnosing Troubleshooting and Improving Ignition Gateway Performance Dave


Diagnosing, Troubleshooting, and Improving Ignition Gateway Performance Dave Fogle Director of Support/ Inductive Automation James Hunt Support Manager / Inductive Automation
Overview • Most Common Problem Areas • • High Tag counts Database Connections & Throughput Project Size, Project Count, Client Connections Infrastructure Issues • Java Process & JVM Tuning • • Native and Heap Memory Garbage Collection
Tags & Performance • As tag numbers increase so will memory usage • Certain aspects of every tag are stored in active memory (heap) • UDTs vs non-UDT Tags • • Increased memory usage vs faster load times With large systems fast load times are important • Startup Times • Large tag counts will lead to slower startup times, however UDTs will help lessen the startup time
Tags & Performance • Scan Classes • • • Large quantities of tags in scan class not inherently bad, but… Types of tags grouped in a scan class Being aware of exactly how many tags you have grouped together • Mostly applicable to UDTs – What’s actually in them?
Tags & Performance • Why Tag Types are important • • • SQL Query Tags Expression Tags Total execution tags
Databases & Performance • When to look at your database • • Sluggish charts that used to be fast Query timeout errors in the client Active connections are nearly always maxed Throughput no longer sufficient and store & forward backing up
Databases & Performance • 3 things to consider when database is “slow” 1. Maximum number of active connections • Increase in active clients over the years • Project evolution led to more data reporting • Default is 8. Increase the pool to handle your increased demand
Databases & Performance • 3 things to consider when database is “slow” 2. Is your database remote? • Limited by network bandwidth and latency • If actually maxed on throughput – Remote History Provider
Databases & Performance • 3 things to consider when database is “slow” 3. Database needs to be optimized • Memory • Table structure – Indexes, etc • More data == longer query times • Keeping scalability in mind from the beginning

Projects & Clients • Natural growth of projects and scope over time • Three areas of growth happen simultaneously • Size of Projects (# of windows, number of users, etc. ) • Number of projects on the gateway • Number of active clients across all projects • Not about knowing a magic number • Growth over the above areas has a cumulative affect on performance • Impossible to say “ 100 clients needs X specific hardware” • CAN say “ 100+ clients means I should evaluate load on my gateway, think more powerful hardware”
Projects & Clients • Too many clients? • • Slow client response Slow updates to subscribed tags Slow responses to gateway requests Synchronous actions to the gateway block for a long time
Projects & Clients • Too many queries? • • • Excessive memory usage by gateway, or memory exhaustion Query results take a long time to return to client Query timeout errors, dropped connections to gateway
Projects & Clients • Plan for the future from the beginning • • Be aware of client update rates Keep in mind tag subscription numbers Avoid polling queries Communication w/ gateway should be on demand • Tips: Finding scaling problems late usually results in a partial if not complete redesign of projects / architecture

Infrastructure, Architecture, & IT • Know your VMs, VM hardware, and have access to both • • VMs add a layer of complexity to troubleshooting Under-provisioning Overloaded VM host machine VM snapshot/backup schedule
Infrastructure, Architecture, & IT • IT schedule • • • Java updates Database backups / maintenance Any change to any system that Ignition connects to can cause an unforeseen problem
Infrastructure, Architecture, & IT • Variation of load across infrastructure • • Large file transfers Offsite backups Higher than normal DB activity Poor scheduling of network traffic can impact performance
Infrastructure, Architecture, & IT • What causes slow performance? • • Stuff. Lots of stuff. Solutions come from coordinated troubleshooting efforts

Part 2: Java Process & JVM Tuning

Ignition and the Java Process Understanding your Java Process is just as important as your server’s hardware: • Insure Stability • Optimize to your performance needs of your project • Analyze your performance to better scale your projects going forward
Intro to the Java Process The Java process has 3 defined areas of memory: 1. Java Heap Space • This is the most well known of the 3 defined areas of memory and is the home of the Ignition service and where Garbage Collection reigns supreme. 2. Native Memory • This is memory allocated to the Java process that exists outside of the Heap. Such as the garbage collector and references to the host OS resources. 3. Direct Memory • While similar to native memory it serves a different function. In being where buffers for shared Hardware resources needed by the JVM reside such as Network adapters and graphics card.
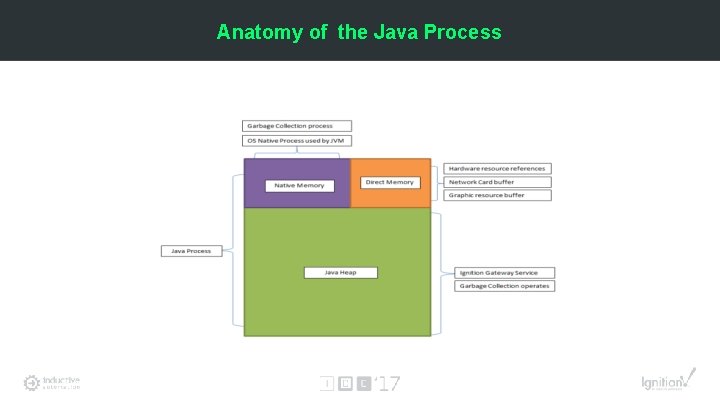
Anatomy of the Java Process
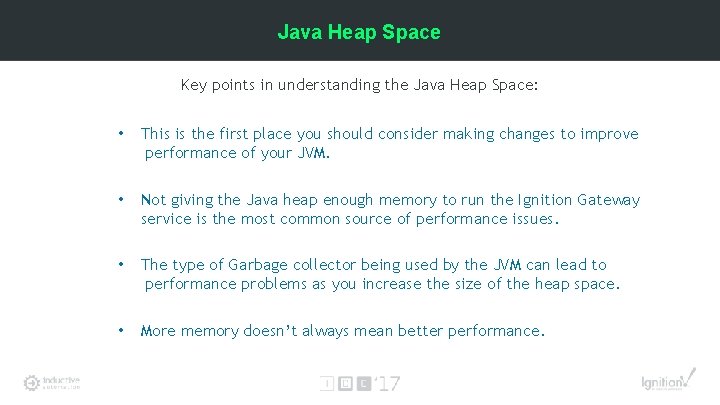
Java Heap Space Key points in understanding the Java Heap Space: • This is the first place you should consider making changes to improve performance of your JVM. • Not giving the Java heap enough memory to run the Ignition Gateway service is the most common source of performance issues. • The type of Garbage collector being used by the JVM can lead to performance problems as you increase the size of the heap space. • More memory doesn’t always mean better performance.

Java Heap Space Cont. Configuration changes made to the JVM are done in the Ignition. conf file located: Windows : C: Program FilesInductive AutomationIgnitiondata Linux: /var/lib/ignition/data OS x: /usr/local/ignition/data/
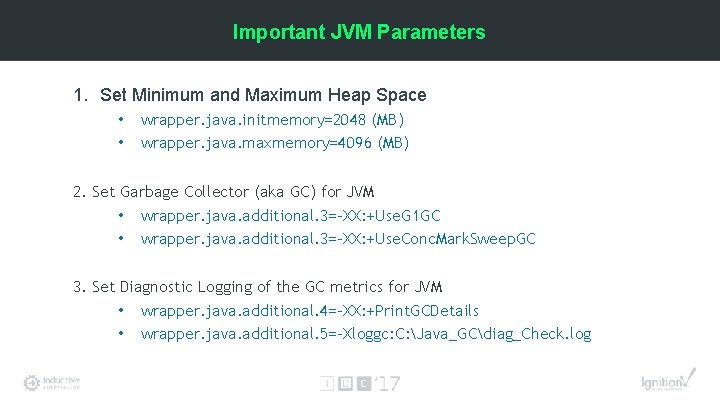
Important JVM Parameters 1. Set Minimum and Maximum Heap Space • • wrapper. java. initmemory=2048 (MB) wrapper. java. maxmemory=4096 (MB) 2. Set Garbage Collector (aka GC) for JVM • wrapper. java. additional. 3=-XX: +Use. G 1 GC • wrapper. java. additional. 3=-XX: +Use. Conc. Mark. Sweep. GC 3. Set Diagnostic Logging of the GC metrics for JVM • wrapper. java. additional. 4=-XX: +Print. GCDetails • wrapper. java. additional. 5=-Xloggc: C: Java_GCdiag_Check. log
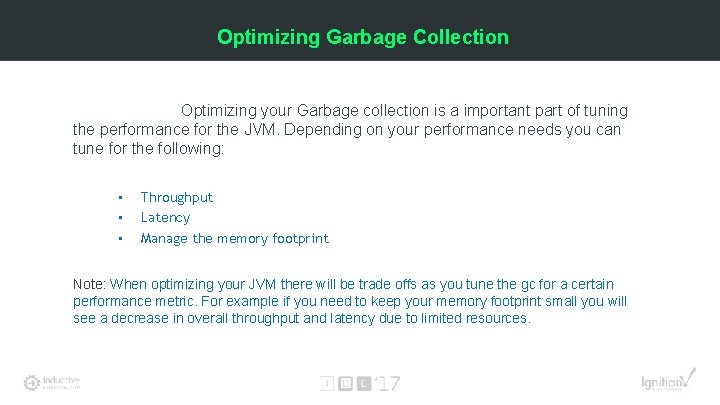
Optimizing Garbage Collection Optimizing your Garbage collection is a important part of tuning the performance for the JVM. Depending on your performance needs you can tune for the following: • • • Throughput Latency Manage the memory footprint Note: When optimizing your JVM there will be trade offs as you tune the gc for a certain performance metric. For example if you need to keep your memory footprint small you will see a decrease in overall throughput and latency due to limited resources.
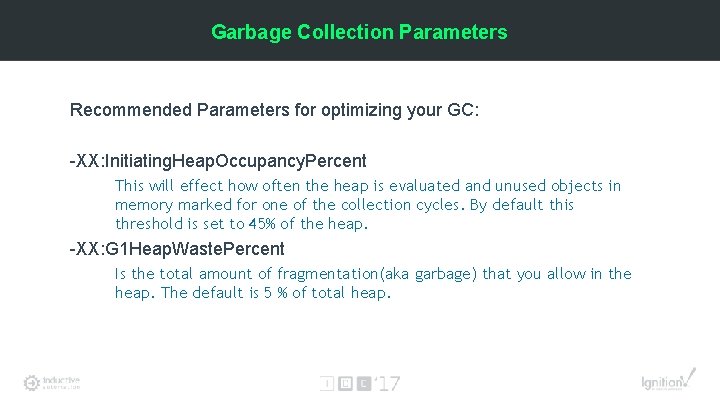
Garbage Collection Parameters Recommended Parameters for optimizing your GC: -XX: Initiating. Heap. Occupancy. Percent This will effect how often the heap is evaluated and unused objects in memory marked for one of the collection cycles. By default this threshold is set to 45% of the heap. -XX: G 1 Heap. Waste. Percent Is the total amount of fragmentation(aka garbage) that you allow in the heap. The default is 5 % of total heap.
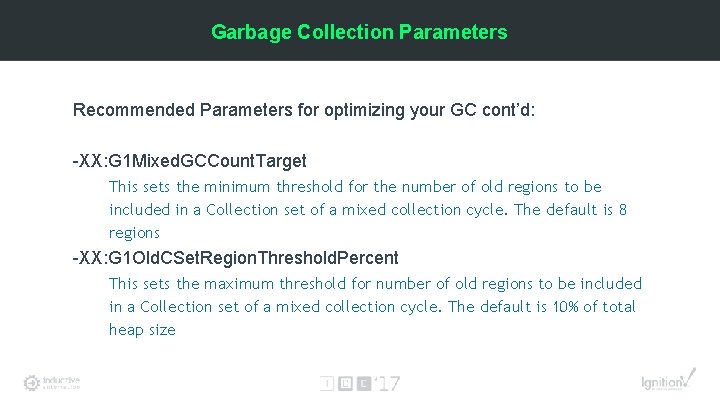
Garbage Collection Parameters Recommended Parameters for optimizing your GC cont’d: -XX: G 1 Mixed. GCCount. Target This sets the minimum threshold for the number of old regions to be included in a Collection set of a mixed collection cycle. The default is 8 regions -XX: G 1 Old. CSet. Region. Threshold. Percent This sets the maximum threshold for number of old regions to be included in a Collection set of a mixed collection cycle. The default is 10% of total heap size
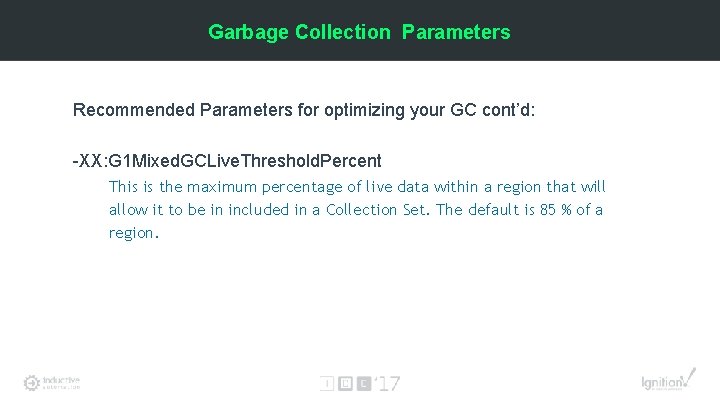
Garbage Collection Parameters Recommended Parameters for optimizing your GC cont’d: -XX: G 1 Mixed. GCLive. Threshold. Percent This is the maximum percentage of live data within a region that will allow it to be in included in a Collection Set. The default is 85 % of a region.
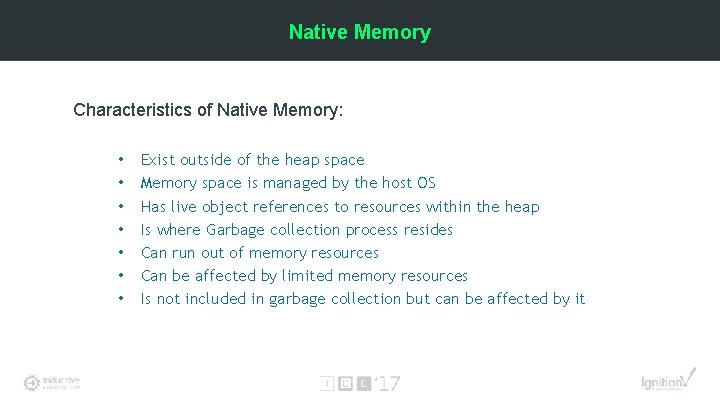
Native Memory Characteristics of Native Memory: • • Exist outside of the heap space Memory space is managed by the host OS Has live object references to resources within the heap Is where Garbage collection process resides Can run out of memory resources Can be affected by limited memory resources Is not included in garbage collection but can be affected by it
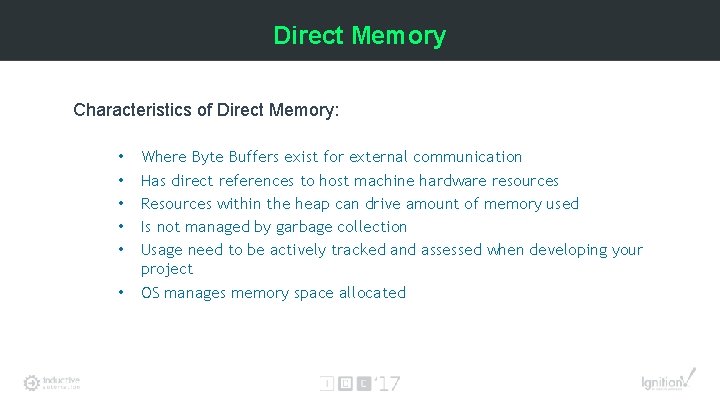
Direct Memory Characteristics of Direct Memory: • • • Where Byte Buffers exist for external communication Has direct references to host machine hardware resources Resources within the heap can drive amount of memory used Is not managed by garbage collection Usage need to be actively tracked and assessed when developing your project OS manages memory space allocated
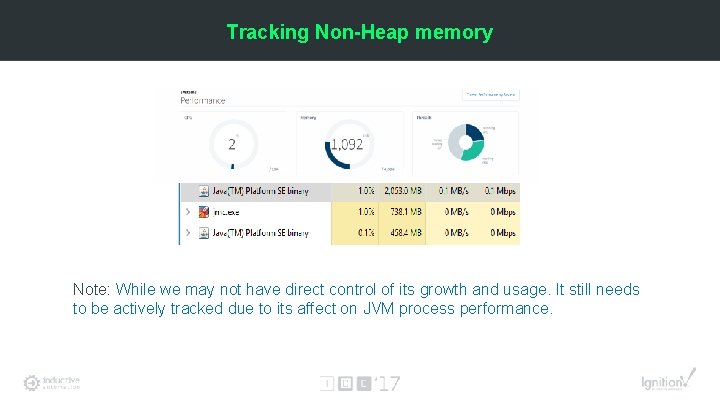
Tracking Non-Heap memory Note: While we may not have direct control of its growth and usage. It still needs to be actively tracked due to its affect on JVM process performance.

Questions?

Thank You

- Slides: 35