Diagnosing ENSO and MJO signal in the new

 •")


 1. Atmospheric component l l l Global Forecast System")


 Composite")
 l AMIP simulation")


 l Surface momentum flux (Tau) l Sea surface")

- Slides: 32
Diagnosing ENSO and MJO signal in the new NCEP coupled model Wanqiu Wang, Suranjana Saha, Hua-Lu Pan Sudhir Nadiga, and Glenn White Acknowledgements: Dave Behringer, Scott Harper, Qin Zhang, Shrinivas Moorthi and all of the EMC Climate and Weather Modeling Branch.
Background Current NCEP operational coupled model (M. Ji, A. Kumar, A. Leetmaa, 1994) • • Old version of NCEP MRF model Old version of GFDL MOM Coupling over tropical Pacific Flux correction at air-sea interface New NCEP Coupled Forecast System Model (CFS 03) • NCEP Global Forecast System 2003 • Global GFDL MOM 3 • No flux adjustment
Objective • Assess ENSO and MJO simulation by the new NCEP coupled model
Outline • The model • The simulation • Diagnoses • Conclusions
The coupled model (CFS 03) 1. Atmospheric component l l l Global Forecast System 2003 (GFS 03) T 62 in horizontal; 64 layers in vertical Recent upgrades in model physics – – 2. Oceanic component l l 3. Solar radiation (Hou, 1996) cumulus convection (Hong and Pan, 1998) gravity wave drag (Kim and Arakawa, 1995) cloud water/ice (Zhao and Carr, 1997) GFDL MOM 3 (Pacanowski and Griffies, 1998) 1/3°´ 1° in tropics; 1°´ 1° in extratropics; 40 layers Quasi-global domain (74°S to 64°N) Free surface Coupled model Once-a-day coupling l Sea ice extent taken as observed climatology l
Simulation Free integration of 32+ years l Initial date: 1 January 2002 l Initial conditions l – Atmosphere: NCEP GDAS – Ocean: NCEP GODAS Observations Extended reconstructed SST (Smith and Reynolds, 2003) l R 2: NCEP/DOE reanalysis 2 (Kanamitsu et al. , 2002) l GODAS: NCEP global ocean data assimilation (Behringer, personal communication) l ERSST:
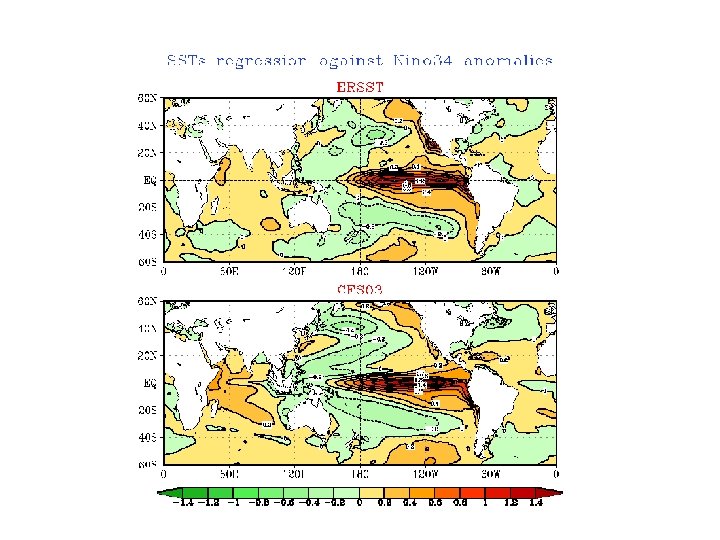
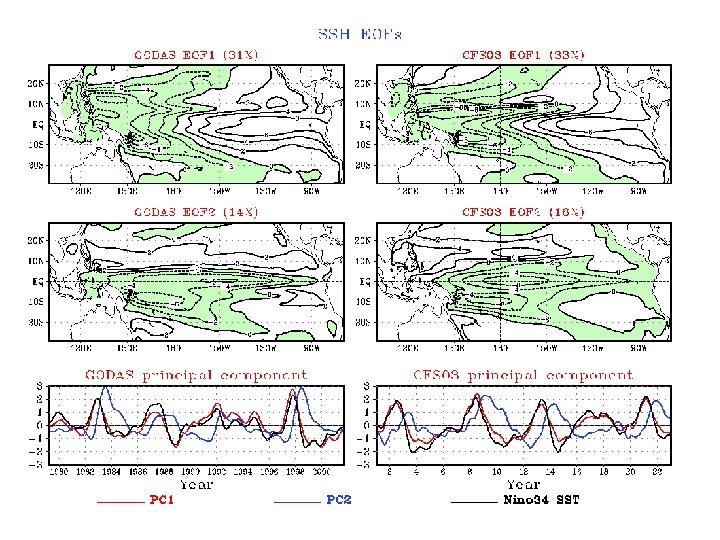
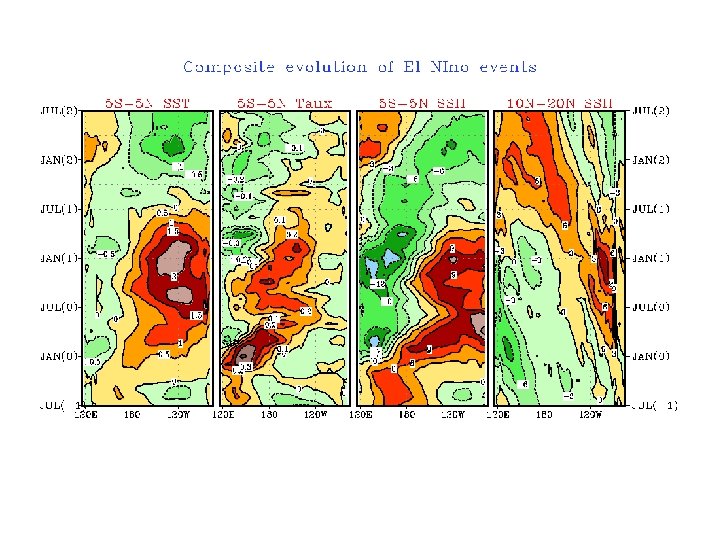
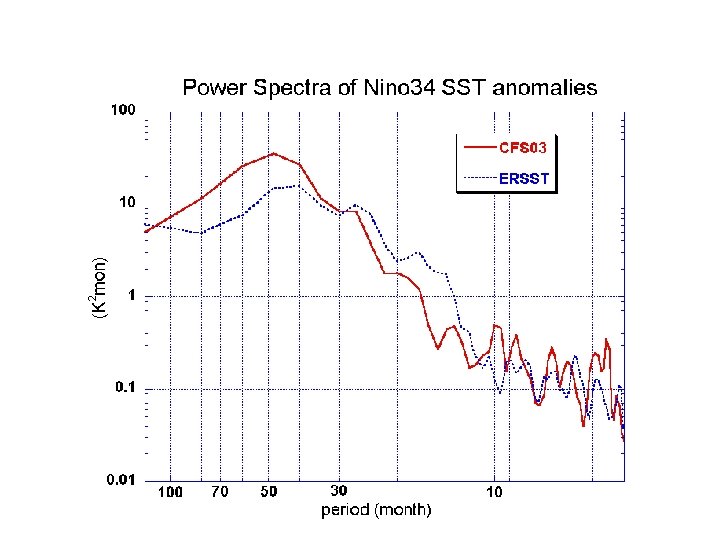
Diagnoses ENSO variability Nino 3. 4 SST l EOF modes of SSH l Composites of Tau, SST, SSH for El Nino events l
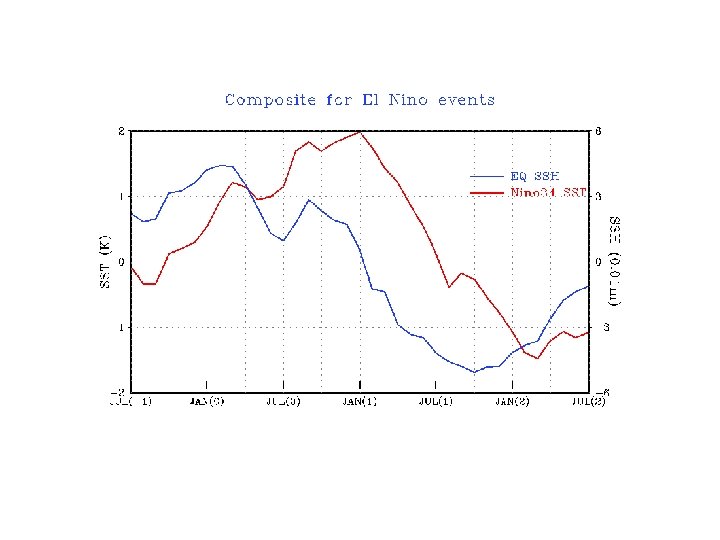
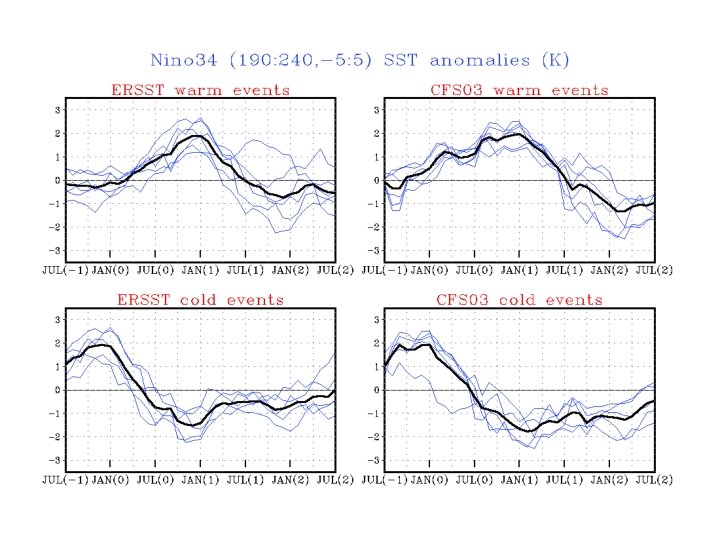
Nino 3. 4 SST anomalies (K) Composite
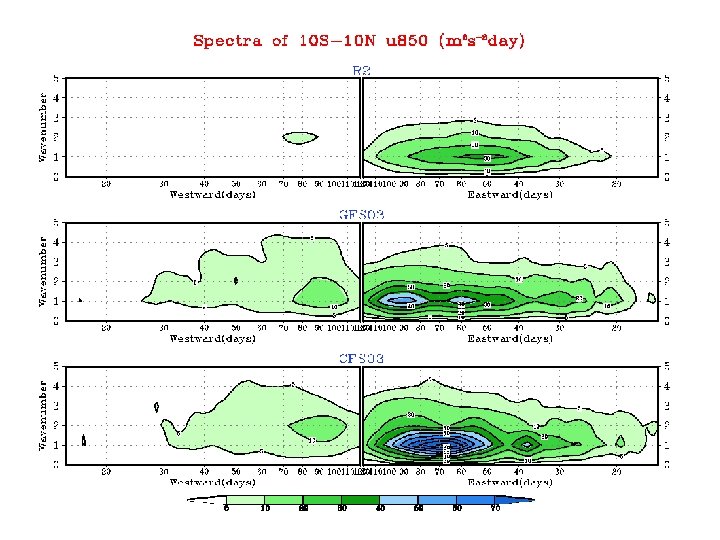
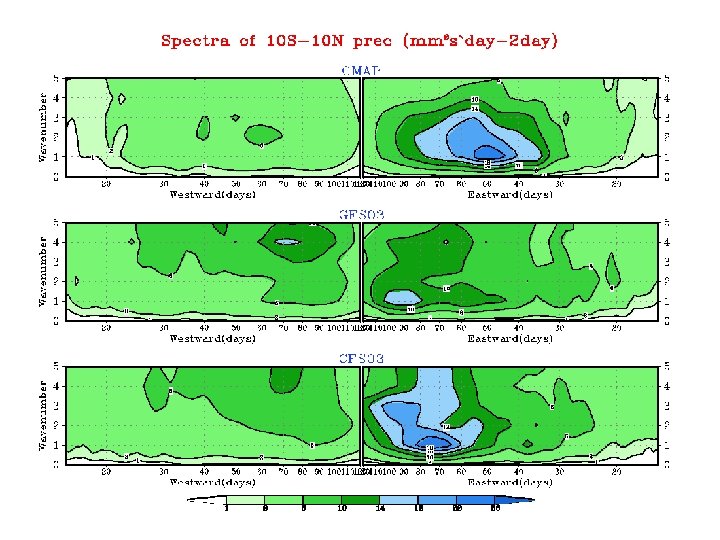
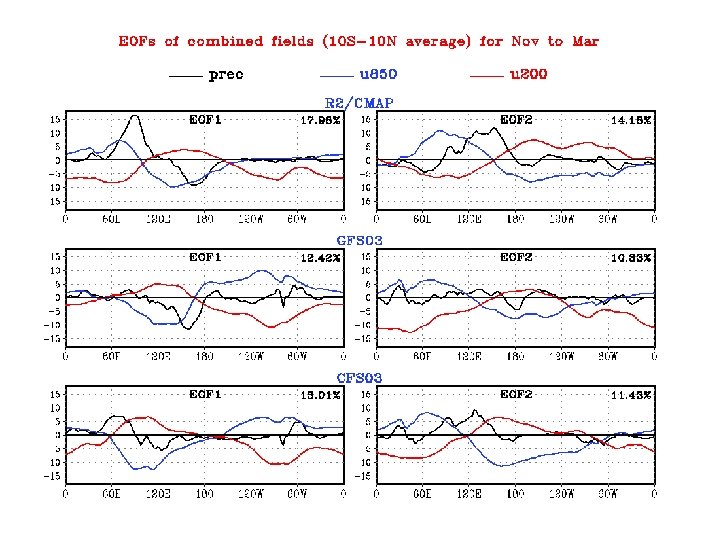
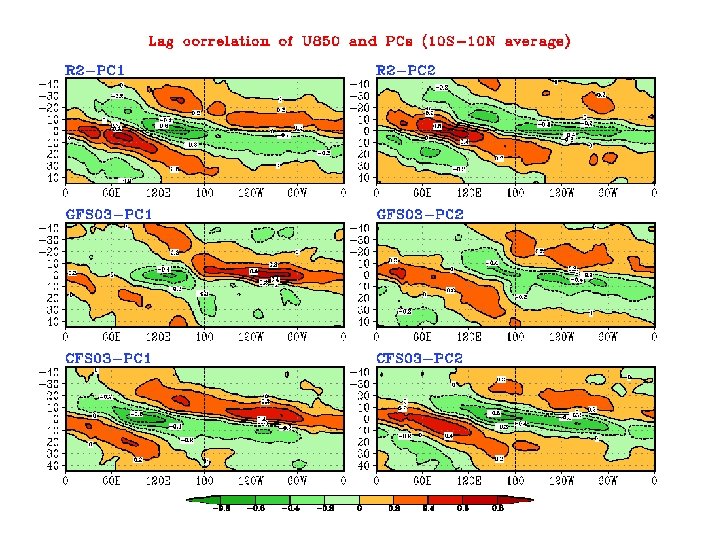
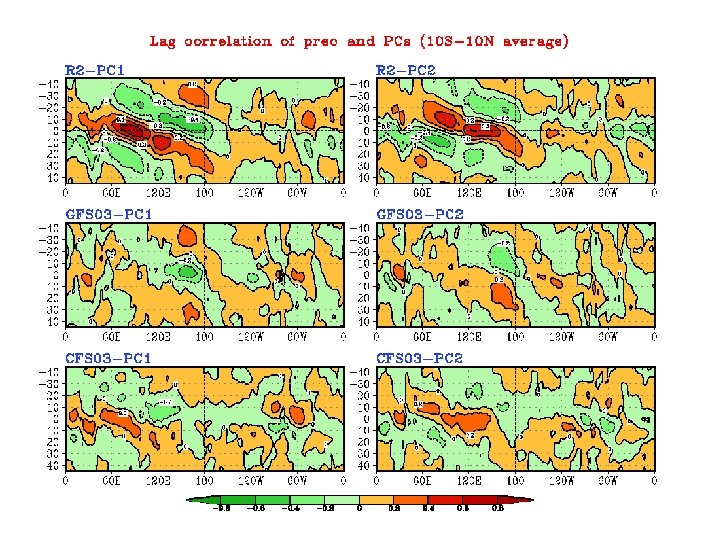
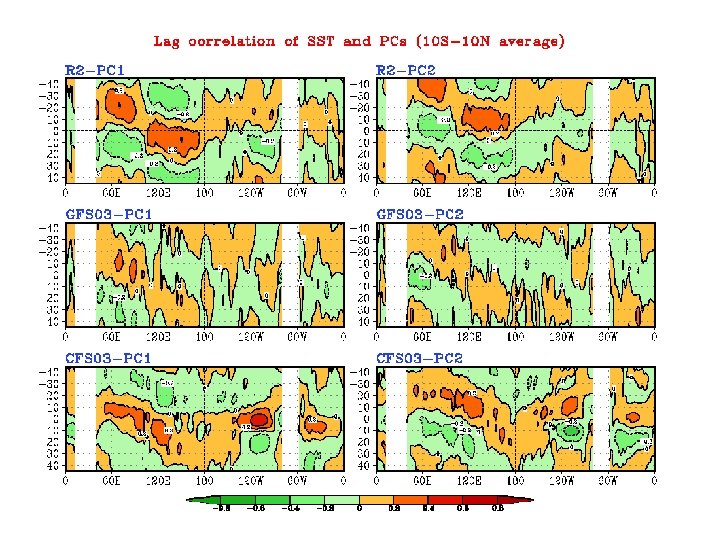
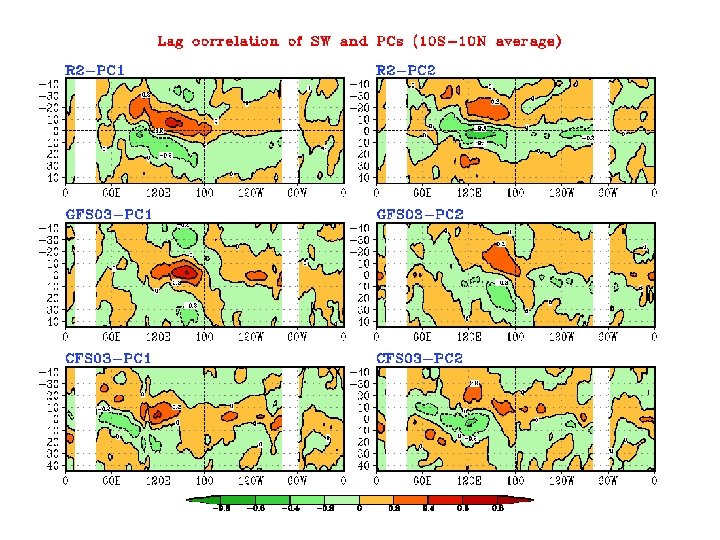
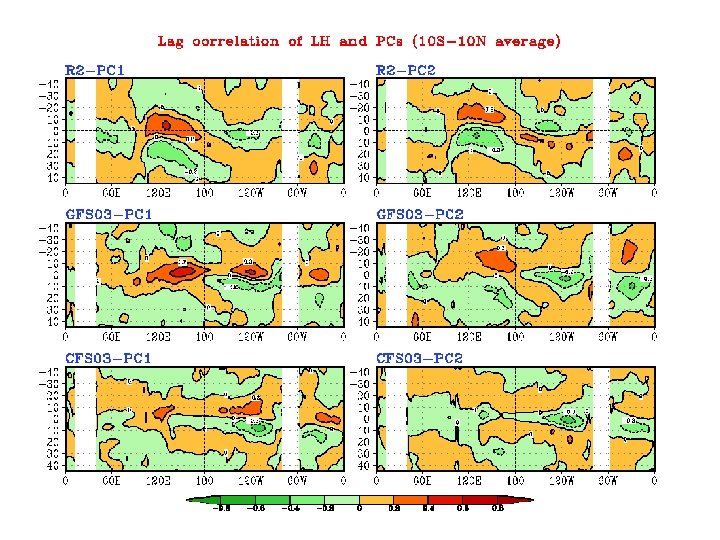
MJO variability The runs Coupled simulation by CFS 03 (21 years) l AMIP simulation by GFS 03 for 1982 -2002 l Diagnoses Wavenumber-frequency spectra l EOF modes of Precipitation, U 850, and U 200 l
Conclusions ENSO Simulation CFS 03 simulates an ENSO with amplitude and periodicity comparable to that observed. But the simulated ENSO appears to be too regular. l CFS 03 reproduces the observed seasonality of ENSO variability, although the initial warming from January to May of the simulated El Nino events is somewhat too strong. l Diagnoses of the simulated ENSO suggest that different mechanisms (delayed oscillator, western Pacific oscillator, recharge oscillator, and advectivereflective oscillator) may all contribute to the ENSO variability. l
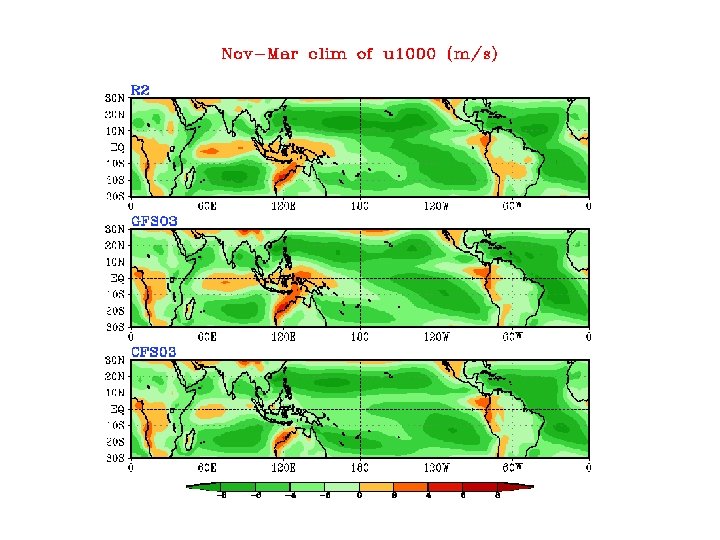
Conclusions MJO Simulation l Compared with GFS 03, CFS 03 simulates a more realistic MJO – frequency range more narrow and closer to the observed – convection and circulation more coherent – propagation better organized The MJO in CFS 03 is too strong and a little too slow. l Precipitation, solar radiation, and SST in CFS 03 are not as well organized as in the analyses l Latent heat flux associated with the MJO in CFS 03 is not consistent with that in the reanalysis, possibly due to that the mean surface westerly in the Indian ocean and western Pacific is too weak l
PC 2 leads PC 1 leads PC 2
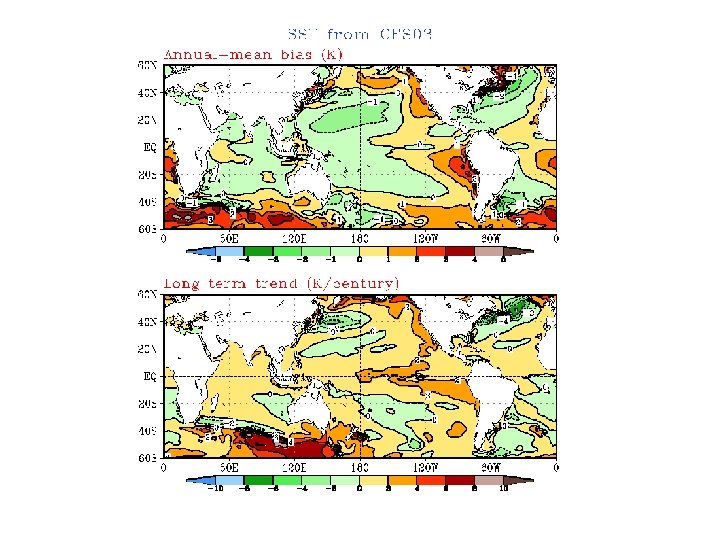
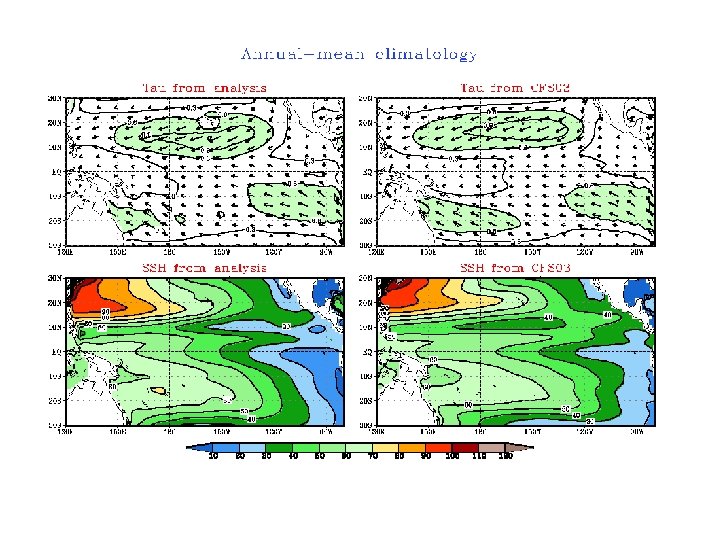
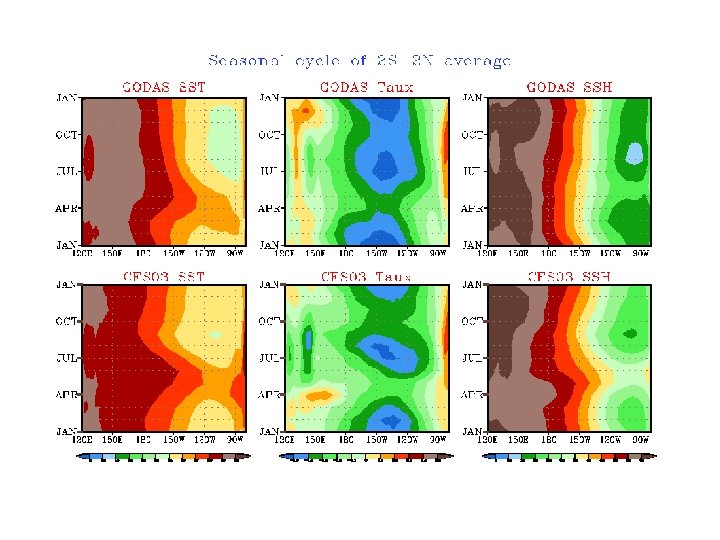
Diagnoses Climatology Sea surface temperature (SST) l Surface momentum flux (Tau) l Sea surface height (SSH) l
SSH and Nino 3. 4 SST in phase SSH lags Nino 3. 4 SST by one quarter of the period Consistent with Hasegawa and Hanawa (2003)