Diabetes and Obesity and Aging 20 of men

Diabetes and Obesity and Aging ~20% of men and women over 65 years have type 2 diabetes (ADA criteria). ~24% in this age group have diabetes according to WHO criteria (IPH). • • Prevalence of obesity is much lower in older (>65 y) men and women compared to men and women in their 50’s (14% vs. 24%).

Metabolically Obese Normal Weight Individuals “Individuals who are not obese based on height and weight, but who, like those with overt obesity, are hyperinsulinemic, insulin resistant, predisposed to type 2 diabetes, hypertriglyceridemia, and premature coronary heart disease. ” Ruderman

Standardized beta coefficient 0. 5 0. 4 0. 3 A BMI 15. 0 - 24. 9 BMI 25. 0 - 29. 9 BMI >29. 9 * * * 0. 2 * 0. 1 0 -0. 1 -0. 2 IMF SCTF MA VAF SCAF Standardized beta coefficient 0. 5 0. 4 B 0. 3 0. 2 BMI 15. 0 - 24. 9 BMI 25. 0 - 29. 9 BMI >29. 9 * * * 0. 1 0 -0. 1 -0. 2 IMF SCTF MA VAF SCAF
, impaired glucose tolerance")
Distribution of adipose tissue in subjects with normal glucose tolerance (GT), impaired glucose tolerance (IGT) and in elderly patients with type 2 diabetes mellitus (DM). GT IGT* DM** Overall p-value Men (n=866) Visceral 145 ± 66 163 ± 72 174 ± 80 0. 0001 221 ± 86 244 ± 95 245 ± 42 0. 0001 Subcutaneous Women (n=300) (n=325) (n=904) (n=428) (n=252) Visceral 116 ± 54 Subcutaneous 322 ± 122 342 ± 132 381 ± 127 Abdominal Adipose Tissue (cm 2) 144 ± 61 163 ± 67 0. 0001
, impaired glucose tolerance")
Mid-thigh muscle attenuation in elderly subjects with normal glucose tolerance (GT), impaired glucose tolerance (IGT) and in patients with type 2 diabetes mellitus (DM). Men Muscle Attenuation (HU) Muscle Area (cm 2) GT IGT* DM** (n=866) (n=300) (n=325) 36. 7 ± 6. 6 36. 2 ± 6. 9 † 37. 9 ± 6. 3 Overall p-value 131. 2 ± 21. 4 132. 8 ± 23. 3 136. 7 ± 23. 6 † 0. 0002 0. 0024 Mid-Thigh Adipose Tissue (cm 2) Subcutaneous 46. 7 ± 19. 7 50. 3 ± 21. 7 † Intermuscular 9. 1 ± 5. 8 10. 4 ± 5. 8 † Women (n=904) 46. 5 ± 20. 3 † 11. 9 ± 10. 6 † (n=428) Muscle Attenuation (HU) 34. 5 ± 6. 6 33. 3 ± 7. 2 † Muscle Area (cm 2) 90. 9 ± 17. 0 93. 7 ± 17. 2 † 0. 031 0. 0001 (n=252) 32. 5 ± 7. 2 † 0. 0002 101. 9 ± 17. 1† 0. 0001 Mid-Thigh Adipose Tissue (cm 2) Subcutaneous 105. 6 ± 46. 5 108. 9 ± 46. 9 109. 8 ± 48. 5 0. 372 Intermuscular 9. 6 ± 5. 4 12. 7 ± 6. 6 † 0. 0001 11. 0 ± 6. 3 †
 L/S Ratio = mean Hounsfield")
Liver and Spleen CT with Regions of Interest (ROI) L/S Ratio = mean Hounsfield Unit (HU) of Liver ROI mean HU of Spleen ROI Liver ROI 4 = 9. 8 HU 5 = 0. 5 HU 6 = -2. 4 HU Spleen ROI 1 = 53. 1 HU 2 = 52. 6 HU 3 = 52. 7 HU L/S Ratio = 0. 05 indicating severe fatty liver infiltration

Ectopic Fat: Liver in Type 2 DM NS p<0. 001 p=0. 001

Relation of Fatty Liver to VAT µEq/L

Relation of Fatty Liver to Fatty Acids

Stepped Care: Type 2 Diabetes Step 1: Nutrition therapy, exercise, lifestyle changes Training in self-management and self-monitoring of blood glucose Step 2: Add oral agents -monotherapy -combination therapy Step 3: Add or change to insulin C
 Effect of Glyburide in Type 2 Diabetes: Enhanced b-Cell Responsiveness Before")
Insulin secretion (pmol/min) Effect of Glyburide in Type 2 Diabetes: Enhanced b-Cell Responsiveness Before After Glucose (mmol/L) 20 15 10 5 0 0600 © 1999 PPS 1200 1800 2400 Clock time 0600 C 800 700 600 500 400 300 200 100 0 0600 1000 1400 1800 2200 0600 Clock time Shapiro ET et al. J Clin Endocrinol Metab. 1989; 69: 571 -576.

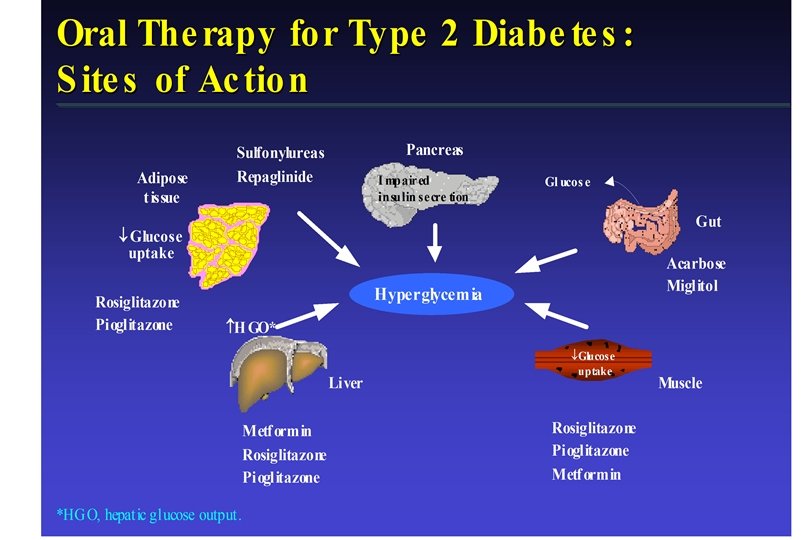
Meglitinides: Mechanism of Action C 1 Intestine: glucose absorption 2 Muscle and adipose tissue: glucose uptake Insulin resistance Blood glucose 4 Liver: hepatic glucose output Insulin resistance © 1998 PPS 3 Pancreas: insulin secretion Meglitinides Insulin secretion Wolffenbuttel BHR et al. Eur J Clin Pharmacol. 1993; 45: 113 -116.

a-Glucosidase Inhibitors: Mechanism of Action C 1 Intestine: glucose absorption a-glucosidase inhibitors glucose absorption secondary to digestion of carbohydrate 2 Muscle and adipose Insulin resistance tissue: glucose uptake Blood glucose 4 Liver: hepatic glucose output © 1997 PPS Insulin resistance 3 Pancreas: insulin secretion Amatruda JM. In: Diabetes Mellitus. 1996: 643 -646.

300 250 200 150 100 50 © 1999 0 PPS Before After 8 9 10 11 12 1 2 3 4 Time of day Plasma Insulin (m. U/m. L) Plasma glucose (mg/d. L) Treatment With Metformin in Type 2 Diabetes C 60 40 20 8 9 10 11 12 1 2 3 4 Time of day Wu MS et al. Diabetes Care. 1990; 13: 1 -8.

PPAR- g Binding and Gene Activation by the Thiazolidinediones Troglitazone Pioglitazone PPAR-g Rosiglitazone PPAR- g Pioglitazone Troglitazone Gene Activation Rosiglitazone Courtesy of Charles Burant , MD.

Treatment Effect on Fatty Liver l Both groups had “fatty liver” at baseline l No change during Metformin RX l Decrease in fatty liver with Rosiglitazone


Treatment Effect on VAT l No change in VAT during Metformin treatment l Reduction in VAT during Rosiglitazone Rx; (p=0. 06).

Treatment Effect on SAT l Reduction in SAT during Metformin Rx l Moderate increase in SAT during Rosiglitazone Rx l Similar patterns seem with FM, thigh Sub. Q AT

Treatment Effect on Muscle TG Content l Oil Red O staining and fiber type determination used to measure muscle lipid. l Significant decrease with Metformin, no change with Rosiglitazone

l Combination Therapy for Type 2 © 1998 PPS Diabetes C l Potentially useful Established combinations* † combinations – SU + metformin l Repaglinide + – SU + troglitazone or pioglitazone troglitazone, – Metformin + troglitazone, rosiglitazone, or pioglitazone – SU + insulin – Repaglinide + SU – Troglitazone or pioglitazone + insulin – Repaglinide + – Metformin + insulin metformin + – Acarbose or miglitol + any other troglitazone, glucose-lowering drug rosiglitazone, – Metformin + repaglinide or pioglitazone *Supported by literature or PI – SU + metformin + troglitazone †Investigational – Repaglinide + metformin

Insulin Therapy in Type 2 Diabetes l l Bedtime intermediate-acting insulin or suppertime premixed insulin with oral agent NPH plus regular or rapid-acting insulin bid or premixed insulin bid NPH plus regular or rapid-acting insulin at suppertime, NPH at hs Glargine insulin once daily © 1997 PPS

Therapeutic Options: Use of Insulin in Elderly Type 2 Diabetes Patients Advantages: l Effective in virtually all patients l Safe in renal/hepatic insufficiency l Useful in patients with major illness, eating difficulty l Encourages active self-care l No major drug interactions l No contraindications

Management Goals to Minimize Diabetes Complications Control Glucose Levels l Regular home blood glucose monitoring l Hb. A 1 c <7%* l Preprandial blood glucose: 80 -120 mg/d. L* l Bedtime blood glucose: 100 -140 mg/d. L* l Peak postprandial blood glucose <160 mg/d. L * ADA recommendations

Relationship of the Incidence of Myocardial Infarction and Microvascular Complications to Mean Hb. A 1 c Concentration Mean Hb. A 1 c (%) Adapted from Stratton IM, et al. BMJ 2000; 321 -405 -12.

Setting Hyperglycemia Treatment Goals for Elderly Patients with Diabetes Mellitus l Patient’s estimated remaining life expectancy l Patient’s preference and commitment l Availability of support services l Economic issues

Basic Care Management Goals l l Reduce cardiovascular risk factors: hypertension, dyslipidemia, cigarettes Prevent metabolic decompensation – Average circulating glucose level ~200 mg/d. L – FPG ~160 mg/d. L – Hb. A 1 c within 3 -4% of upper limit of normal

Conclusions Among elderly people: l There is a high rate of IGT and type 2 diabetes l IPH/early insulin response may be important l Special considerations may affect treatment goals and therapy: comorbidities, functional status, and polypharmacy l Various therapeutic regimens are available
- Slides: 30