Diab EATes and Carbs Jen Block FNP MSN

Diab. EATes and Carbs Jen Block, FNP, MSN, RN, CDE Stanford University Department of Pediatric Endocrinology Email: jblock@stanford. edu

Objective: Answer these questions • Why count carbs? • What are options for carb counting? • What tools are available to help with carb counting? • Why do different carbs impact glucose differently? • How can we better match insulin to carbs and improve post meal glucose control? • What is new in the research?

American Diabetes Association: Nutrition Recommendations for Children and Adolescents with T 1 D • • Achieving glycemic goals without excessive hypoglycemia Achieve lipid and blood pressure goals Normal growth and development Consultation with a registered dietitian experienced in both pediatric nutrition and diabetes is recommended. • Meal planning approach should help families learn the effects of foods on blood glucose levels. • Evaluate height/weight BMI and nutritional plan at least annually. • Calories should be adequate for growth and restricted if the child becomes overweight. Care of Children and Adolescents with Type 1 Diabetes; A statement of the American Diabetes Association. Diabetes Care, vol 28 (1) January 2005

Why Count ? • “Monitoring carbohydrate, whether by carbohydrate counting, choices, or experience-based estimation, remains a key strategy in achieving glycemic control. ” Standards of Medical Care in Diabetes: Diabetes Care vol 35, supplement 1, Jan 2012 p. s 23 • Carbohydrate counting was found to be effective in helping people achieve glycemic control in the DCCT (DCCT, 1993) (Evert, 2012) • Advantages to carbohydrate counting: Better match of insulin to carbs No “off limits” foods Flexibility in meal & snack quantities

What are options for counting • Food labels • Measuring foods • Weighing foods/ Carbohydrate factor • Portion estimation • New technology ?
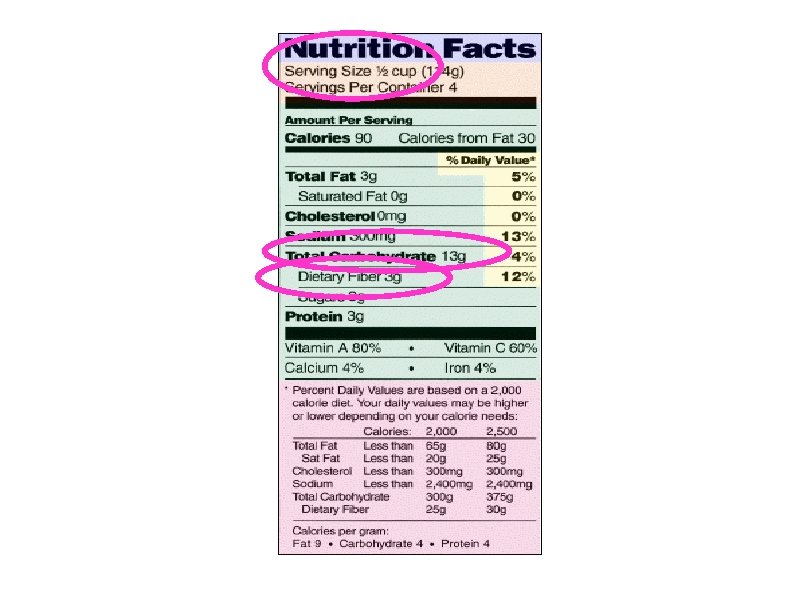

Are Food Labels Precise? • Is there a U. S. labeling regulation that establishes the allowable variance for the analyzed value vs. what is printed on the label? If so, what is the specific regulation? (April 2011) • Yes, FDA regulation, 21 CFR 101. 9 specify the allowable variance for Class II (naturally occurring nutrients) which includes the total carbohydrate content. • The value derived from a sample of twelve units, with one unit coming from each of twelve different randomly chosen shipper cases is the standard. • The analyzed value must be at least 80% of the label value and the analyzed value for the "nutrients to limit" (calories, sugars, total fat, saturated fat, cholesterol or sodium) must not be greater than 120% of the label value. These allowable variances are commonly referred to as the "80/120 rule. "

Carbohydrate Factor Method • Weigh a portion of food • Multiply the weight by its carb factor* • Get total grams of carbohydrate • This may not be practical all the time but can be used as a means to gain familiarity with a food *A carb factor is the percentage of the food’s weight that is carbohydrate. The rest is water, protein, fat, minerals Suggestion: Eat Smart Professional Scale Favorite scale: Eatsmart professionalhttp: //www. amazon. com/Eat. Smart-Digital-Nutrition. Scale-Professional/dp/B 0013 IDHTO/ref=cm_cr_pr_pb_t – check it out: http: //www. youtube. com/watch? v=-e. Pgh. F-ae. OQ

Carbohydrate Factor Method Carb Factor Examples: Apple: . 13 Apple Pie: . 32 Bagel: . 51 Carrot (raw): . 06 Chocolate Cake: . 51 Cornbread: . 45 Pancake: . 28 Pizza (cheese): . 32 Potato, baked: . 22 Potato Salad: . 09 Rice: . 27 Spaghetti: . 26 Vanilla Ice Cream: . 23 Watermelon: . 06 For carb factors for more than 6000 foods (in Excel spreadsheet format), go to: www. friendswithdiabetes. org/files/Carb%20 factor. xls

Carbohydrate Factor Method How much carb is in a baked potato weighing exactly 300 grams? 300 x. 22 g = 66 g carb

Portion Estimation • Use common, everyday objects to measure the portion size of food Soda can (12 fl. oz. ) = 1 ½ cups Baseball or adult’s fist = 1 cup Child’s fist = ½ cup Adult’s spread hand = 8” diameter Adult’s palm = 4” diameter

Portion Estimation Method • Other “tricks”: Long Sandwiches ~8 g per inch (6 in Subway = ~40 g) Pizza ~30 g per adult hand-sized piece (fingers together) Cookies ~30 g per adult-sized palm Breaded meat/veg/cheese ~4 g small (“thumb/nugget sized”) ~10 g large (“patty/palm-sized”)

Portion Estimation Method • Estimate the carbs: 20 g/cup X 1 ¼ cups 25 g

Portion Estimation Method • Estimate the carbs: 5 g / cup X 3 cups 15 g

Portion Estimation Method • Estimate the carbs: 30 g / hand X 1 1/3 hands 40 g

Carbohydrate Counting Tools • Calorie king Smart Phone App • Lenny the Lion: Aimed at kids, teaches carb counting • Restaurant Nutrition • Carb Finder • Fast Food Calories • Websites: • USDA Food Composition www. nal. usda. gov/fnic/foodcomp/search/ • Calorie King www. calorieking. com • Fast food companies’ or food manufacturers’ websites • Nutrition. Data. com

Do different carbs impact glucose differently? The WHO/FAO recommend that terms sugar as complex carbohydrate and sugars be removed from food labels and replaced with just total carbohydrate content and GI. Source: http: //www. glycemicindex. com/about. php Accessed 5. 5. 2012

There Must Be More to the Story…. • Carbohydrate Counting assumes… That only carbohydrates influence blood glucose and consequently, the dose of insulin required. Do you find this to be true? That all foods with the same carbohydrate content should have the same impact on blood glucose and consequently require the same amount of insulin. Do you find this to be true ?
 convert to blood glucose eventually • Glycemic")
Glycemic Index • All carbs (except fiber) convert to blood glucose eventually • Glycemic Index (G. I. ) Reflects the magnitude of blood glucose rise for the first 2 hours following ingestion • G. I. Number is % or rise relative to pure glucose (100% of glucose is in bloodstream within 2 hours) • Based on feeding measured portions of the food with 10 -50 grams of carbohydrate to 10 people without diabetes and monitoring their BG response over 2 hours. • Most studies are done in Canada and Australia, using it can add complexity. • Note – consuming a mixed meal (carb + protein + fat) will blunt the postprandial excursion vs. when carbohydrate consumed by itself • Source: http: //www. glycemicindex. com/about. php Accessed 5. 5. 2012
: Sample Graphs Adapted from Good Carbs Bad Carbs Reprinted courtesy of")
Glycemic Index (GI): Sample Graphs Adapted from Good Carbs Bad Carbs Reprinted courtesy of Marlowe & Company. Source: PPT Gushers and Trickers: Practical Use of the Glycemic Index By Johanna Burani, MS, RD, CDE American Diabetes Association Southern Regional Conference Marco Island, Florida May 26, 2006

GI Rate of Conversion Low GI 0 -55 Moderate 56 -69 High 70 or more
 70")
What’s your Guess? Low, Moderate or High? Raw Banana • GI (vs glucose) 70 • High

What’s your Guess? Low, Moderate or High? Premium Ice Cream: Ultra Chocolate • GI (vs Glucose) 37 • Low
 60")
What’s your Guess? Low, Moderate or High? Sweet Corn • GI (vs Glucose) 60 • Moderate

What about FIBER? • Fiber can slow down the conversion of enzymes that work on starch slowing the conversion to glucose. • If a food contains more than 5 grams of fiber, substract half the grams of fiber from the carbohydrate grams to get the total carbohydrate grams. • If a food contains more than 5 grams of sugar alcohols, subtract half the grams of sugar alcohol from the carbohydrate grams to get the carbohydrate grams. NOTE: excessive consumption of sugar alcohols can cause a laxative effect. • Is this practical? – not for everyone. • Bottomline: Eat more fiber, it is good for you. Might be practical for individuals that are insulin-sentivite (ICR of 1: 20 or higher or individuals following a vegetarian/vegan eating pattern) Institute of Medicine Dietary Reference Intakes for Energy 2002 DRI book page number for caloire in fiber http: //books. nap. edu/openbook. php? record_id=10490&page=349

What About Fat and Protein? • Fat and protein slow gastric emptying, which means they also slow the digestion of starch.

Carbs Are a VERY Efficient Source of Energy • They do not need to be restricted…

Possible Causes of Variable Glucose Response • Fat and protein content • Fasting / pre-meal BG • Available insulin • Exercise • Degree of insulin resistance • Type and Source of carb • Physical form (whole fruit vs. juice) • Type of starch (Amylose is slower and Amylopectin is faster) • Degree of processing (Highly processed foods are digested faster) • Ripeness of food • Food preparation Cooking swells starch molecules and softens foods, which speeds up the rate of digestion Source: Evert, 2012 and ADA Nutrition Recommendations and interventions for diabetes (position Statement; Diabetes Care 31 (suppl 1), 2008

Now you Know the Carb Content… What Next? • Monitor blood glucose with BG meter / CGM to assess the impact of the food on BG. Keep in mind in order to truly assess effectiveness of insulin dosages for meals you must know the carbohydrate content. Carbohydrates with different GI and differing fat, protein and fiber content may have different glucose profiles.

Know Your Insulin • The key to achieving post meal glucose levels within your target range is knowing the impact of the meal on your BG and how best to match the insulin to the food’s impact on BG. • Insulin action times for currently available rapid-acting insulin: Onset: 5 -15 minutes Peak between 30 -90 minutes Duration of 4 -6 hours

If You Doubt the Impact of Carbs on Glycemic Control… • 65% missed more than 1 meal bolus/week • ≥ 1 missed meal bolus/week was associated with a ½% increase in Hb. A 1 c Burdick, Chase, Pediatrics 113: e 221, 2004

Fig 1. Hb. A 1 c levels correlated with the number of missed meal insulin boluses per day (r =. 4) Burdick, J. et al. Pediatrics 2004; 113: e 221 -e 224 Copyright © 2004 American Academy of Pediatrics

The Challenge: Matching Insulin to Carbs

Are Current Analog Insulins as Fast as Carbs? Source Population Study Description Scaramuzza et Chidren with al. Diabetes T 1 D on insulin Technol 12: pump therapy 149 -152, 2010 Ideal time of meal boluses using apart/novolog. Compared doses given at start of meal, 15 min prior and after the meal Cobry et al. Subjects with Diabetes T 1 D using Techol 12: insulin pump 173 -177, 2010 Ideal timing of meal boluses using glulisine/ apidra. Compared doses given at 20 min prior to meal, at start of meal and 20 min after start of meal. Luijf et al. Subjects with Diabetes Care T 1 D using 33: 2152 insulin pump 2155, 2010 Ideal timing of meal boluses using aspart/ novolog. Compared doses given at 0, 15 and 30 min prior to meal. therapy Evert and Franz, 2012 Results Glucose 3 hours after meal was lower with pre-meal insulin given 15 min prior or immediately before meal rather than after. • Significant reduction in 1 hour PP BG with dose 15 min prior to meal. • Results occurred even if BG was low before eating (gave CHO for low before meal bolus). • At 1 and 2 hour post meal glucose excursions were lower when insulin was given 20 min before the meal. • Taking insulin 15 minutes prior to meal resulted in lower post meal glucose excursions and increased time in target without increasing hypoglycemia. •

More on Meal Insulin Dose Timing • There is no clear consensus on how best to handle meal insulin timing in the presence of hypoglycemia. Below are some suggestions: If low before a meal, treat the low (with carbs), inject the meal insulin and then eat. (Scaramuzza, 2010) Treat the low and delay meal insulin dose for a short time. (Trigdell, 2010) Based on clinical experience, the individual could also be advised to reduce the meal insulin or increase carb consumption. (Evert and Franz, 2012) • Timing of premeal insulin should be based on clinical experience and may not be advisable when: Timing of meal is not certain Carbohydrate intake is not predictable (young children, picky eaters, elderly) (Evert and Franz, 2012, Trigdell, 2010) Type of food Activity

Initial Data: TDD= 40 units I: CHO Ratio at Breakfast 1: 10 grams all other meals 1: 12 grams Delivers bolus immeditaely before or just after the start of the meal.

3 Months Later: Boluses 5 -15 min Pre-Meal Unless Low. .

Taking it to the Next Level with Insulin Pump Therapy • A small prospective cross-over study in pediatric T 1 D showed significant reductions in BG before and 2 hours after meals despite not making changes in insulin doses in children while using the bolus calculator. Shashaj et al. Benefits of a bolus calculator in pre- and post-prandial glycemic control and meal flexibility of paediatric patients using CSII. Diabet Med 25: 10361042, 2008. (Evert and Franz, 2012)

Insulin delivered over time • Potential uses: • Low carb meals high in fat/ protein • Extended Bolus Insulin Extended/ Square Wave Bolus Gastroparesis Time A combination of a normal bolus plus an Extended extended bolus Bolus • Potential uses: • Carb containing meals high in fat/ protein • Gastroparesis Combo Bolus Insulin Combination/ Dual Wave Bolus Time

What’s New in Research?

Optimizing Post Meal Glucose in Pediatric T 1 DM: Pump Therapy • Study evaluating 4 different meal and types of boluses on 3 hour post meal glucose. • N=20 subjects aged 8 -18 years and a control group without T 1 D was also studied. • Meals had the similar carb, fat and protein content but different glycemic index. • Same meal was given 2 days in a row with different bolus types; regular bolus (100% given immediately before the meal) and a dual wave with 50% given immediately before the meal and 50% extended over 2 hours. • High GI food: pre-meal bolus type had little effect on post meal glucose and regardless of type of insulin used were higher. Post meal glucoses were 3 x higher than the controls without diabetes. • Low GI foods the dual wave bolus had a 3 hour post meal glucose AUC that was 47% lower than the standard bolus and the glucose profiles closely mirrored the control arm (without diabetes). NOTE: Subjects with a lower pre-meal glucose were significantly more likely to experience a low post meal when using a standard bolus rather than a DW. O’Connell et al. Optimizing postprandial glycemia in pediatric patients with type 1 diabetes using insulin pump therapy: Diabetes Care vol. 31 (8); pp 1491 -1495

A: Low GI meal. O'Connell M A et al. Dia Care 2008; 31: 1491 -1495 Copyright © 2011 American Diabetes Association, Inc.

What About Pizza? • Several small studies compared use of a normal bolus to a dual wave bolus and impact on post meal BG. Normal bolus and DW had similar BG profiles for 3 hours, however, at 514 hours the normal bolus was associated with elevated BG. Lowest post meal glucoses were lowest at 90 -120 minutes when DW was 70% up front and 30% extended over 2 hours. Lee SW et al. The dual-wave bolus feature in CSII controls prolonged post-prandial hyperglycemia better than standard bolus in type 1 diabtes. Diabetes Nutr Metab 17: 211 -216, 2004. ) Chase 2002 Lowest mean glucose and best postprandial control were achieved with a DW bolus where 50% was given up front and 50% was extended over 8 hours. Jones SM et al: Optimal insulin pump dosing and postprandial glycemia following a pizza meal using the continuous glucose monitoring system. Diabetes Technol Ther 7: 233 -240, 2005 Evert and Franz, 2012

Can we improve estimation of mealtime insulin doses? • N= 28 adults with T 1 D on insulin pump therapy used CGM to assess post-meal glucose levels. • Uses a novel strategy for insulin dosing based on the hypothesis that insulin requirements may be more precisely predicted by examining the physiologic insulin response to a food in people without diabetes: Food Insulin Index (FII) for Normal Insulin Demand for Dose Adjustment (NIDDA). FII is based on insulin demand for 1, 000 kj portions of a single food consumed by subjects without diabetes. This method takes into account all dietary factors, not just carbs. • To test this subjects were given one meal that was high in carbs (75 grams) with only 20% of calories from fat and protein (1600 calories). • Other meal had half the carbs (41 grams) and the same insulin demand based on the FII (7 grams more protein and 11 grams more fat) but 1600 calories. Bao, J et al. Improving the Estimation of Mealtime Insulin Dose in Adults with Type 1 Diabetes, the Normal Insulin Demand for Dose Adjustment Study. Diabetes Care. Vol 34 Oct. 2011; 2146 -2151

Results of FII Study • Compared with carbohydrate counting, the FII algorithm resulted in a 31% increase in the time spent within the target range (72 -180 mg/d. L/ 4 -10 mmol/L). • The FII algorithm also produced a 30 mg/d. L / 1. 7 mmol/L (41% lower) peak blood glucose when compared to carb counting. • There was no significant difference in the percent of time within target between meal A (high carb) with Carb Counting and Meal B (less carb, more fat and protein) using FII algorithm however, meal A had a significantly higher peak blood glucose than meal B with FII. • FII did not singificantly increase hypoglycemia. • FIRST stage of evidence that use of a FII based on insulin demand of subjects without diabetes may be an effective tool for estimating insulin in T 1 D. • Limitations, : only 120 foods, more studies need to be done… Bao, J et al. Improving the Estimation of Mealtime Insulin Dose in Adults with Type 1 Diabetes, the Normal Insulin Demand for Dose Adjustment Study. Diabetes Care. Vol 34 Oct. 2011; 2146 -2151

Putting it all together. . . • Carbohydrates are main factor in the diet impacting glycemic control. • Carbs are an efficient source of energy for the body. • GI: Different carbs impact glucose differently. • Fat and protein slow down gastric emptying, and thus, slows down digestion of starch. • If you simply count carbohydrate, but ignore fat/calorie content of foods you can gain weight. • Current analog insulins may not be as fast as the carbs we eat, the timing matters!

A Glimpse of the Future….
- Slides: 47