
DG MARE Technical workshop Socioeconomic monitoring of the


- Slides: 14
DG MARE Technical workshop: Socio-economic monitoring of the Atlantic 23 March 2015 1
Agenda EY and COWI’s assistance in the development of guidelines to monitor the AAP Methodology encountered followed and key challenges Next steps and future challenges 2
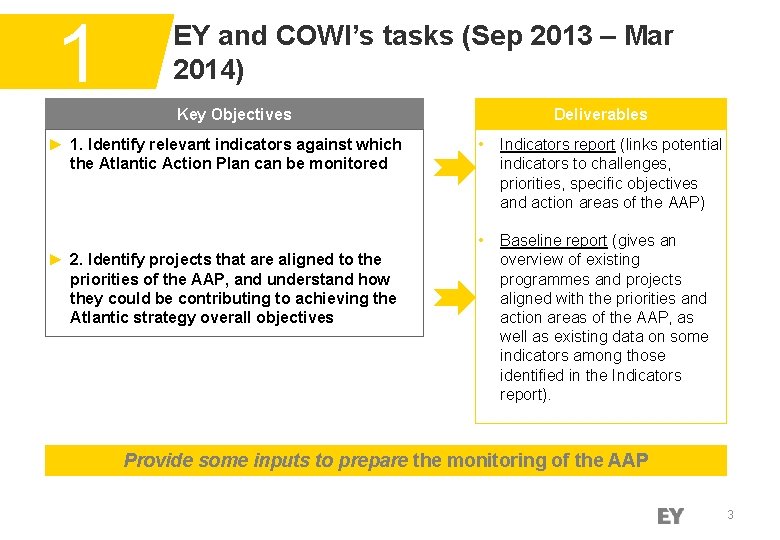
1 EY and COWI’s tasks (Sep 2013 – Mar 2014) Key Objectives ► 1. Identify relevant indicators against which the Atlantic Action Plan can be monitored ► 2. Identify projects that are aligned to the priorities of the AAP, and understand how they could be contributing to achieving the Atlantic strategy overall objectives Deliverables • Indicators report (links potential indicators to challenges, priorities, specific objectives and action areas of the AAP) • Baseline report (gives an overview of existing programmes and projects aligned with the priorities and action areas of the AAP, as well as existing data on some indicators among those identified in the Indicators report). Provide some inputs to prepare the monitoring of the AAP 3
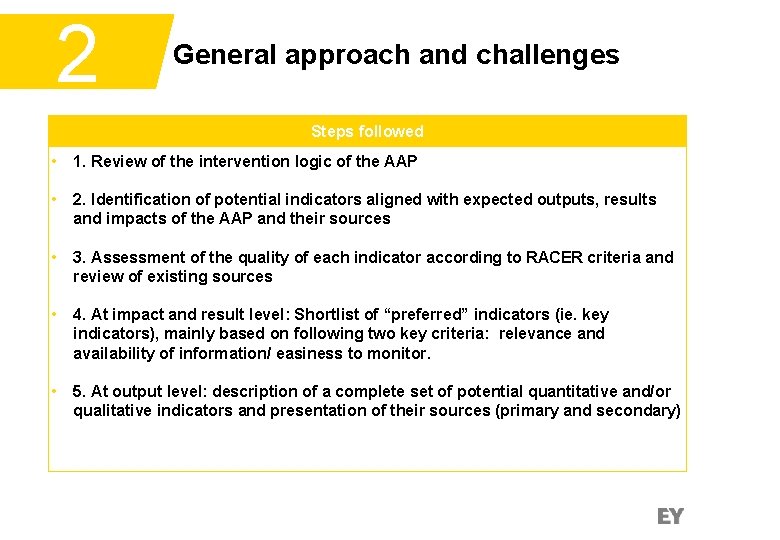
2 General approach and challenges Steps followed • 1. Review of the intervention logic of the AAP • 2. Identification of potential indicators aligned with expected outputs, results and impacts of the AAP and their sources • 3. Assessment of the quality of each indicator according to RACER criteria and review of existing sources • 4. At impact and result level: Shortlist of “preferred” indicators (ie. key indicators), mainly based on following two key criteria: relevance and availability of information/ easiness to monitor. • 5. At output level: description of a complete set of potential quantitative and/or qualitative indicators and presentation of their sources (primary and secondary)
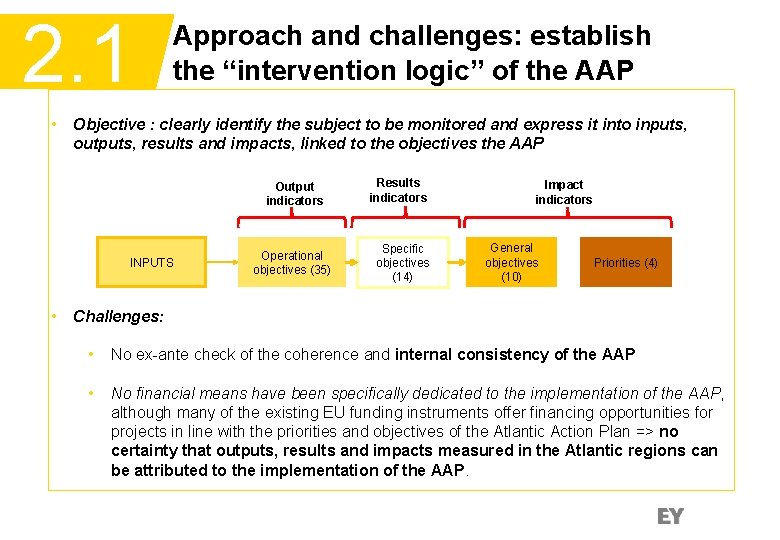
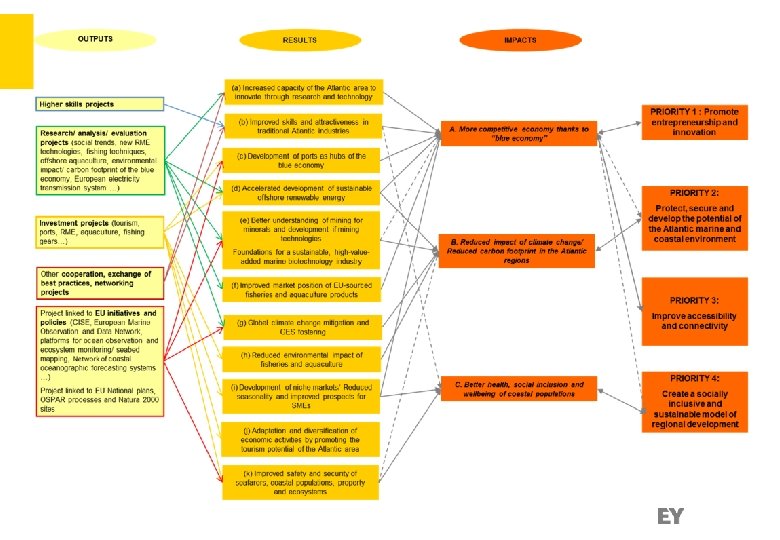
2. 1 • Approach and challenges: establish the “intervention logic” of the AAP Objective : clearly identify the subject to be monitored and express it into inputs, outputs, results and impacts, linked to the objectives the AAP Output indicators INPUTS • Operational objectives (35) Results indicators Specific objectives (14) Impact indicators General objectives (10) Priorities (4) Challenges: • No ex-ante check of the coherence and internal consistency of the AAP • No financial means have been specifically dedicated to the implementation of the AAP, although many of the existing EU funding instruments offer financing opportunities for projects in line with the priorities and objectives of the Atlantic Action Plan => no certainty that outputs, results and impacts measured in the Atlantic regions can be attributed to the implementation of the AAP.
2 Approach and challenges (2) : establish the intervention logic
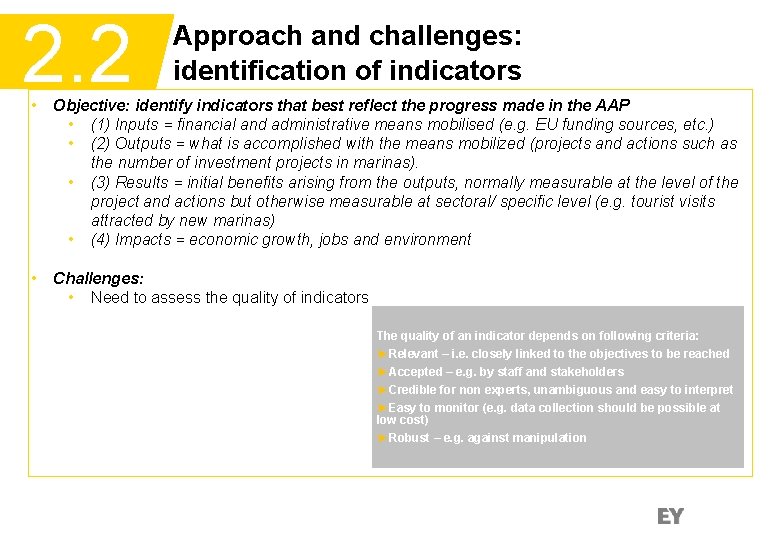
2. 2 Approach and challenges: identification of indicators • Objective: identify indicators that best reflect the progress made in the AAP • (1) Inputs = financial and administrative means mobilised (e. g. EU funding sources, etc. ) • (2) Outputs = what is accomplished with the means mobilized (projects and actions such as the number of investment projects in marinas). • (3) Results = initial benefits arising from the outputs, normally measurable at the level of the project and actions but otherwise measurable at sectoral/ specific level (e. g. tourist visits attracted by new marinas) • (4) Impacts = economic growth, jobs and environment • Challenges: • Need to assess the quality of indicators The quality of an indicator depends on following criteria: ►Relevant – i. e. closely linked to the objectives to be reached ►Accepted – e. g. by staff and stakeholders ►Credible for non experts, unambiguous and easy to interpret ►Easy to monitor (e. g. data collection should be possible at low cost) ►Robust – e. g. against manipulation
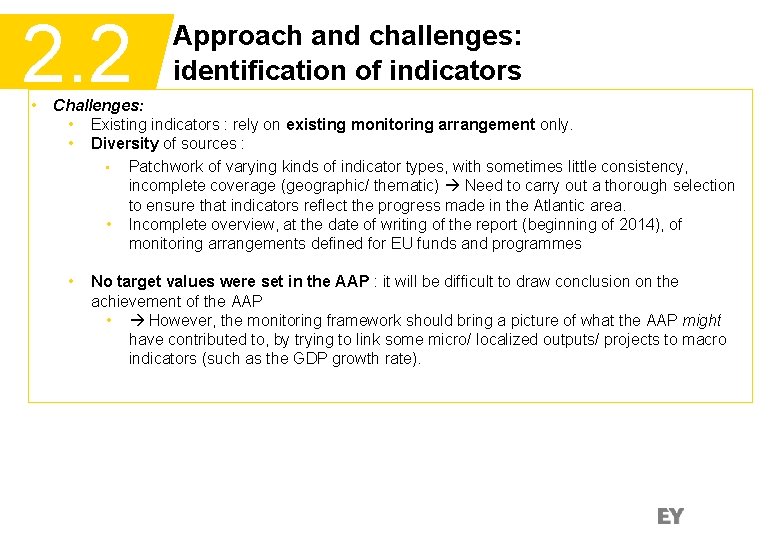
2. 2 • Approach and challenges: identification of indicators Challenges: • Existing indicators : rely on existing monitoring arrangement only. • Diversity of sources : • Patchwork of varying kinds of indicator types, with sometimes little consistency, incomplete coverage (geographic/ thematic) Need to carry out a thorough selection to ensure that indicators reflect the progress made in the Atlantic area. • Incomplete overview, at the date of writing of the report (beginning of 2014), of monitoring arrangements defined for EU funds and programmes • No target values were set in the AAP : it will be difficult to draw conclusion on the achievement of the AAP • However, the monitoring framework should bring a picture of what the AAP might have contributed to, by trying to link some micro/ localized outputs/ projects to macro indicators (such as the GDP growth rate).
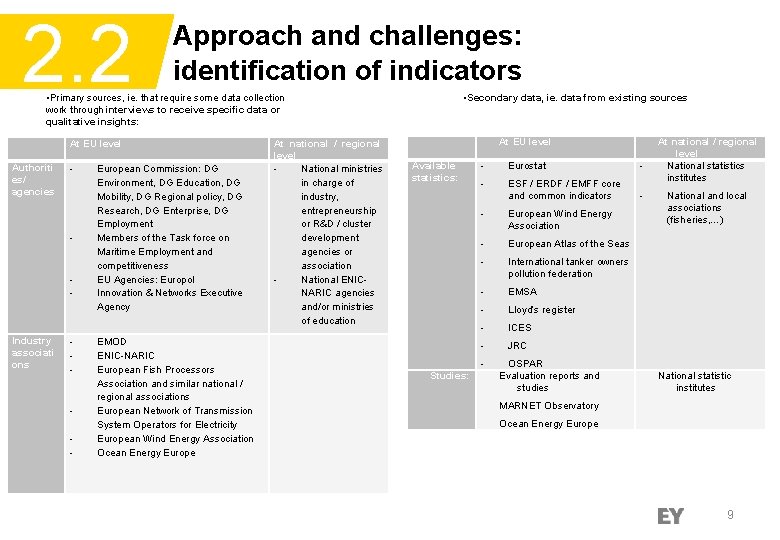
2. 2 Approach and challenges: identification of indicators • Secondary data, ie. data from existing sources • Primary sources, ie. that require some data collection work through interviews to receive specific data or qualitative insights: Authoriti es/ agencies At EU level - - - Industry associati ons - - European Commission: DG Environment, DG Education, DG Mobility, DG Regional policy, DG Research, DG Enterprise, DG Employment Members of the Task force on Maritime Employment and competitiveness EU Agencies: Europol Innovation & Networks Executive Agency EMOD ENIC-NARIC European Fish Processors Association and similar national / regional associations European Network of Transmission System Operators for Electricity European Wind Energy Association Ocean Energy Europe At national / regional level National ministries in charge of industry, entrepreneurship or R&D / cluster development agencies or association National ENICNARIC agencies and/or ministries of education Available statistics: At EU level - Eurostat - - ESF / ERDF / EMFF core and common indicators - - European Wind Energy Association - European Atlas of the Seas - International tanker owners pollution federation - EMSA - Lloyd’s register - ICES - JRC Studies: OSPAR Evaluation reports and studies At national / regional level National statistics institutes National and local associations (fisheries, …) National statistic institutes MARNET Observatory Ocean Energy Europe 9
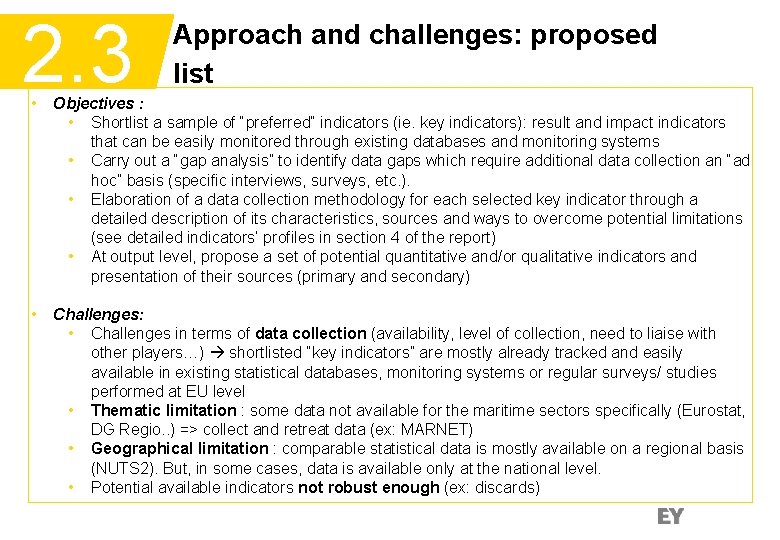
2. 3 Approach and challenges: proposed list • Objectives : • Shortlist a sample of “preferred” indicators (ie. key indicators): result and impact indicators that can be easily monitored through existing databases and monitoring systems • Carry out a “gap analysis” to identify data gaps which require additional data collection an “ad hoc” basis (specific interviews, surveys, etc. ). • Elaboration of a data collection methodology for each selected key indicator through a detailed description of its characteristics, sources and ways to overcome potential limitations (see detailed indicators’ profiles in section 4 of the report) • At output level, propose a set of potential quantitative and/or qualitative indicators and presentation of their sources (primary and secondary) • Challenges: • Challenges in terms of data collection (availability, level of collection, need to liaise with other players…) shortlisted “key indicators” are mostly already tracked and easily available in existing statistical databases, monitoring systems or regular surveys/ studies performed at EU level • Thematic limitation : some data not available for the maritime sectors specifically (Eurostat, DG Regio. . ) => collect and retreat data (ex: MARNET) • Geographical limitation : comparable statistical data is mostly available on a regional basis (NUTS 2). But, in some cases, data is available only at the national level. • Potential available indicators not robust enough (ex: discards)
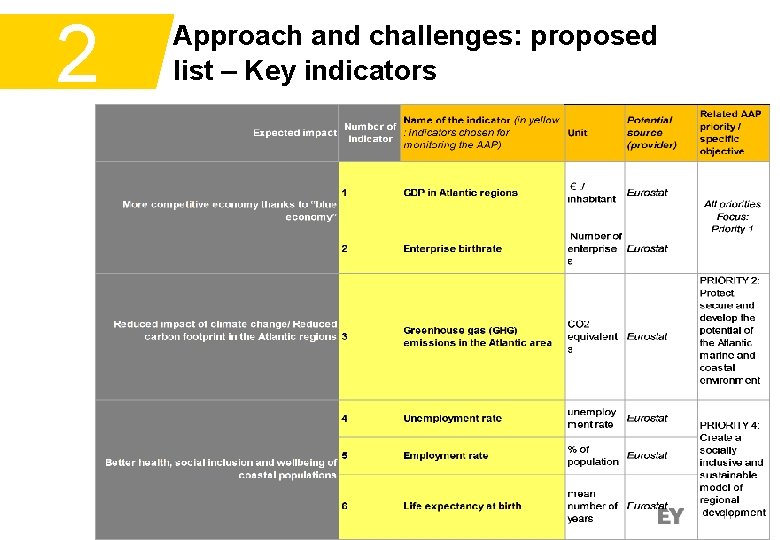
2 Approach and challenges: proposed list – Key indicators 11
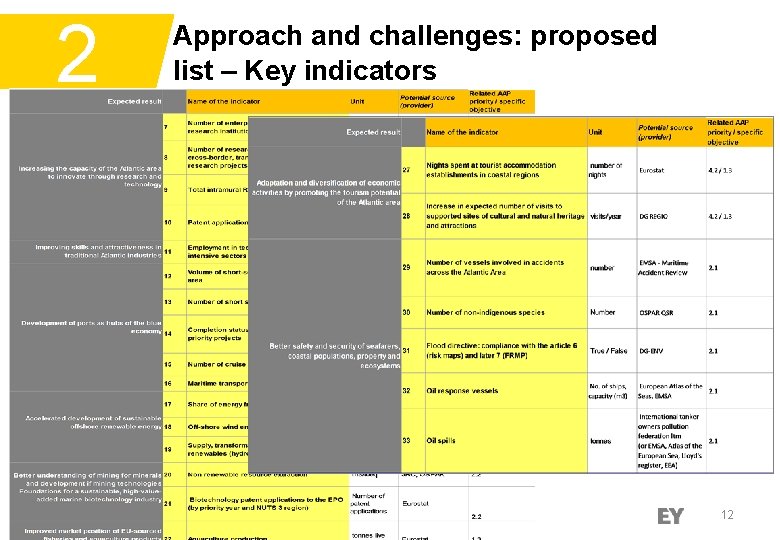
2 Approach and challenges: proposed list – Key indicators 12
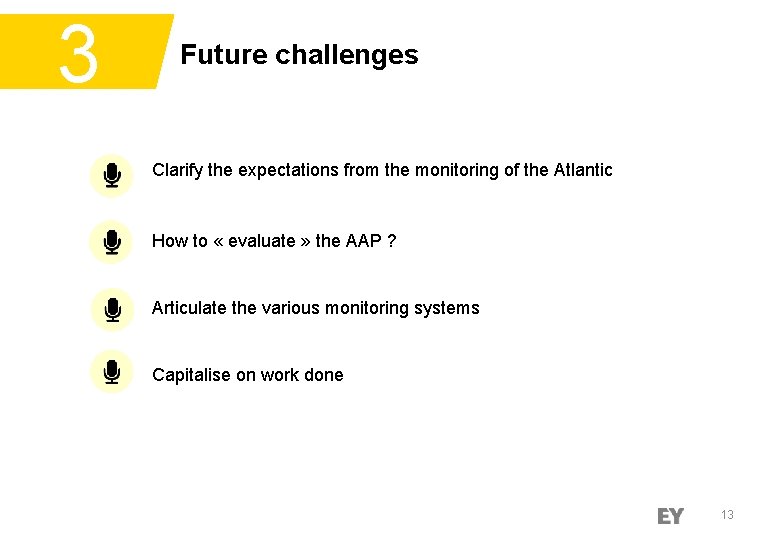
3 Future challenges Clarify the expectations from the monitoring of the Atlantic How to « evaluate » the AAP ? Articulate the various monitoring systems Capitalise on work done 13
n Your contacts: n Christina CASTELLA: christina. castella@fr. ey. com n EY France Tel. : +33 (0)6 80 04 47 72 14