DG 0 system DH 0 system TDS 0

 Q =")
 K = equilibrium constant This is")


 The change in free energy to reach equilibrium, beginning with 1. 0")


 + 3 H")
 Ca. O(s) +")
 A physical analogy illustrating the difference between thermodynamic and kinetic")
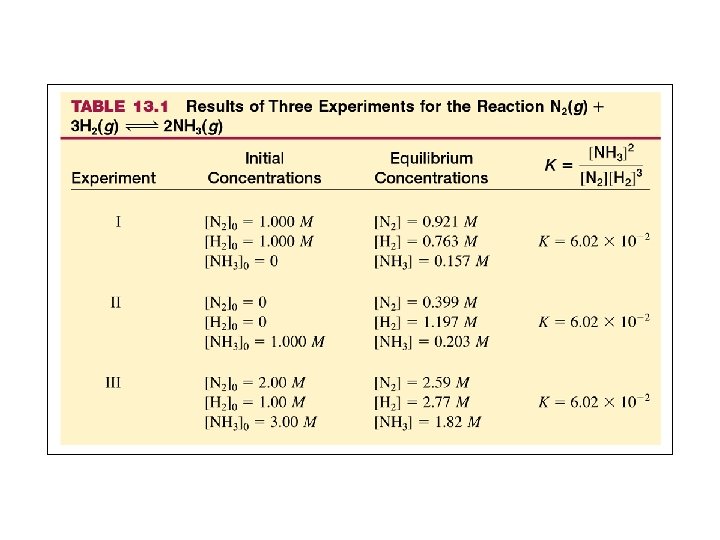
 The initial equilibrium mixture of N 2, H 2, and")


- Slides: 25
DG 0 system = DH 0 system - TDS 0 system DG 0 rxn = S m. DG 0 products - S n. DG 0 reactants
Free Energy and Pressure • • G = G + RT ln(Q) Q = reaction quotient from the law of mass action.
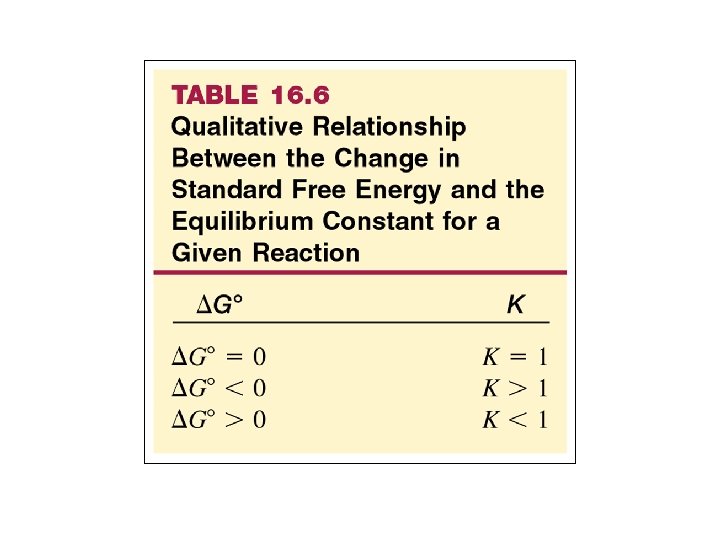
Free Energy and Equilibrium G = RT ln(K) K = equilibrium constant This is so because G = 0 and Q = K at equilibrium.
Free Energy, Equilibrium and Reaction Direction • If Q/K < 1, then ln Q/K < 0; the reaction proceeds to the right ( G < 0) • If Q/K > 1, then ln Q/K > 0; the reaction proceeds to the left ( G > 0) • If Q/K = 1, then ln Q/K = 0; the reaction is at equilibrium ( G = 0) DG = DGo+RT ln Q DG 0 = - RT ln. K
Figure 16. 7: Schematic representations of balls rolling down two types of hills.
atm. (b) The change in free energy to reach equilibrium, beginning with 1. 0 mol B(g) at PB = 2. 0 atm. (c) The free energy profile for A(g) B(g) in a system containing 1. 0 mol (A plus B) at PTOTAL = 2. 0 atm. Each point on the curve corresponds to the total free energy of the system for a given combination of A and B.
Figure 20. 12 The relation between free energy and the extent of reaction DG 0 < 0 K >1 DG 0 > 0 K <1 Copyright © The Mc. Graw-Hill Companies, Inc. Permission required for reproduction or display.
Table 20. 2 The Relationship Between DG 0 and K at 250 C DG 0(k. J) K 100 3 x 10 -18 50 2 x 10 -9 10 2 x 10 -2 1 7 x 10 -1 0 1 -1 1. 5 -10 5 x 101 -50 6 x 10⁸ -100 3 x 10¹⁷ -200 1 x 1035 Essentially no forward reaction; reverse reaction goes to completion Forward and reverse reactions proceed to same extent REVERSE REACTION 9 x 10 -36 FORWARD REACTION 200 Significance Forward reaction goes to completion; essentially no reverse reaction
DG and the Work a System Can Do For a spontaneous process, G is the maximum work obtainable from the system as the process takes place: G = workmax For a nonspontaneous process, G is the maximum work that must be done to the system as the process takes place: G = workmax An example
The Law of Mass Action • For • j. A + k. B l. C + m. D • The law of mass action is represented by the equilibrium expression:
Figure 13. 2: The changes in concentrations with time for the reaction H 2 O(g) + CO(g) H 2(g) + CO 2(g) when equimolar quantities of H 2 O(g) and CO(g) are mixed.
Figure 13. 4: The changes with time in the rates of forward and reverse reactions for H 2 O(g) + CO(g)H 2(g) + CO 2(g) when equimolar quantities of H 2 O(g) and CO(g) are mixed. The rates do not change in the same way with time because the forward reaction has a much larger rate constant than the reverse reaction.
Figure 13. 5: A concentration profile for the reaction N 2(g) + 3 H 2(g)-->2 NH 3(g) when only N 2(g) and H 2(g) are mixed initially.
Figure 13. 6: The position of the equilibrium Ca. CO 3(s) Ca. O(s) + CO 2(g) does not depend on the amounts of Ca. CO 3(s) and Ca. O(s) present.
Figure 13. 7: (a) A physical analogy illustrating the difference between thermodynamic and kinetic stabilities. (b) The reactants H 2 and O 2 have a strong tendency to form H 2 O.
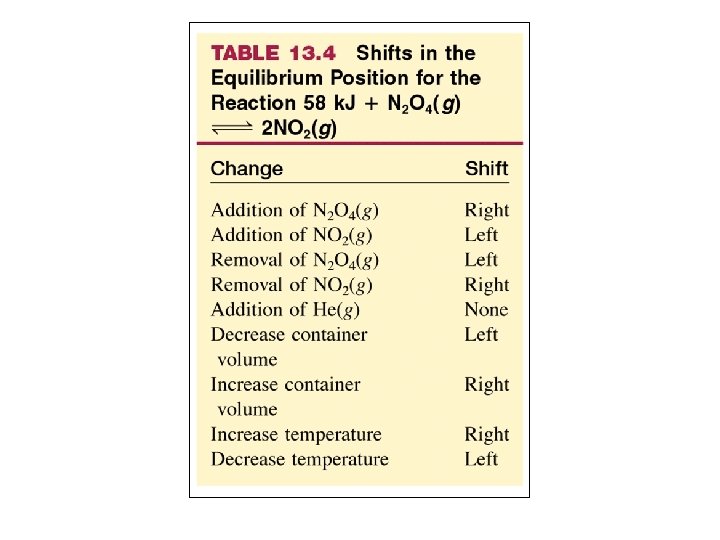
Figure 13. 8: (a) The initial equilibrium mixture of N 2, H 2, and NH 3. (b) Addition of N 2. (c) The new equilibrium position for the system containing more N 2 (due to addition of N 2), less H 2, and more NH 3 than in (a).