Development that lasts The Affordable Human Development Index

Development that lasts: The Affordable Human Development Index. Presentation by Andrey Ivanov, EU FRA Mihail Peleah, UNDP BRC for UNECE Conference, 2 -4 December 2013

Going beyond monetary poverty: where? • Multidimensional wellbeing Social Exclusion Index • How affordable (sustainable) is our wellbeing Affordable Human Development Index • Qualitative and Quantitative data nexus ‘Micronarratives’

DEVELOPMENT THAT LASTS: THE AFFORDABLE HUMAN DEVELOPMENT INDEX

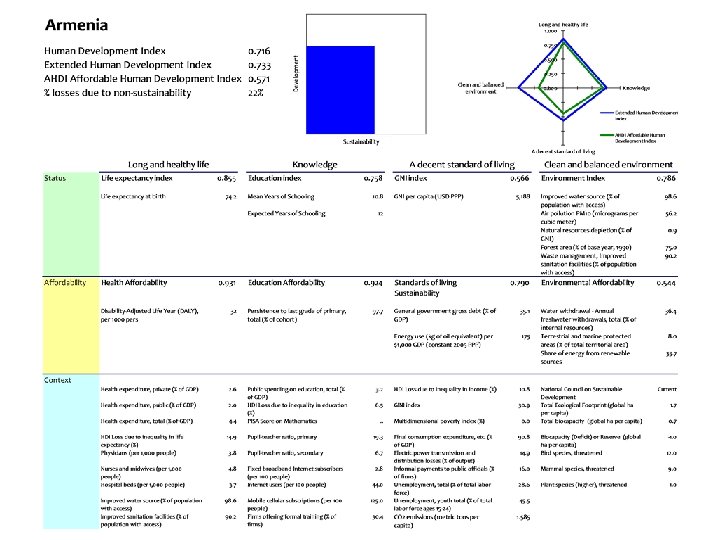
Environmental Footprint of Consumption 12. 0 UAE Qatar 10. 0 Estonia 8. 0 Denmark USA Kuwait Mongolia 6. 0 4. 0 Ghambia Nepal China India 2. 0 Armenia DR Congo Mozambique 0. 0 0. 200 0. 300 0. 400 0. 500 0. 600 0. 700 0. 800 Human Development Index 0. 900 1. 000

Affordable HDI: Why this index? • It measures what cost is achieved, and at what • Measure of development: level sustain and ability to • Proposed for Armenia, currently tested for Europe • Still a proposal, with open questions: o Sustainability indicators o Ideal vs available indicators o Dynamics and substitutions

Affordable HDI Construction Status Affordability Context HDI EHDI AHDI
 Available indicator(s) Water pollution Access to improved water")
Environmental indicators: status Area Ideal indicator(s) Available indicator(s) Water pollution Access to improved water source Air pollution PM 10 Soil Share of degraded soils Natural resources depletion (% of Gross National Savings) Forest Loss of forestation relative to base year Forest area, % relative to reference year (1990) Biodiversity Loss of biodiversity Habitat — Share of population covered by Access to improved waste collection and sanitation facilities processing
 Available indicator(s) Water Sustainability of water resource use")
Environmental indicators: sustainability Area Ideal indicator(s) Available indicator(s) Water Sustainability of water resource use Water withdrawal as share of internal resources Air Purification of air emissions — Soil Rate of soil degradation — Forest Rate of forestation loss relative to base year — Biodiversity Measures to protect biodiversity Share of terrestrial and marine protected areas Habitat Share of waste processed or recycled Share of renewable and sustainable energy
 Available indicator(s) Long and healthy life Healthy or Disability")
Sustainability indicators Dimension Ideal indicator(s) Available indicator(s) Long and healthy life Healthy or Disability Free Life Expectancy Knowledge Persistence to last grade of primary, total (% of cohort) Quality of education— results of comparable tests A decent standard of Sustainability of current General government gross living consumption model debt (% of GDP) CO 2 emissions (metric tons per capita) Energy use (kg of oil equivalent) per $1, 000 GDP (constant 2005 PPP)

EHDI, AHDI and losses due to nonsustainability

Contribution to non-affordability

Mihail Peleah, UNDP Bratislava Regional Center mihail. peleah@undp. org Andrey Ivanov, EU Fundamental Rights Agency Andrey. IVANOV@fra. europa. eu
- Slides: 14