Development of the Flash Flood Potential FFPI The
 The Flash Flood Potential Index for Central")

 n n n Developed by hydrologist Greg Smith, CBRFC")


- Slides: 20
Development of the Flash Flood Potential (FFPI) The Flash Flood Potential Index for Central NY and Northeast PA by Jim Brewster WFO Binghamton, NY Moneypenny Creek Flash Flood – May 2004
Background n n Flooding is WFO Binghamton’s #1 High Impact Hazard Central NY and Northeast PA have highly variable geography, land cover and use. n n n Steep, rocky terrain along with flatter sandy plains Areas of urbanization Wide range of forest cover Similar soil types Experienced forecasters understand some areas are more prone to flash flooding than others. But, Where and to what extent?
Flash Flood Potential Index (FFPI) n n n Developed by hydrologist Greg Smith, CBRFC (2003). He understood that geographical features play a key role in flash flooding. Developed as background information to be incorporated into production of better gridded Flash Flood Guidance Using the FFPI, the roles of land, vegetation and urbanization in flash flooding are visualized. “Guesswork” to the flash flood problem is reduced
Methodology for creating FFPI n n Collected available geographic data sets Using GIS Projected datum to Albers Equal Area n Re-sampled data sets to 90 meter resolution n Reclassified data to a standard index n n Mathematically develop a new geographic index grid…the FFPI
The Data n Four geographic data sets : n n Slope derived from the USGS DEM (Digital Elevation Model) MLRC Land Use/Land Cover Grid AVHRR Forest Density Grid STATSGO Soil Type Classification
Slope Index n n Exponentially scaled from 1 -10 USGS & engineering studies n n n ~30% slope is rated strong-very strong slope. Approx 20 o angle. Indexed >30% as 10.
Indexed Land Use/Land Cover n n Much of region shares a similar index Mixed forest & grassland. n n n Mild-Moderate effect on hydrology Swamp/water 1 -2 Urban areas 8 -10
Indexed Forest Density n High density forest areas are given a low potential flood index. n n Higher uptake rate of moisture Low density areas are given high potential index. n Lower uptake rate of moisture
Indexed Soil Texture Class FFPI 1 – Sand 2 2 – Loamy Sand 4 3 – Sandy Loam 3 4 - Silty Loam 4 5 – Silt 5 6 – Loam 6 7 – Sandy Clay Loam 7 8 – Silty Clay Loam 7 9 – Clay Loam 8 10 – Sandy Clay 7 11 – Silty Clay 8 12 – Clay 9 13 – Organic Matter 5 14 – Bedrock 10
Methodology Review n Weight average the geographic layers. n n FFPI = (1. 5*Slope + LC + Soils + Forest)N Local adjustment to calculation Reviewed against historical events n Flash flooding occurs in our forested areas. n Is that element really much of an influence here? n n n FFPI = (1. 5*Slope + LC + Soils + 0. 5*Forest)/N Raw grid is then zonally averaged into the FFMP basins.
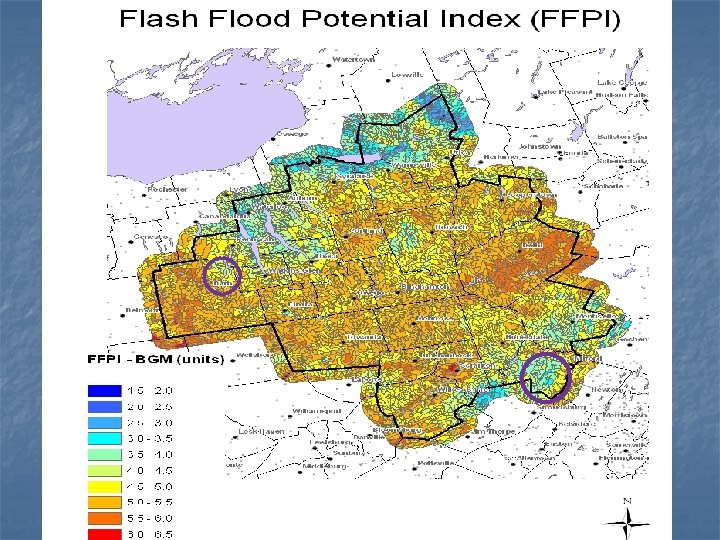
n n n 90 Meter Resolution Warm colors = High Potential Cool colors = Low Potential
FFPI mapped to FFMP Basins n n n Fit our conceptual flash flood model. New realizations, especially the areas of low FF potential. Differentiates the “best of the worst” basins in an area generally known for high flash flood potential.
FFPI Versatility § Flexible Formatting § ESRI Shape file § KML/KMZ § Geo. Tif §Google Earth §BMP § GRx Analyst
Case Example
Fatal Gorge Flood
Storm Total Precipitation
90 m High Resolution High resolution GIS imagery of FFPI can be useful to customers and partners for identifying local, potential flood problem areas that may not be already known.
Summary n n n The FFPI was developed in Binghamton due to the important need to have a static geophysical reference grid which better illustrates how local earth system features contribute to flash flooding. The FFPI is best used operationally when mapped to the AWIPS FFMP basins for comparison with other flash flood tools and techniques. Through GIS technology, the index could be developed by any local office. n Note: The original developer has a project underway with Office of Hydrology to further develop and expand the FFPI nationally.
First Year Performance n Reduced false alarms n n Two warnings - Pike County, PA and Oneida County, NY were not issued. Follow-up confirmed no flooding Increased Lead Time n Boosted forecaster confidence that additional rain would lead to flash flooding (Warn on Forecast) – Major flash flooding resulted in Delaware County, NY Questions ?