DEVELOPMENT OF NATURAL RUBBER INDUSTRIES FOR THE WORLD

DEVELOPMENT OF NATURAL RUBBER INDUSTRIES FOR THE WORLD AND MALAYSIA Compiled and presented by Teo Soon Huat Board Member of MRB & MREPC Dated 23 rd July 2020 Source: MRB, MRE , IRCO & IRSG.

MALAYSIAN NATURAL RUBBER PRODUCTION: 1910 - 6, 310 tons 1919 - 174, 320 tons and net exports formed about 50% of the world’s total 1968 - 1, 100, 280 tons 1976 - 1, 638, 760 tons 1988 - 1, 661, 550 tons when the AIDS epidemic emerged, about 33% of world production of 5. 030 million tons 2018 - 603, 285 tons ranked No. 7 of world production or about 4. 3% of 13. 869 million tons 2019 - Production Imports Domestic Consumption Exports 639, 830 tons (Ranked No. 7) 1, 082, 700 tons (Ranked No. 3) 515, 588 tons (Ranked No. 8) 1, 020, 220 tons (Ranked No. 4) (Malaysia is NET IMPORTER but developed into Regional NR Processing Hub years ago) 2020 - 550, 000 tons (estimated production to drop 15% from year 2019) Note – In 1940 -70’ Rubber Plantation and Estates produced about 60% and Rubber Smallholders About 40%, natural rubber and tin were biggest earners for Malaysian economy. Since 1980’ the Smallholders produce about 95% and plantation/estate about 5%.
 1")
GRADES AND TYPES OF NATURAL RUBBER PROCESSED AND PACKED: Ribbed Smoked Sheet (RSS) 1 , 2 , 3, 4, 5 - Major Grade is RSS 3 Air Dried Sheet (ADS) Centrifuged Latex (60% DRC) – High Ammonia, Low Ammonia & Compounded Latex Based Pale Crepe Blanket Sheet Rubber (starting raw materials are cup lump & rubber lace in the earlier year) SMR Grades (commercialized in 1964 – Jointly developed and commercialized by MRRDB, MARDEC & Lee Rubber Group Factory) SMR CV, SMR L, EKOPRENA, PUREPRENA (Latex based SMR) SMR 5, SMRGP, SMR 10, SMR 20, SMR 10 CV & SMR 20 CV – (mainly for tires)

INTERNATIONAL, REGIONAL & LOCAL RUBBER ORGANISATIONS: INTERNATIONAL: 1930 – International Rubber Regulation Scheme formed with aims to secure higher prices through export control, new planting and replanting by major rubber producing countries. Natural rubber prices plunged after great recession in 1929. 1948 - International Rubber Study Group (IRSG) established in 1948 by both Producing & Consuming countries. Malaysia was one of the founding member country and was ceased its membership in 2000. 1980 -1999 - International Natural Rubber Organization (INRO) regulated the International Rubber Agreement (INRA)- The objective is to cooperate between both producing and Consumption countries to stabilize natural rubber prices. The INRA terminated in 1999 after Asia Financial Crisis in 1997.

INTERNATIONAL, REGIONAL & LOCAL RUBBER ORGANISATIONS: INTERNATIONAL: 1970 - The Association of Natural Rubber Producing Countries (ANRPC), the Association countries members produced about 90% of the world. The secretariat office is located in Kuala Lumpur. International Rubber Research & Development Board (IRRDB) – members are Rubber Research Institution of Rubber Producing countries. RRIM is founding member and the IRRDB Secretariat is located in Kuala Lumpur International Rubber Association (IRA) – members are Rubber Association for both producing & Consuming countries. MRE/FRTAM representing Malaysia, other members are Thailand Rubber Association, Indonesia Rubber Association, Rubber Trade Association of Singapore, Japan Rubber Association, European Rubber Association, America Rubber Association & etc. The key roles of the IRA are to seek cooperation among natural rubber producers and consumers on matters concern rubber contracts, packing , logistics and others. Global Planform Sustainability Natural Rubber (GPSNR) – members are private sectors involved in Rubber industry, the members are mainly from major tires companies, NGO & regional rubber processing sectors. The Secretariat is located in Singapore.
")
INTERNATIONAL, REGIONAL & LOCAL RUBBER ORGANISATIONS: REGIONAL: 2001 - International Tripartite Rubber Council (ITRC) – Countries members are Thailand, Indonesia and Malaysia. ITRC was established in 2001 after the termination of INRO. Main objective is to stabilize natural rubber prices which are very unstable and non- remunerative. International Rubber Consortium (IRCo), an entity registered in Bangkok owned by The Government Of Thailand (owned 44. 44%), Indonesia (33. 33%) & Malaysian (22. 22%). The main objective is to stabilize rubber prices through the implementation of Agreed Export Tonnage Scheme (AETS), Supply Management Scheme (SMS) and Demand Promotion Scheme (DPS) as well as tapping holidays. 1992 - Asean Rubber Business Council (ARBC) – members are from rubber trade associations of Thailand, Indonesia, Malaysia, Singapore, Vietnam & Cambodia. ARBC members product and traded about 80% of world rubber markets.
 –")
INTERNATIONAL, REGIONAL & LOCAL RUBBER ORGANISATIONS: DOMESTIC: 1998 - Malaysian Rubber Board (MRB) – merges of Malaysian Rubber Research Development Board (MRRDB – 1974 ), Malaysian Rubber Exchange & Licensing Board (MRELB- 1962 ) and Rubber Research Institute of Malaysian (RRIM – 1925 ) & Tun Abdul Razak Research Centre (TARRC - 1938) London. 2000 - Malaysian Rubber Export Promotion Council (MREPC) 1952 -1953 - Rubber Industry Smallholders Development Authority (RISDA) 1975 - National Association of Smallholders (NASH) 1966 - Federal Land Consolidation & Rehabilitation Authority (FELCRA) 1931 - Malaysian Estate Owners’ Association (MEOA) 1954 - Federal of Rubber Trade Associations of Malaysia (FRTAM) 1995 - Malaysian Rubber Processors Association (SMR & Latex Processors) 1955 - Federal Land Development Authority (FELDA) 1964 - Malaysian Rubber Development Corporation (MARDEC) 1989 - Malaysian Rubber Gloves Manufacturers Association (MRGMA) 1977 - Malaysian Rubber Product Manufacturers Association (MRPMA)
 New")
RUBBER FUTURES MARKET: London - By Rubber Trade Association of London ( stopped) New York – New Rubber Future (stopped) The Rubber Trade Association of Singapore / Singapore Commodity Exchange (SICOM)/ SGX ** 1962 - Malaysian Rubber Exchange/KLCE/Bursa (not active) Tokyo Commodities Exchange (TOCOM) – Active ** Shanghai Futures Exchange (SHFE) - Active and speculative ** Thailand Exchange (not active) Indonesia Commodity Exchange (not active) Note: The most active futures market is SHFE and is too speculative that influence the rubber market sentiments, together with TOCOM & SGX (Singapore Exchange) are the benchmark prices for rubber physical markets.
 NR & SR PRODUCTION")
(A) NR & SR PRODUCTION
 RANKING 1988 COUNTRY TONNES PERCENTAGE 2019")
WORLD NR PRODUCTION, 1988 & 2019 ('000 TONNES) RANKING 1988 COUNTRY TONNES PERCENTAGE 2019 COUNTRY TONNES PERCENTAGE 1 Malaysia 1, 661. 6 33. 1% Thailand 4, 900. 0 35. 8% 2 Indonesia 1, 235. 0 24. 6% Indonesia 3, 100. 0 22. 6% 3 Thailand 978. 9 19. 5% Vietnam 1, 222. 0 8. 9% 4 India 254. 8 5. 1% Cote d'Ivoire 808. 0 5. 9% 5 China 239. 8 4. 8% China 773. 5 5. 6% 6 Sri Lanka 122. 4% India 702. 0 5. 1% 7 Liberia 108. 4 2. 2% Malaysia 639. 8 4. 7% 8 Nigeria 80. 5 1. 6% Myanmar 292. 7 2. 1% 9 Cote d' Ivoire 61. 0 1. 2% Cambodia 287. 6 2. 1% 10 Vietnam 60. 0 1. 2% Brazil 187. 0 1. 4% 11 Others 217. 6 4. 3% Others 782. 4 5. 7% 13, 695. 0 100. 0% WORLD GRAND TOTAL 5, 020. 0 Source: IRSG 100. 0%
 1988 Rank Country 2019 Tonnes %")
WORLD SR PRODUCTION, 1988 & 2019 ('000 TONNES) 1988 Rank Country 2019 Tonnes % Country Tonnes % 1 Russian Federation 2, 435 23. 8 China 3, 148 21. 0 2 USA 2, 335 22. 9 USA 2, 177 14. 5 3 Japan 1, 299 12. 7 South Korea 1, 565 10. 4 4 France 568 5. 6 Russian Federation 1, 538 10. 3 5 Germany 500 4. 9 Japan 1, 531 10. 2 6 UK 313 3. 1 Germany 788 5. 3 7 Brazil 284 2. 8 Taiwan 772 5. 2 8 Italy 260 2. 5 France 467 3. 1 9 China 251 2. 5 India 391 2. 6 10 Canada 197 1. 9 Thailand 310 2. 1 1, 768 17. 3 Others 2, 303 15. 4 10, 210 100 Total 14, 991 100 Others Total Source: IRSG
 NR & SR CONSUMPTION")
(B) NR & SR CONSUMPTION
 1988 Rank Country 2019 Tonnes %")
WORLD NR CONSUMPTION, 1988 & 2019 ('000 TONNES) 1988 Rank Country 2019 Tonnes % Country Tonnes % 1 USA 858 16. 9 China 5, 497 40. 3 2 China 660 13. 0 India 1, 144 8. 4 3 Japan 623 12. 3 USA 1, 006 7. 4 4 India 311 6. 1 Thailand 800 5. 9 5 Korea 235 4. 6 Japan 714 5. 2 6 Germany 204 4. 0 Indonesia 625 4. 6 7 France 181 3. 6 Malaysia 501 3. 7 8 Taiwan 150 3. 0 Brazil 400 2. 9 9 Italy 140 2. 8 South Korea 354 2. 6 10 UK 140 2. 8 Vietnam 230 1. 7 Others 1, 568 30. 9 Others 2, 355 17. 3 Total 5, 070 100 Total 13, 626 100 Source: IRSG
 1988 Rank Country 2019 Tonnes %")
WORLD SR CONSUMPTION, 1988 & 2019 ('000 TONNES) 1988 Rank Country 2019 Tonnes % Country Tonnes % 1 Russian Federation 2, 204 22. 1 China 4, 395 29. 0 2 USA 2, 017 20. 2 USA 1, 829 12. 1 3 Japan 1, 042 10. 4 Japan 839 5. 5 4 Germany 471 4. 7 India 659 4. 3 5 France 315 3. 2 Russian Federation 643 4. 2 6 Italy 312 3. 1 Thailand 618 4. 1 7 China 290 2. 9 Malaysia 574 3. 8 8 Brazil 283 2. 8 Germany 560 3. 7 9 South Korea 255 2. 6 Brazil 420 2. 8 10 UK 226 2. 3 Taiwan 380 2. 5 Others 2, 575 25. 8 Others 4, 231 27. 9 Total 9, 990 100 Total 15, 149 100 Source: IRSG
 MALAYSIA NR STATISTICS")
(C) MALAYSIA NR STATISTICS
 Year Estate Smallholding Malaysia 1988 481,")
Malaysia's Natural Rubber Production By Sector Production (Tonnes) Year Estate Smallholding Malaysia 1988 481, 071 1, 180, 480 1, 661, 551 2019 61, 227 578, 603 639, 830 Source: DOSM Malaysia's Natural Rubber Stock Year Tonnes 1988 286, 475 2019 244, 930 Source: DOSM

Planted Hectarage Of Rubber Year Hectares 1988 1, 865, 771 2019 1, 083, 992 Source: LGM Malaysia’s Latex Production Year Tonnes 1988 380, 768 2019 36, 193 Source: DOSM

Malaysia Exports of NR by Countries 1988 Rank Country 2019 Tonnes % Country 1 South Korea 167, 305 10. 8 China 2 Singapore 152, 870 9. 8 3 USA 135, 195 4 China 5 Tonnes % 711, 767 68. 9 Germany 71, 080 6. 9 8. 7 Finland 27, 317 2. 6 112488 7. 2 Iran 27, 296 2. 6 Japan 95, 680 6. 2 USA 25, 028 2. 4 6 Germany 94, 509 6. 1 India 17, 518 1. 7 7 Italy 80, 407 5. 2 Brazil 14, 033 1. 4 8 UK 74, 164 4. 8 Turkey 13, 632 1. 3 9 Taiwan 69, 187 4. 5 South Korea 12, 205 1. 2 Brazil 60, 353 3. 9 Taiwan 12, 097 1. 2 Others 510, 943 32. 9 Others 101, 740 9. 8 1, 553, 101 100 Total 1, 033, 712 100 10 Total Source: DOSM

Malaysia NR Latex Statistics for 1988 & 2019 Year 1988 2019 Source: DOSM Tonnes Production 380, 768 36, 193 Imports n. a 312, 006 Exports Consumption 301, 663 61, 503 23, 188 434, 914

NR Imports by Grades Tonnes 1988 2019 n. a 47, 134 n. a 312, 006 n. a 226, 202 n. a 497, 358 53, 582 1, 082, 700 Grades Ribbed Smoked Sheets Latex Concentrate Standard Rubber Other Types Total NR Imports by Countries 1988 Rank 1 2 3 Country Tonnes 2019 % Country Tonnes % Thailand Cote D'Ivoire Philippines Viet Nam Myanmar Others Total 486, 099 332, 955 111, 074 42, 392 37, 661 72, 518 1, 082, 700 44. 9 30. 8 10. 3 3. 9 3. 5 6. 7 100 Thailand Myanmar Indonesia 12, 368 12, 118 7, 562 23. 1 22. 6 14. 1 Others Total 21, 534 53, 582 40. 2 100 4 5 Source: DOSM
 Year 1988 2019 Source: DOSM Tyres")
NR Consumption by Types of Rubber Products (Tonnes) Year 1988 2019 Source: DOSM Tyres & Rubber Footwear Tubes Bands 29, 859 35, 386 5, 175 559 3, 751 2, 311 Rubber Sheeting 3, 595 5, 171 Rubber Gloves 31, 945 391, 007 Others 29, 127 81, 032 Total 103, 452 515, 466
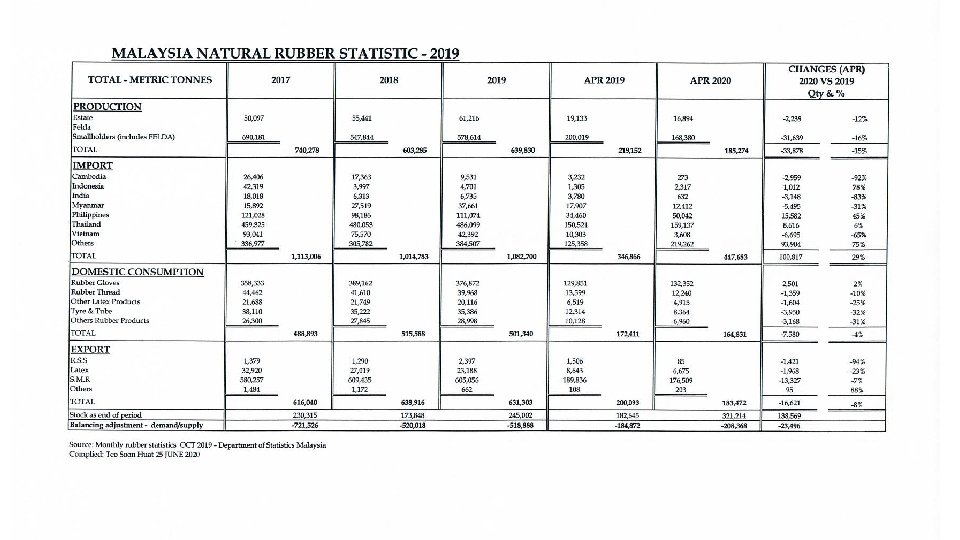
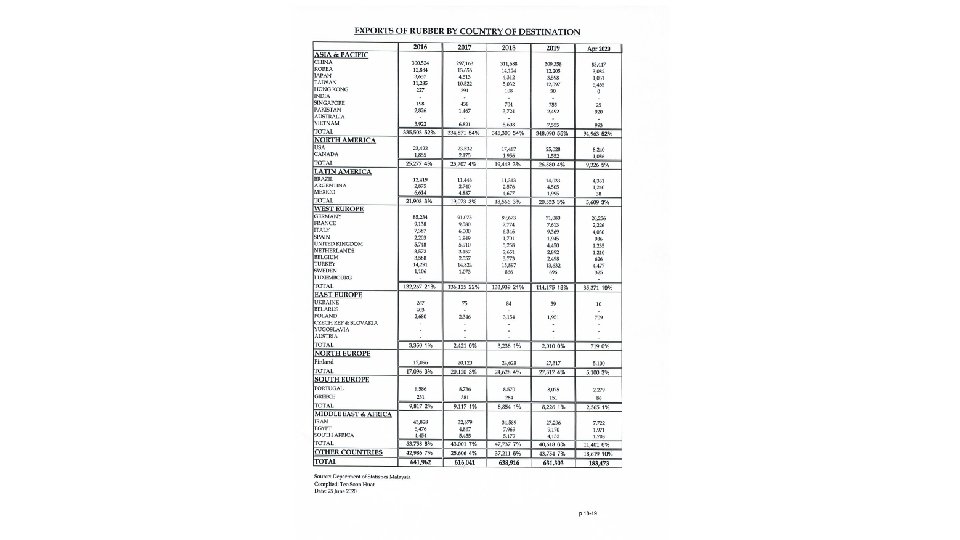
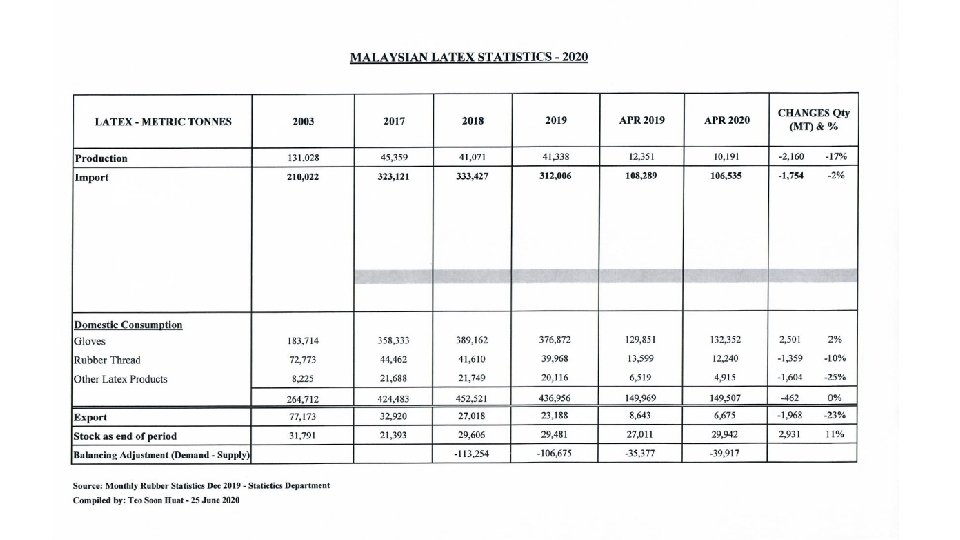
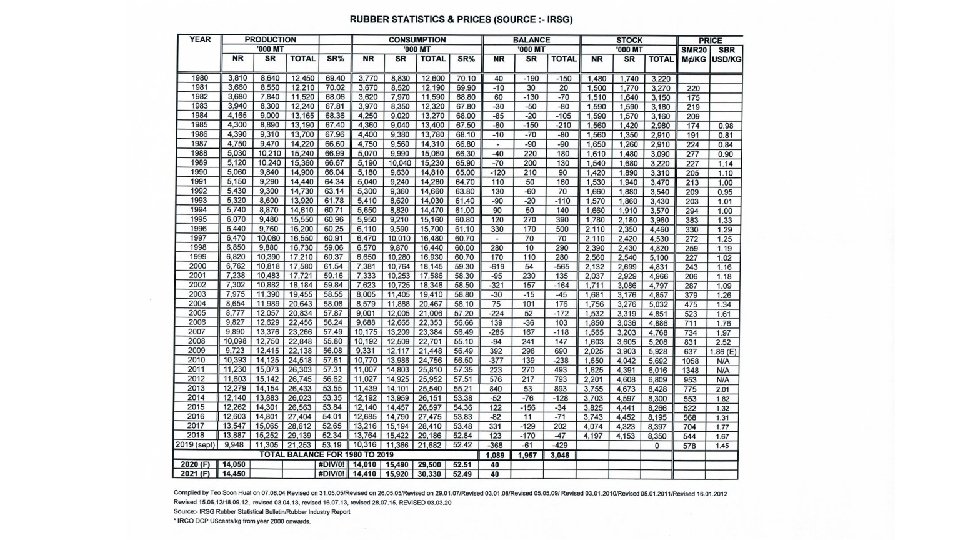

TABLE 1. SUMMARY OF WORLD NR PRODUCTION, CONSUMPTION, BALANCE, STOCK AND PRICES FROM 20002018 Year Production (‘ 000 MT) Consumption (‘ 000 MT) Balance (‘ 000 MT) Stock (‘ 000 MT) 1 NR Price (DCP) (Us Cents/kg) SR price (SBR 1502) (Us Cents/kg) 2000 6, 762 7, 381 -619 1, 941 64. 35 81. 35 2001 7, 238 7, 333 -95 1, 846 54. 01 76. 42 2002 7, 302 7, 623 -321 1, 525 75. 49 77. 96 2003 7, 975 8, 005 -30 1, 495 102. 02 101. 75 2004 8, 654 8, 579 75 1, 570 123. 35 133. 69 2005 8, 777 9, 001 -224 1, 346 142. 27 149. 79 2006 9, 827 9, 688 139 1, 485 200. 69 161. 38 2007 9, 890 10, 175 -285 1, 200 222. 26 177. 96 2008 10, 098 10, 192 -94 1, 106 256. 75 240. 00 2009 9, 723 9, 331 392 1, 498 186. 20 151. 33 2010 10, 393 10, 770 -377 1, 121 346. 91 225. 33 2011 11, 239 11, 034 205 1, 326 462. 60 368. 13 2012 11, 658 11, 046 612 1, 938 325. 40 279. 58 2013 12, 282 11, 430 852 2, 790 260. 38 198. 54 2014 12, 142 12, 181 -39 2, 751 191. 84 186. 34 2015 12, 264 12, 134 130 2, 881 144. 75 130. 31 2016 12, 604 12, 670 -66 2, 815 146. 70 144. 48 2017 13, 551 13, 203 348 3, 163 178. 98 192. 18 2018 13, 869 13, 813 56 3, 219 140. 28 173. 16 Note: 1 Calculated from the ending stock plus/minus balance e. g. stock as at end 2018 = 3. 163 + 0. 056 = 3. 219 million MT Source : International Rubber Study Group (IRSG), compiled by International Rubber Consortium Limited (IRCo) on 31 may 2019

TABLE 2. ACTUAL NR PRODUCTION BY COUNTRY FROM 2000 - 2018 UNIT : (000 MT) Year Thailand Indonesia Malaysia Vietnam China India Cote D’Ivoire CAMAL 1 Others Total World 2000 1, 346 1, 501 928 291 445 629 123 74 425 6, 762 2001 2, 320 1, 607 882 313 478 632 128 75 804 7, 238 2002 2, 615 1, 630 890 331 527 641 120 78 470 7, 302 2003 2, 876 1, 792 986 364 565 707 127 81 478 7, 975 2004 2, 984 2, 066 1, 169 419 573 743 142 91 478 8, 654 2005 2, 937 2, 271 1, 126 469 510 772 165 85 443 8, 777 2006 3, 137 2, 637 1, 284 554 533 853 178 105 547 9, 827 2007 3, 056 2, 755 1, 200 606 590 811 183 122 734 10, 057 2008 3, 090 2, 751 1, 075 660 560 881 194 134 756 10, 098 2009 3, 164 2, 440 857 711 644 820 203 151 733 9, 723 2010 3, 252 2, 736 939 752 687 851 232 168 776 10, 393 2011 3, 569 2, 990 996 789 727 893 234 210 831 11, 239 2012 3, 778 3, 012 923 877 802 919 254 250 844 11, 658 2013 4, 170 3, 237 827 949 865 796 289 304 845 12, 282 2014 4, 324 3, 153 669 954 840 705 317 353 827 12, 142 2015 4, 473 3, 145 722 1, 013 794 575 351 405 786 12, 264 2016 4, 519 3, 298 674 1, 035 774 624 468 446 766 12, 604 2017 4, 775 3, 499 741 1, 094 798 713 604 512 806 13, 551 2018 5, 145 3, 486 603 1, 110 811 649 624 529 912 13, 869 Note: 1 CAMAL : Cambodia, Laos and Myanmar Source : IRSG, Rubber Statistics Bulletin (1 Q 19), compiled by IRCo on 31 May 2019
")
TABLE 3. NR CONSUMPTION BY COUNTRY FROM 2000 - 2018 UNIT : (000 MT) Year China U. S. A. EU 28 India Japan Korea Thailand Indonesia Malaysia Other World 2000 1, 080 1, 195 1, 260 638 752 332 243 139 364 1, 329 7, 330 2001 1, 330 974 1, 260 631 729 332 253 142 401 978 7, 030 2002 1, 395 1, 111 1, 182 680 749 326 278 145 408 1, 278 7, 552 2003 1, 525 1, 079 1, 309 717 784 333 299 156 421 1, 322 7, 944 2004 2, 000 1, 144 1, 291 745 815 352 319 196 403 1, 453 8, 716 2005 2, 275 1, 159 1, 347 789 857 370 335 221 387 1, 466 9, 206 2006 2, 769 1, 003 1, 338 815 874 364 321 355 383 1, 438 9, 660 2007 2, 843 1, 018 1, 397 851 887 374 391 468 1, 555 10, 158 2008 2, 947 1, 041 1, 257 881 878 358 398 414 493 1, 526 10, 192 2009 3, 306 687 860 905 636 330 399 352 470 1, 344 9, 289 2010 3, 655 926 1, 136 944 749 384 487 421 458 1, 632 10, 792 2011 3, 638 1, 029 1, 242 957 772 402 487 460 402 1, 645 11, 034 2012 3, 890 950 1, 076 988 728 396 505 465 441 1, 607 11, 046 2013 4, 270 913 1, 060 962 710 396 521 509 434 1, 655 11, 430 2014 4, 804 932 1, 139 1, 015 709 402 541 540 447 1, 652 12, 181 2015 4, 680 937 1, 159 987 961 388 601 509 475 1, 707 12, 134 2016 4, 982 932 1, 186 1, 034 676 381 650 583 486 1, 760 12, 670 2017 5, 301 958 1, 236 1, 082 679 384 685 608 489 1, 796 13, 203 2018 5, 504 1, 012 1, 241 1, 220 706 367 752 625 515 1, 871 13, 813 Source : IRSG, Rubber Statistics Bulletin (1 Q 19), compiled by IRCo on 31 May 2019

TABLE 4. NR CONSUMPTION SHARE BY COUNTY FROM 2000 - 2018 Year China U. S. A. EU 28 India Japan Korea Thailand Indonesia Malaysia TIM World 2000 14. 7% 16. 3% 17. 2% 8. 7% 10. 3% 4. 5% 3. 3% 1. 9% 5. 0% 10. 2% 18. 1% 2001 18. 9% 13. 9% 17. 9% 9. 0% 10. 4% 4. 7% 3. 6% 2. 0% 5. 7% 11. 3% 13. 9% 2002 18. 5% 14. 7% 15. 7% 9. 0% 9. 9% 4. 3% 3. 7% 1. 9% 5. 4% 11. 0% 16. 9% 2003 19. 2% 13. 6% 16. 5% 9. 0% 9. 9% 4. 2% 3. 8% 2. 0% 5. 3% 11. 0% 16. 6% 2004 22. 9% 13. 1% 14. 8% 8. 6% 9. 3% 4. 0% 3. 7% 2. 2% 4. 6% 10. 5% 16. 7% 2005 24. 7% 12. 6% 14. 6% 8. 6% 9. 3% 4. 0% 3. 6% 2. 4% 4. 2% 10. 2% 15. 9% 2006 28. 7% 10. 4% 13. 8% 8. 4% 9. 0% 3. 8% 3. 3% 3. 7% 4. 0% 11. 0% 14. 9% 2007 28. 0% 10. 0% 13. 7% 8. 4% 8. 7% 3. 8% 4. 6% 12. 1% 15. 3% 2008 28. 9% 10. 2% 12. 3% 8. 6% 3. 5% 3. 9% 4. 1% 4. 8% 12. 8% 15. 0% 2009 35. 6% 7. 4% 9. 3% 9. 7% 6. 8% 3. 6% 4. 3% 3. 8% 5. 1% 13. 1% 14. 5% 2010 33. 9% 8. 6% 10. 5% 8. 8% 6. 8% 3. 6% 4. 5% 3. 9% 4. 2% 12. 7% 15. 1% 2011 33. 0% 9. 3% 11. 3% 8. 7% 7. 0% 3. 6% 4. 4% 4. 2% 3. 6% 12. 2% 14. 9% 2012 35. 2% 8. 6% 9. 7% 8. 9% 6. 6% 3. 6% 4. 2% 4. 0% 12. 8% 14. 5% 2013 37. 4% 8. 0% 9. 3% 8. 4% 6. 2% 3. 5% 4. 6% 4. 5% 3. 8% 12. 8% 14. 5% 2014 39. 4% 7. 7% 9. 4% 8. 3% 5. 8% 3. 3% 4. 4% 3. 7% 12. 5% 13. 6% 2015 38. 6% 7. 7% 9. 6% 8. 1% 5. 7% 3. 2% 5. 0% 4. 2% 3. 9% 13. 1% 14. 1% 2016 39. 3% 7. 4% 9. 4% 8. 2% 5. 3% 3. 0% 5. 1% 4. 6% 3. 8% 13. 6% 13. 9% 2017 40. 1% 7. 3% 9. 3% 8. 2% 5. 1% 2. 9% 5. 2% 4. 6% 3. 7% 13. 5% 13. 6% 2018 39. 8% 7. 3% 9. 0% 8. 8% 5. 1% 2. 7% 5. 4% 4. 5% 3. 7% 13. 5% Source : IRSG, Rubber Statistics Bulletin (1 Q 19), compiled by IRCo on 31 May 2019

TABLE 5. TOTAL NR PLANTATION AREAS IN ANRPC MEMBER COUNTRIES FROM 2005 - 2018 Year Thailand Indonesia Malaysia India Vietnam China CAMAL Sri Lanka Philippines TOTAL 2005 2, 190 3, 282 1, 271 598 483 727 301 116 82 9050 2006 2, 297 3, 345 1, 264 615 522 770 391 118 94 9, 417 2007 2, 832 3, 414 1, 248 635 556 818 524 120 111 10, 258 2008 2, 985 3, 424 1, 247 662 632 850 636 122 123 10, 681 2009 3, 136 3, 435 1, 028 687 678 873 736 124 128 10, 825 2010 2, 895 3, 445 1, 020 712 749 919 850 126 139 10, 855 2011 3, 205 3, 456 1, 027 735 802 965 931 128 162 11, 411 2012 3, 374 3, 506 1, 041 758 918 1, 070 1, 046 131 176 12, 020 2013 3, 554 3, 556 1, 059 778 959 1, 130 1, 134 186 12, 490 2014 3, 658 3, 606 1, 069 795 979 1, 143 1, 200 136 218 12, 804 2015 3, 703 3, 621 1, 074 811 986 1, 161 1, 245 136 223 12, 960 2016 3, 669 3, 639 1, 078 818 974 1, 160 1, 297 136 223 12, 994 2017 3, 628 3, 659 1, 082 821 970 1, 178 1, 307 137 226 13, 008 2018 3, 614 3, 679 1, 084 825 965 1, 176 1, 307 137 226 13, 013 Note: 1 CAMAL : Cambodia, Laos and Myanmar Source : ANRPC NR Statistics and Trends in February 2019, compiled by IRCo on 31 May 2019

TABLE 6. ANNUAL AVERAGE YIELD IN ANRPC MEMBER COUNTRIES FROM 2007 - 2018 Year Cambodia China India Indonesia Malaysia Philippines Sri Lanka Thailand Vietnam 2007 1082 1168 1767 993 1420 1567 1247 1723 1630 2008 1082 1053 1903 994 1430 1581 1381 1561 1654 2009 1097 1187 1751 901 1450 1574 1438 1540 1689 2010 1099 1180 1783 986 1480 1420 1936 1495 1712 2011 1137 1174 1818 1095 1500 1284 2026 1529 1716 2012 1166 1232 1823 1073 1462 1324 1919 1413 1720 2013 1086 1261 1675 1082 1400 1121 1645 1499 1728 2014 1069 1208 1576 1052 1370 942 1182 1488 1696 2015 1140 1117 1471 1036 1410 851 978 1493 1676 2016 1143 1075 1402 1104 1410 694 817 1394 1666 2017 1136 1118 1498 12025 1420 700 809 1440 1676 2018 1090 1094 1469 1161 1450 700 774 1568 1684 Source : IRSG, Rubber Statistics Bulletin (1 Q 19), compiled by IRCo on 31 May 2019
 NR PRICE (SMR 20 & LATEX)")
(D) NR PRICE (SMR 20 & LATEX)

2010 -2011: 2018: • World supply deficit of 356, 000 mt in 2010 • U. S-China trade • Positive growth in China’s automobile industry wars • Crude oil surpassed USD 100/ barrel • Surging China • SMR 20 hits new historical high of 1717. 00 sen/kg on 18 Feb rubber stocks 2011 • Slumping global • 11 Mar 2011 – Earthquake and Tsunami hit Japan, triggered 2003 -2008 equity and financial 2013 - 2015: panic of selling markets • Shortages supply • Slowing global economic • Slower China • Strong demand from tyre growth economic growth manufacturers • Global NR surplus of • Speculative in rubber futures 852, 000 mt in 2013 2017: • 26 Dec 2004 – Tsunami hit • Slumping oil prices • Jan 2017 Thailand, Indonesia and • Rising China NR stocks Tight supply Global political Malaysia • Declining vehicles sales in due to Thailand instability • 3 July 2008 - Crude oil price 2016: China floods Indochina war peaked at USD 143/ barrel. • Oil price declined to • Export cuts by 1994 -1995: Tight rubber supply USD 26/barrel on 11 ITRC (AETS) • Declining NR 1984 -1985: OPEC raises oil price Feb supply in to USD 41 per barrel • World oil glut 2001: • Surging China NR Thailand • INRO • 12 Dec. Stocks Indonesia intervention Thailand, 1975: • Recovery of auto builds up Indonesia and • Worsening 1981 -1982: and tyre 370, 000 - tonne 2019 Malaysia (TIM) world industries • Globalbuffer economy stock • Supply disruption due to outbreak formed economy • China buys NR recession of fungal disease, rainy season International • Declining • INRO makes first in big way and export cutbacks under the Tripartite car and following US buffer stock 6 th. AETS Rubber Council tyre sales purchases renewal of its • Declining China’s NR stocks (ITRC) 1998: MFN status 1992: • Currency and economic crises in • Easing trade tension between U. S and China • Weak industrial economies Asia Feb 1972: • Slumping China’s auto sales • Dismal auto and tyre sales • Excess NR supply SMR grades quotations • Oversupply of global NR • Malaysia pegs the ringgit to the US • Weaker China Q 3 GDP (6%) and started. dollar manufacturing activity. . 1986 -1988: • Shortage of NR • INRO makes first sale from stockpile • Tension in Persian Gulf • Slump in world stock markets • Strong demand from tyre and automotive industries in Europe, Japan and U. S • Improving world economy • Rising oil prices • AIDS epidemic 1976 -1980: • • Source: Malaysian Rubber Board

Source: Malaysian Rubber Board Note: Latex in Bulk Prices started in 1998.

TERIMA KASIH THANK YOU
- Slides: 38