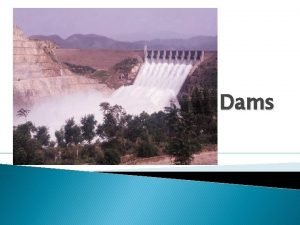
Development as Displacement The case of Large Dams


- Slides: 21

Development as Displacement The case of Large Dams September 2006

Advocacy for large hydro • There is strong push for large hydro projects today, as if large hydro projects are good in themselves. • In fact installed capacity of large hydro has increased at a compound growth rate of 4. 35% per annum during 1991 -2005, HIGHER than all other power subsectors. • There is little attempt for credible assessment of performance of large hydro. How have they performed?

Diminishing Returns from Large Hydro • As can be seen from the chart here, the Million Units energy generated from large hydro projects has been almost continuously falling over the last eleven years. • The fall from 1994 -5 to 2005 -6 is huge 20%. • There are many reasons for this, use of increasing large hydro to provide peaking capacity is surely not one of them to the best of our information.

Monsoon was above normal in majority of these years Year Monsoon Rainfall 1994 110 % 1995 100 % 1996 103 % 1997 102 % 1998 105 % 1999 96 % 2000 92 % 2001 91 % 2002 81 % 2003 105 % 2004 87 % 2005 99 %

Idle Reservoir Capacity during 1994 -2005 Sr No Year (Country wide monsoon rainfall) No of reservoirs monitored Monitored capacity Capacity filled up Idle Capacity 1 1994 (110%) 63 125. 14 112. 63 12. 51 2 1995 (100%) 63 125. 14 98. 44 26. 7 3 1996 (103%) 63 125. 14 89. 53 35. 61 4 1997 (102%) 68 129. 4 101. 2 28. 2 5 1998 (105%) 70 130. 6 106. 1 24. 5 6 1999 (96%) 70 130. 6 97. 6 33. 0 7 2000 (92%) 70 130. 6 82. 66 47. 94 8 2001 (91%) 70 130. 6 87. 49 43. 11 9 2002 (81%) 70 130. 6 69. 25 61. 35 10 2003 (105%) 71 131. 28 78. 76 52. 52 11 2004 (87%) 71 131. 28 85. 1 46. 18 12 2005 (99%) 76 133. 021 109. 695 23. 326

Implications of empty storage capacity • On an average, each year about 36. 25 BCM (equivalent of 6. 5 Sardar Sarovar Projects) of storage capacity out of only the monitored storage capacity is not filled up for the last 12 years. • That means that on an average an investment of Rs 37793 crores has remained idle in each of the last 12 years. • This happens when in 7 of the 12 years the rainfall was average or above. (See the figures in brackets in col. 2. ) • Should we not be trying to understand why this is happening? How we can make the existing storage capacity play the useful role it is supposed to, in stead of pushing for more storages? Note: This analysis needs to be done storage wise and river basin wise for all large storages. We could not do it as we could not get the required information.

High water storage in Reservoirs before the monsoon DAM Reservoir Capacity filled up before monsoon TAPI BASIN DAM Reservoir Capacity filled up before monsoon DAM MAHI BASIN Reservoir Capacity filled up before monsoon KRISHNA BASIN UKAI 21. 56% KADANA 40. 69% KOYNA 25. 19% GIRNA 10% PANAM 19. 37% KHADAKVASLA 12. 5% MAHI BAJAJ SAGAR 28. 17% NARAYANPUR 44. 15% SRISAILAM 17% NAGARJUNSAGAR 47. 08% NARMADA BASIN TAWA 22. 58% DAM RCapac ity filled before monsoo n GODAVARI BASIN JAYAKWADI 28. 33% SABARMATI BASIN DHAROI 42. 59%

But you do not expect the dams to be drained before the monsoon? • What if the monsoon fails? • Firstly, it is not proposed that all dams should be completely drained before monsoon. • However, it needs to be remembered that basic purpose of storages is to store the monsoon water for use in non monsoon months. So more water we have before the monsoon in the reservoirs, less useful it will be for storing monsoon water the next year. • If we want to keep the dams full of water before the monsoon than what is the purpose of creating the storage? • We need to have some norms as to how much water may be there in the reservoir before the monsoon, for the eventuality of monsoon failure. • We need to ask, Could we have used the water before the monsoon? [In case of Ukai, yes, we could have for Power. ]

When Ukai dam brought flood disaster for Surat

Water Storages are silting up fast • As per the report of NCIWRD (Govt of India, Sept 1999), about 1. 4 BCM of existing storage capacity is getting silted up every year. • At today’s rates creation of 1. 4 BCM storage capacity would cost Rs 1448 crores. • Our calculations, based on CWC reports of siltation for 27 dams, show the loss is at 1. 95 BCM per year. • That means that on an average, each day we are losing Rs 4 crores worth of storage capacity through siltation. • And there is little serious attempt to stop this. • The required Catchment Area Treatment for even Bhakra was not done. Same for other projects

Per Ha cost of irrigation for M&M and Minor Irrigation Projects (at Constant 1996 -97 PL, Planning Commission) Plan years Major and Medium Projects Minor Projects 1951 -56 1956 -61 1961 -66 34226 29053 31485 11733 37061 22821 1966 -69 1969 -74 1974 -78 1978 -80 1980 -85 1985 -90 1990 -92 1992 -97 1997 -2002 23476 41116 50686 63093 232306 126158 106442 161417 382910 25735 16739 18456 13909 17330 14991 13187 29935 33654

Per Ha cost of irrigated area over the years

Largest infrastructure, poorest performance? • India has the largest Irrigation Infrastructure in the world but it is performing far below its capacity. • Finance Minister Chidambaram said in his budget speech in Feb 2005, “Water-use efficiency in the Indian agriculture is one of the lowest in the world”. • The mid term appraisal of 9 th 5 Year Plan had noted, “With a 10% increase in the present level of water use efficiency, it is estimated, an additional 14 m ha can be brought under irrigation from existing irrigation facilities”. • The 14 m ha of additional irrigation is an agenda for over a decade at current rate of additional irrigation being created. • Why is there no serious attempt to make amends in this situation?

AIBP: No acceleration, little irrigation, littler benefit • In 10 years from 1996 -7 to 2005 -6, Rs 19440 crores disbursed to states under AIBP. • The funds locked up in incomplete projects were Rs 75 000 crores in 1996, it is Rs 180 000 crores today. • Almost all the allocations are violating the norms of AIBP, supposed to be for last mile projects. • SSP got the highest funding under AIBP, more than any other project in India and could not have been described as last mile project in 1996 or today. • The Mid term review of the 10 th plan noted, AIBP has not accomplished its intended objective of completion of irrigation projects. Out of 181 only 32 have been completed. • The CAG in its report in 2004 -5 has criticised the scheme in strongest terms. • The Water Resources Ministry has done no evaluation of the AIBP, nor has it got any independent evaluation done. • Now a GOM are sitting to further dilute the AIBP norms and in fact add new categories like National Projects and so on.

Bharat Nirman: New Avtaar of AIBP • Plans to add 1 crore ha irrigated area by 2009 • Mostly from large irrigation projects • The largest contribution from PM’s so called package for Vidarbha constituted of large irrigation projects • The agricultural economists and experts cry for more investments for agriculture, which basically means more large irrigation projects • But no body is asking questions about effectiveness of past irrigation projects • WB: Annual requirement for O&M of existing irrigation infrastructure: USD 4 Billion. That is almost equal to our annual total national budget on irrigation projects (including from states and centre budgets) and we allocating a tiny fraction for the same. • Lip service for rejuvenation of tanks, rainwater harvesting, groundwater recharge… little action.

Do we really believe in Democracy? • In whole of the planning and decision making cycle, people have no role. • The only role people had recently in the life cycle of a project has been in the public hearing. • That has also been largely hollow role as the EIA, the only basis that could provide an opportunity for informed participation of the people is not available in the language that people can use. • Now under the latest notification (dated Sept 14, 2006) from the MEF, that role is also being taken away. • And believe it or not the only people MEF thought worth consulting while formulating the new notification was the CII, FICCI and ASSOCHAM.

DEVELOPMENT? For Whom? At Whose Cost? • In 2000, the Planning Commission acknowledged that “ 25 million persons have been displaced since 1950 on account of development. Less than 50% have been rehabilitated – the rest pauperised by the development process”. • Years later when the Union Irrigation Minister KL Rao visited it he recorded “it is curious how we handle our projects. The village of Bhakra on the bank of the river Sutlez was submerged. The Dam resulted in great suffering to the people of the village, but nobody took note of the people’s representations. I found that the new village of Bhakra had neither drinking water nor electricity though surrounded by blazing brilliant lights. This was indeed unfair. • Pong, Bhakra, Hirakud, you name the dam and you will find that people affected there from are still fighting for R&R.

Pong oustees: Displaced in 1971 Yet to be resettled in Sept 2006

Is the Situation any different today? • Look at what is happening at Sardar Sarovar, Narmada Sagar, Polavaram, Karcham Wangtoo, Peddagedda…. • Ten days back, on Sept 10, when AP CM went to dedicate a relatively smaller irrigation project, Peddagedda dam in Vizianagaram district to the nation, the affected people were detained by the police as they wanted to protest before the CM.

Is there hope for the future? • JUST ONE EXAMPLE: • Report of the World Commission on Dams: The report was a result of an exercise in which majority of commissioners were supporters of large projects. This was the first ever and most transparent, open, inclusive process to assess the development effectiveness of large dams and it came out with a unanimous report in November 2000. The Report offers a framework for decision making process on Large projects and options. • There can be many ways for a better future, status quo is not one of them…. .

THANK YOU We publish Dams, Rivers and People • www. sandrp. in • cwaterp@vsnl. com September 2006
 Tasmanian dam case
 Single displacement vs double displacement
 Best worst and average case
 Advantages and disadvantages of dams
 Roma tre dams
 Rigid dam
 Types of dams
 Purdom power plant
 Tn dams
 Forces acting on earthen dam
 Dam
Dam Uses of dams
 Uplift force on dam
 Vertical gates in dams
 Nick dams
 Dams roma tre
 Where does the radial line development commonly used
 Hình ảnh bộ gõ cơ thể búng tay
 Slidetodoc
 Bổ thể
 Tỉ lệ cơ thể trẻ em
 Voi kéo gỗ như thế nào


