DEVELOPING A DASHBOARD FOR HHR Goal Better Manage

DEVELOPING A DASHBOARD FOR HHR Goal: Better Manage the Performance of HHR Agencies Consolidate and Track Critical Metrics Drill down to Regional Levels Visually Organize Data

Operational Overview By Each Agency Key metrics selected by Agencies Data gathered monthly / quarterly Performance reviewed quarterly

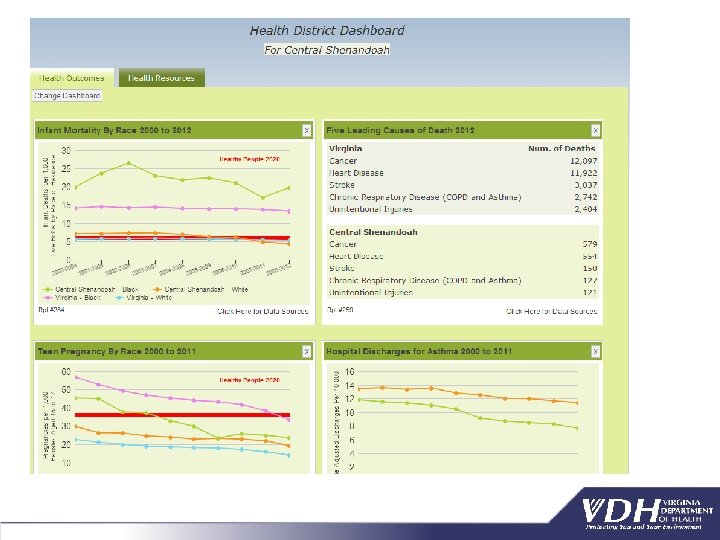
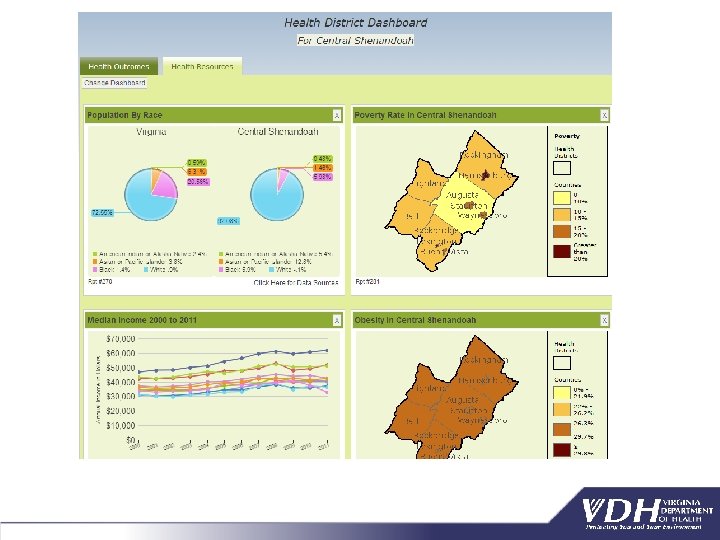
VDH District Dashboard • VDH Also Utilizes An Internal District Dashboard • Updated and Posted on HAN on a Monthly Basis • Contains 12 Core Metrics Initially Identified by Senior Leadership Screen Shot of Monthly Dashboard Front Page

VDH District Dashboard • Allows Leadership to Drill Down on Metrics to View District Performance Per Metric

VDH District Dashboard The green column demonstrates the progress VDH has observed since time it began monitoring each measure up until April 2013. Food/ Sewage Children & Families Immunization Health Baseline Current Trend District Cohort: Immunization Rates for Children 2 Years Old Served At 58% LHD 15% Entire Cohort in VIIS: Immunization Rates for Children 2 Years Old Percent of Children (Age 11 -17 Years) Adequately Immunized with Tdap 77% Vaccine Immunization Rates for Children at School Entry (Public and Private 77% Kindergartens) Number of Organizations Enrolled in VIIS 1720 Percent of Eligible Women of Childbearing Age Receiving Multivitamins 18% with Folic Acid Counseling Percent of Eligible Women of Childbearing Age Receiving a 100 -Day 16% Supply of Multivitamins with Folic Acid Percent of Eligibles Served in Plan First 3% Plan First Enrollment 8, 351 Percent of Risk Factors Discovered at Restaurant Inspection that are 44% Corrected at the Time of Inspection Percent of Risk Factors Discovered at Restaurant Inspection that are 44% Corrected Within 10 Days After Inspection Percent of Restaurant Inspections that are Conducted Within Required 55% Timeframes Percent of Failing Onsite Sewage Disposal Systems that are Corrected 16% Within 30 Days After LHD Is Notified Goal 60% 2. 1% 80% 26% 10. 9% 80% 87% 9. 8% 80% 81% 4. 1% - 2516 796 3000 31% 13. 1% 30% 22% 6. 2% 30% 11% 8. 5% 20% 37, 150 28, 799 24, 000 61% 17. 1% 70% 61% 17. 0% 73% 17. 9% 70% 22% 5. 6% 80%

Future Efforts – VDH is Working on Two New Systems 1. An Expanded Internal Dashboard Which Measures Progress by Core Agency Goals, Tying Together All Operational Metrics and Establish an Ongoing Review Process Example:

Future Efforts – VDH is Working on Two New Systems 2. A District Profile, which summarizes general data about the health of the district and some of it’s basic functions.
 -")
District Profile – Future Data Sources • Behavioral Risk Factor Surveillance System (BRFSS) - a state-based, random-digit dialed telephone survey that tracks the health behaviors, risk factors, and health status of non-institutionalized adults aged 18 and older in the United States • County Health Rankings • VEDSS • STD Surveillance • Outbreaks • Operational Data: Number of Clients Served, Number of Restaurants Inspected, Number of Immunizations Treated, etc.
- Slides: 10