Determining the Surgical Risk Stratification in Aortic Stenosis


 grossly over predicts risk and thus")


 Surgical AVR LES Predicted Observed Leontyev 33")


 in Algorithms • Data not collected or too")

![MELD = 3. 78[Ln serum bilirubin (mg/d. L)] + 11. 2[Ln INR] + 9.](https://slidetodoc.com/presentation_image_h/db52e961446919f3f3241f4074f43b35/image-24.jpg "MELD = 3. 78[Ln serum bilirubin (mg/d. L)] + 11. 2[Ln INR] + 9.")


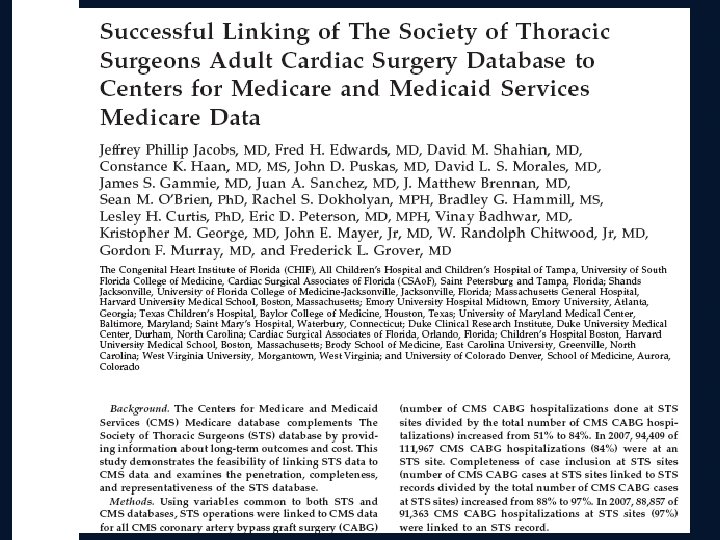

 Orlando, Florida November 4, 2010 Successful Linking of the")
 Number of Patients with")
 Number of Patients with")


- Slides: 42
Determining the Surgical Risk Stratification in Aortic Stenosis: STS, Euro. SCORE and “Frailty” Assessments Michael Mack, M. D. Baylor Healthcare System Dallas, TX February 27, 2011
Conflict of Interest Disclosure • No financial conflicts • Partner Trial Executive Committee- travel expenses paid by trial sponsor for committee meetings
The Journal of Thoracic and Cardiovascular Surgery January 2009
Aortic Valve Surgery Predictive Risk Algorithms • STS- Society of Thoracic Sureons • LES -Euro. SCORE (logistic) Euro. SCORE (additive) Ambler (UK) Northern New England New York State Providence Health System
Risk Algorithms Current Status • Risk algorithms are necessary to establish a baseline comparator to evaluate new therapy and to “adjust” outcomes reporting based on disease severity (clinical vs. administrative databases) • None is perfect but improvement is coming • All are based on Surgical AVR outcomes and therefore not able to be directly applicable to TAVR
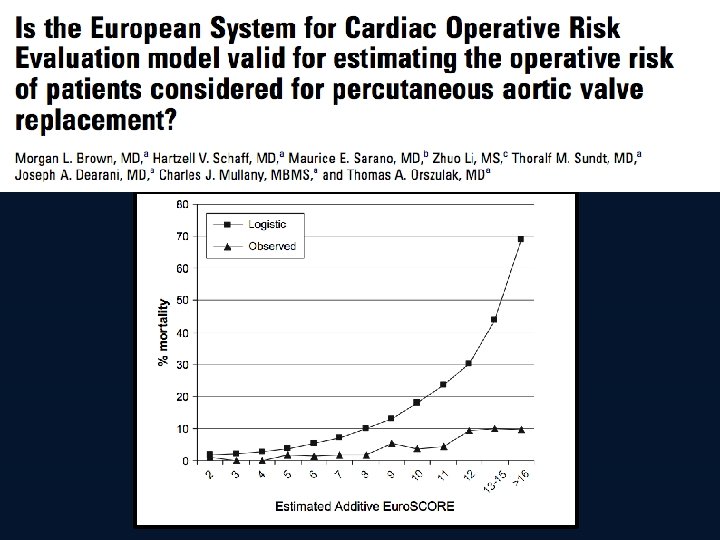
Risk Algorithms Current Status • Logistic Euroscore (LES) grossly over predicts risk and thus gives a false impression of benefit from TAVI • STS or LES/3 is the best available method of assessing risk and outcomes of TAVR
Why is STS More Accurate Than LES ?
STS Aortic Valve Risk Algorithm • • • Valves only- 2002 -2006 N= 67, 292 Aortic Valve Operations 60% Development Sample/40% Validation 24 covariates for mortality C-index 0. 799 for mortality
Risk Algorithms Population Analyzed Place Number Operations Type of Operations Covariates for Aortic Valve Mortality LES 1995 STS 2002 -2006 Europe (8 countries) 14, 799 US All cardiac Aortic Valve only 24 12 67, 292
LES Mean LES 30 day/ Hosp Mortality <10 10 -20 7. 3% 13. 7% 7. 5% 12. 6% > 20 33% 12. 5%
Logistic Euroscore in High Risk (LES >20) Surgical AVR LES Predicted Observed Leontyev 33 12. 5 Brown 23. 6 5. 8 Dewey 50. 8 15. 6 Wendt 28. 5 3. 9 Kalavrouziotis 38. 7% 11. 4% LES over predicts mortality in high risk AVR by 3 -7 X O/E Ratio = 0. 14 – 0. 35
• • • 4 Centers STS PROM > 10% 159 patients STS PROM = 16. 3% Observed Mortality = 16. 4% O/E Ratio =1 Ann. Thorac Surg 2010
Why Does It Matter Which One Is Used?
TAVI- Observed Mortality -30 Days Series Mortality Ye 16. 9 % SOURCE TF 6. 3 % SOURCE TA 10. 3 % Webb 11. 3 % Bleiziffer 11. 2 % Walther 8 % Thielman 17. 9 % FRANCE 12. 7 % ITALY 7. 2 % CANADIAN 10. 4 % BELGIUM 9 % UK 6. 9 %
TAVR- Observed Mortality -30 Days Series Mortality LES Ye 16. 9 % 34. 5 % SOURCE TF 6. 3 % 25. 8 % SOURCE TA 10. 3 % 29 % Webb 11. 3 % 28. 6 % Bleiziffer 11. 2 % 22. 4 % Walther 8 % 31. 5 % Thielman 17. 9 % 44. 2 % FRANCE 12. 7 % 25. 6 % ITALY 7. 2 % 22. 9% CANADIAN 10. 4 % BELGIUM 9 % 28 % UK 6. 9 % 21. 6 %
TAVR- Observed Mortality -30 Days Series Mortality STS Ye 16. 9 % 12. 1 % SOURCE TF 6. 3 % SOURCE TA 10. 3 % Webb 11. 3 % Bleiziffer 11. 2 % Walther 8 % 12 % Thielman 17. 9 % FRANCE 12. 7 % ITALY 7. 2 % CANADIAN 10. 4 % BELGIUM 9 % UK 6. 9 % 9. 1 % 9. 8 %
TAVI- Observed Mortality -30 Days Series Mortality LES/3 Ye 16. 9 % 11. 5 % SOURCE TF 6. 3 % 8. 6 % SOURCE TA 10. 3 % 9. 7 % Webb 11. 3 % 9. 5 % Bleiziffer 11. 2 % 7. 5 % Walther 8 % 10. 5 % Thielman 17. 9 % 14. 7 % FRANCE 12. 7 % 8. 5 % ITALY 7. 2 % 7. 6 % CANADIAN 10. 4 % BELGIUM 9 % 9. 3 % UK 6. 9 % 7. 2 %
• Publications -84 • Series-76 • Patients- 2, 375 Ann Intern Med Aug 2, 2010
TF 1, 804 TA 514 Ann Intern Med Aug 2, 2010
Ann Intern Med Aug 2, 2010
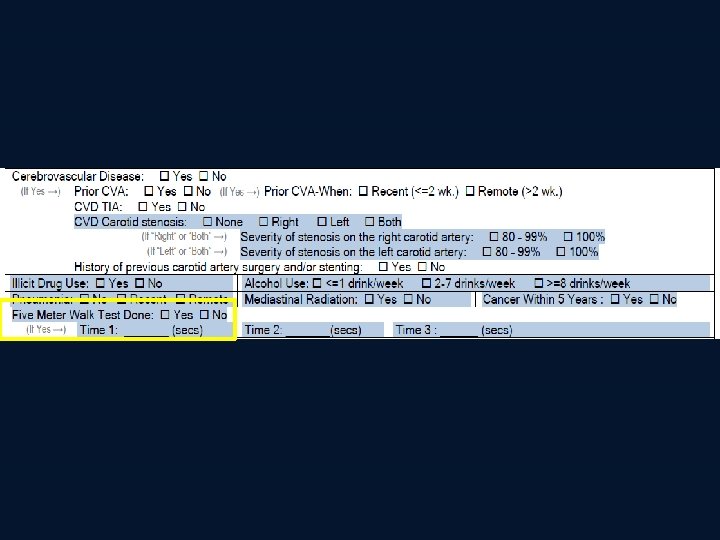
Risk Factors Not Included (Until Now) in Algorithms • Data not collected or too few patients with variables to validate – Liver disease – Porcelain aorta – Radiation – Dementia/Parkinson’s – Frailty
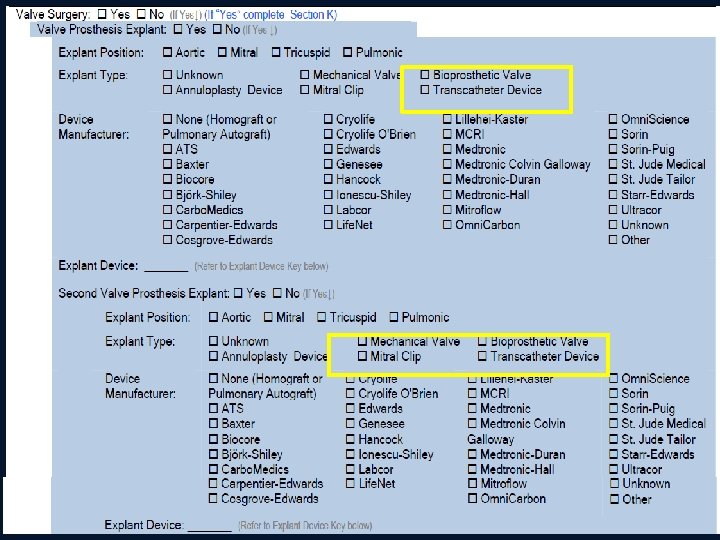
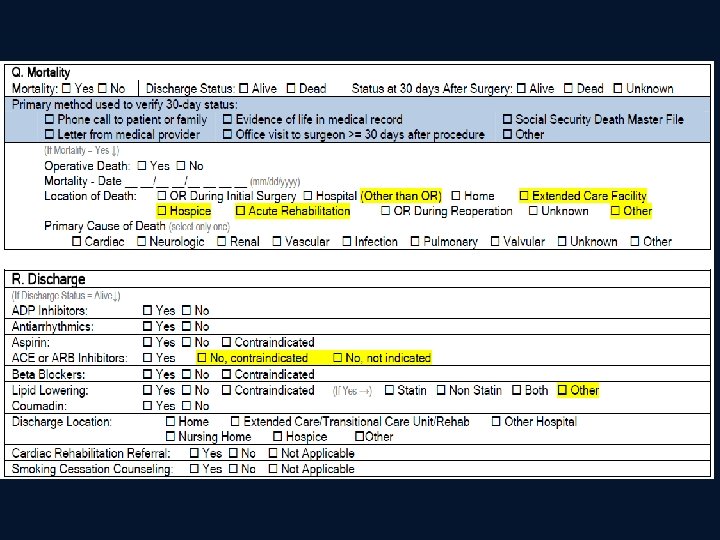
STS Adult Cardiac Database Version 2. 73 Spec Upgrade – New risk model variables • liver disease • frailty • radiation – Expanded CABG, valve, thoracic aorta, AF sections – Includes hybrid revascularization and transcatheter valves – Aborted or unplanned procedures – Align with national standards – Harmonize with ACC NCDR – Prepare for new reimbursement models (e. g. episode of care, ACOs, bundled payment)
MELD = 3. 78[Ln serum bilirubin (mg/d. L)] + 11. 2[Ln INR] + 9. 57[Ln serum creatinine (mg/d. L)] + 6. 43 (UNOS: assign creatinine 4 if dialyzed twice in last week, and convert numbers <1 to 1) Indicate whether the patient has a history of hepatitis B, hepatitis C, cirrhosis, portal hypertension, esophageal varices, chronic alcohol abuse or congestive hepatopathy.
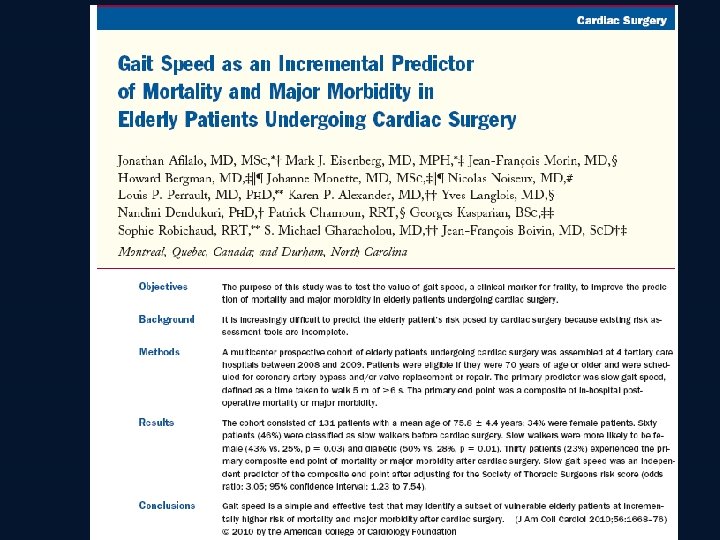
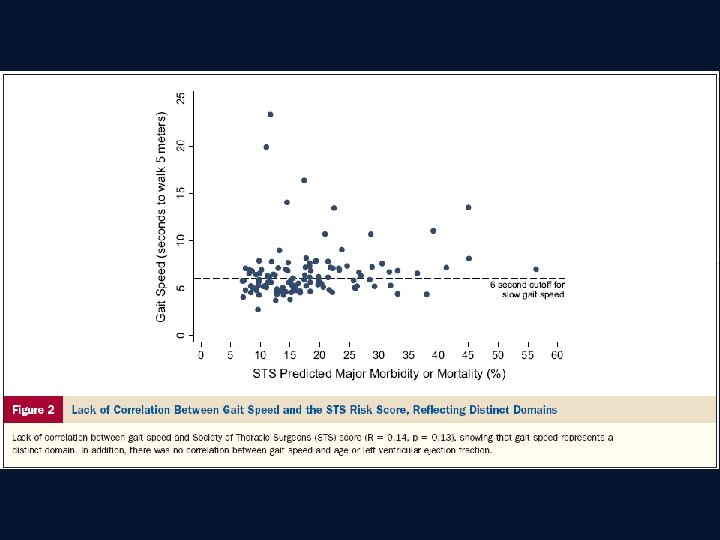
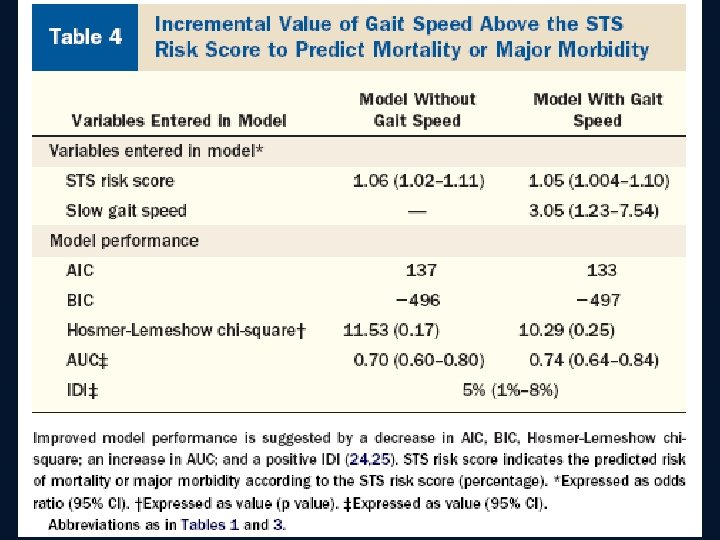
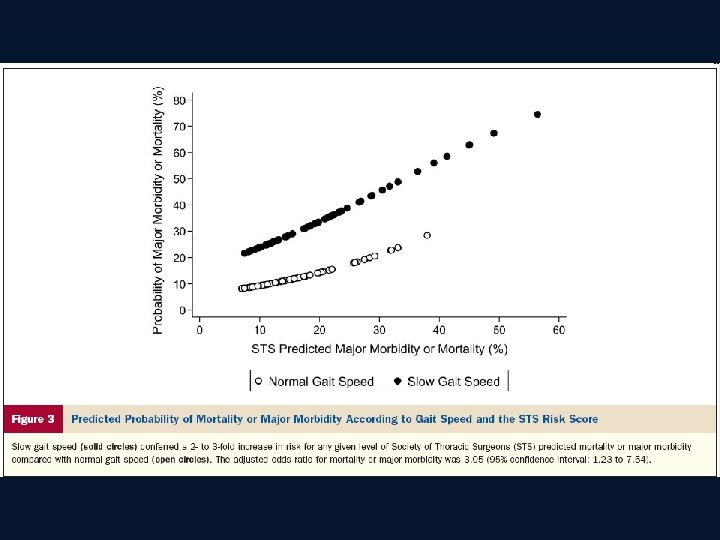
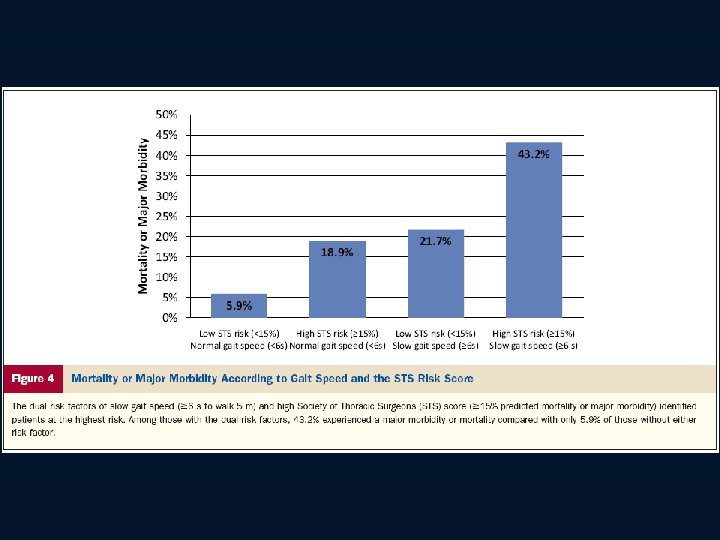
Are We Getting Any Better at Assessing “Frailty” ?
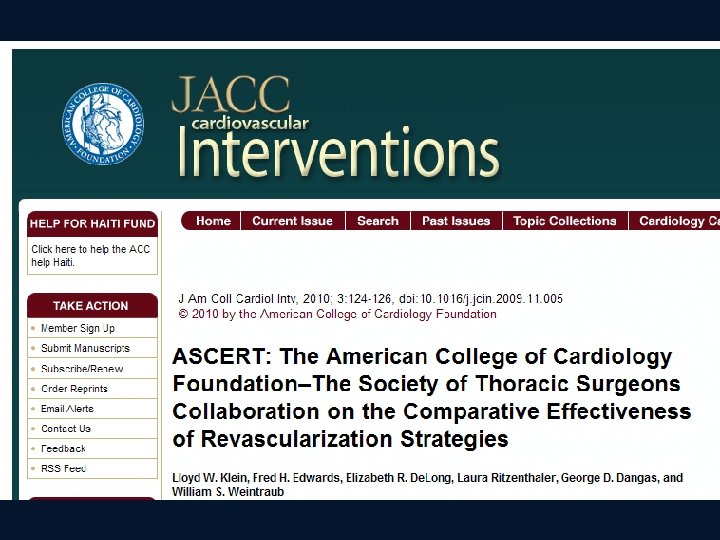
STS Database Linkage Activities • • • CMS SSDMF ACC: ASCERT Grant Brookings—Wellpoint grant PHIS
97% complete data at active STS sites
Southern Thoracic Surgical Association (STSA) Orlando, Florida November 4, 2010 Successful Linking of the STS Database to Social Security Data to Compare Survival at Hospital Discharge to the Survival at One Year after Cardiac Surgery Jeffrey Phillip Jacobs, MD, Fred H. Edwards, MD, David M. Shahian, MD, Richard L. Prager, MD, Cameron D. Wright, MD, John D. Puskas, MD, David L. S. Morales, MD. James S. Gammie, MD, Juan A. Sanchez, MD, Constance K. Haan, MD, MS, Vinay Badhwar, MD, Kristopher M. George, MD, Sean M. O’Brien, Ph. D, Rachel S. Dokholyan, MPH, Shubin Sheng, Eric D. Peterson, MD, MPH, Cynthia M. Shewan, Ph. D, Kelly M. Feehan, JD, Jane M. Han, MSW, Marshall Lewis Jacobs MD, John E. Mayer, Jr, MD, W. Randolph Chitwood, Jr, MD, Gordon F. Murray, MD, Frederick L. Grover, MD
Isolated Aortic Valve Replacement Mechanical Prosthesis Biological Prosthesis (tissue valve) Number of Patients with SSN Survival at Discharge Survival at 30 days Survival at 1 year 2, 206 98. 3 98. 0 95. 6 (97. 7, 98. 8) (97. 4, 98. 6) (94. 7, 96. 4) 10, 130 97. 2 96. 9 91. 7 (96. 9, 97. 5) (96. 5, 97. 2) (91. 2, 92. 2)
Isolated Aortic Valve Replacement Mechanical Prosthesis Biological Prosthesis (tissue valve) Number of Patients with SSN Survival at Discharge Survival at 30 days Survival at 1 year 2, 206 98. 3 98. 0 95. 6 (97. 7, 98. 8) (97. 4, 98. 6) (94. 7, 96. 4) 10, 130 97. 2 96. 9 91. 7 (96. 9, 97. 5) (96. 5, 97. 2) (91. 2, 92. 2)
Risk Algorithm Summary • Risk algorithms are necessary and helpful in assessing risk in TAVR and analyzing outcomes • LES is misleading in assessing TAVR outcomes because it grossly overpredicts risk by a factor of 3 • If LES is used, it must be divided by a factor of 3 • STS (although not perfect) is soundly based on surgical outcomes and is the preferred method of risk assessment and outcome assessment
Risk Algorithm Summary • As more TAVR is performed and collected in databases a “TAVR score” will be possible • Linkages to administrative databases is now possible • “Don’t even talk to me about mortality before 90 days” John Kirklin Circa 1986