
Determining the Structure and Defects of Manganese Oxides


- Slides: 18
Determining the Structure and Defects of Manganese Oxides using X-Ray Absorption Spectroscopy Stanley Quan University of California, Berkeley Stanford Synchrotron Radiation Laboratory, SLAC Mentors: John Bargar & Apurva Mehta August 14, 2008
Biosignatures n Biological indicators for the presence of life Stable over time n Biologically and abiotically formed states are distinguishable n n Search for life on other planets
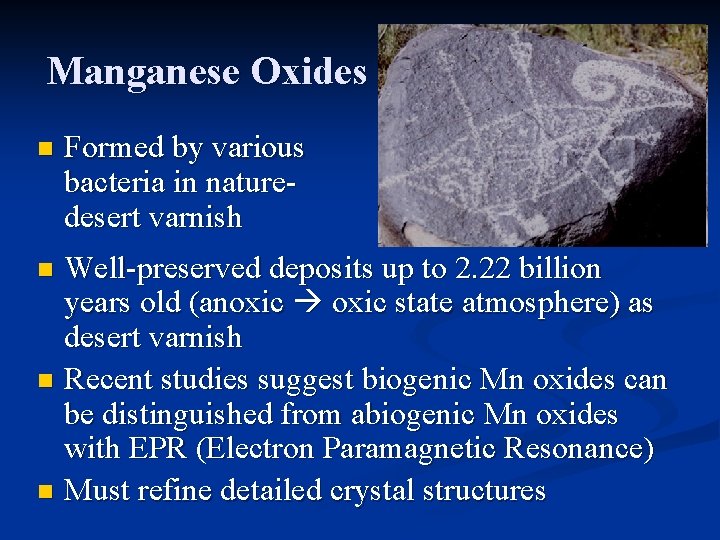
Manganese Oxides n Formed by various bacteria in naturedesert varnish Well-preserved deposits up to 2. 22 billion years old (anoxic state atmosphere) as desert varnish n Recent studies suggest biogenic Mn oxides can be distinguished from abiogenic Mn oxides with EPR (Electron Paramagnetic Resonance) n Must refine detailed crystal structures n
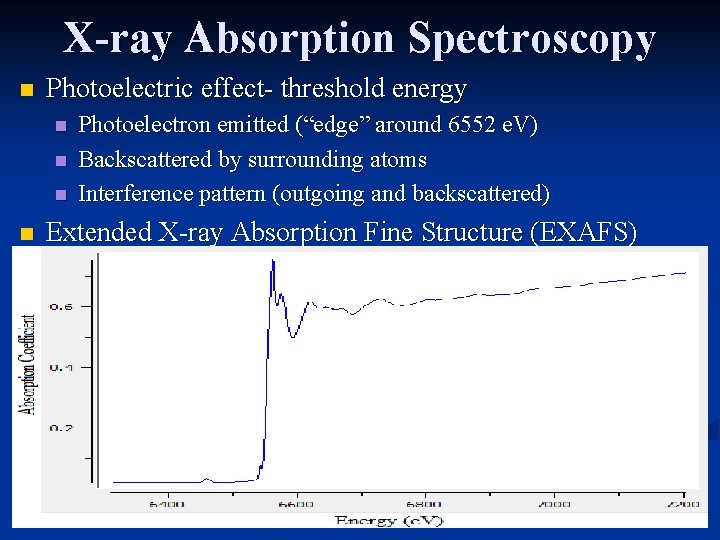
X-ray Absorption Spectroscopy n Photoelectric effect- threshold energy n n Photoelectron emitted (“edge” around 6552 e. V) Backscattered by surrounding atoms Interference pattern (outgoing and backscattered) Extended X-ray Absorption Fine Structure (EXAFS)
Comparing to XRD Mn oxides formed by bacteria are poorly crystallized and defective n X-Ray Diffraction n Assumes periodicity in order to observe a larger range Complementary to XAS Immediate environment around atom n Explores local structure, better suited for Mn oxides n
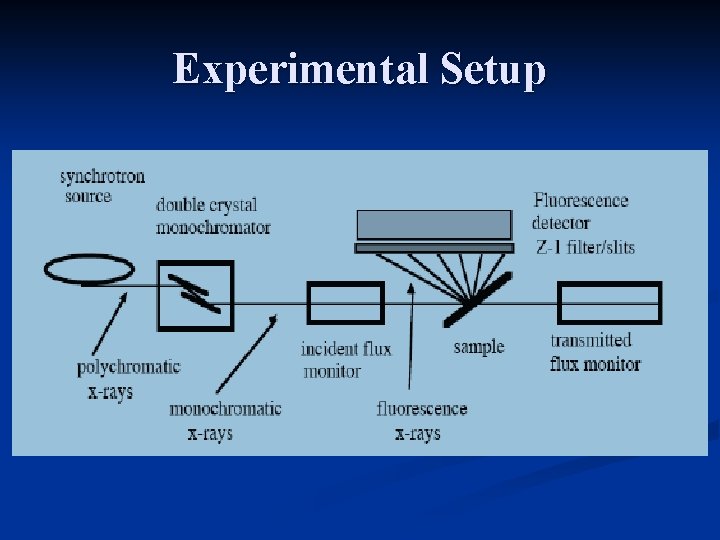
Experimental Setup
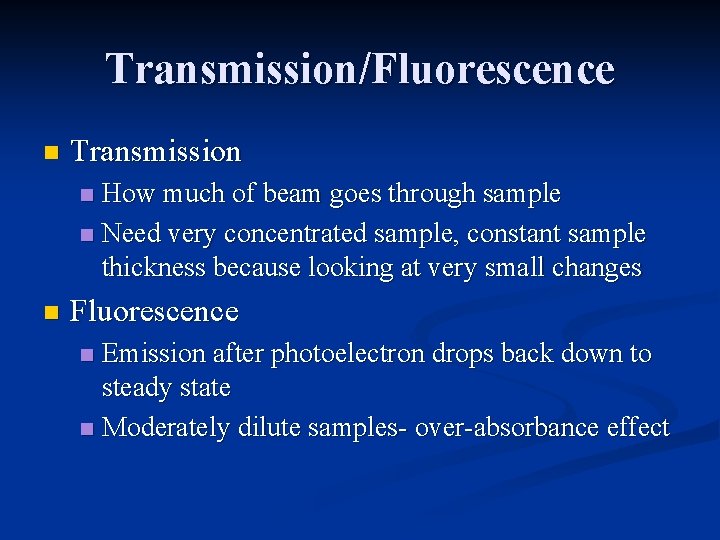
Transmission/Fluorescence n Transmission How much of beam goes through sample n Need very concentrated sample, constant sample thickness because looking at very small changes n n Fluorescence Emission after photoelectron drops back down to steady state n Moderately dilute samples- over-absorbance effect n
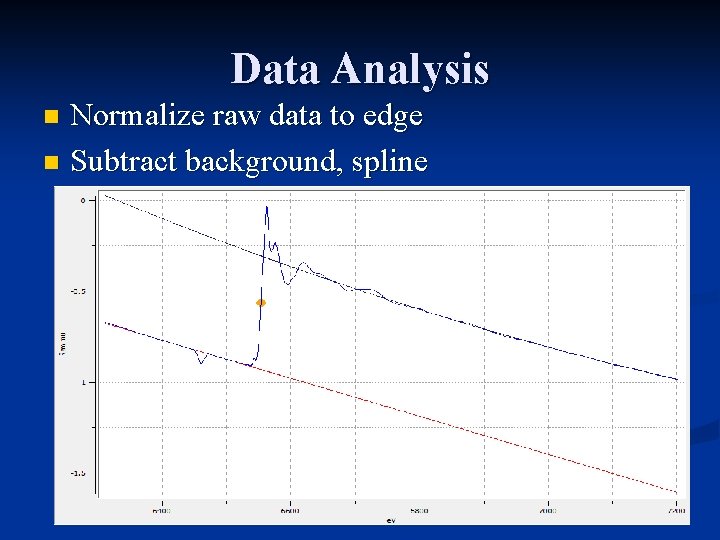
Data Analysis Normalize raw data to edge n Subtract background, spline n
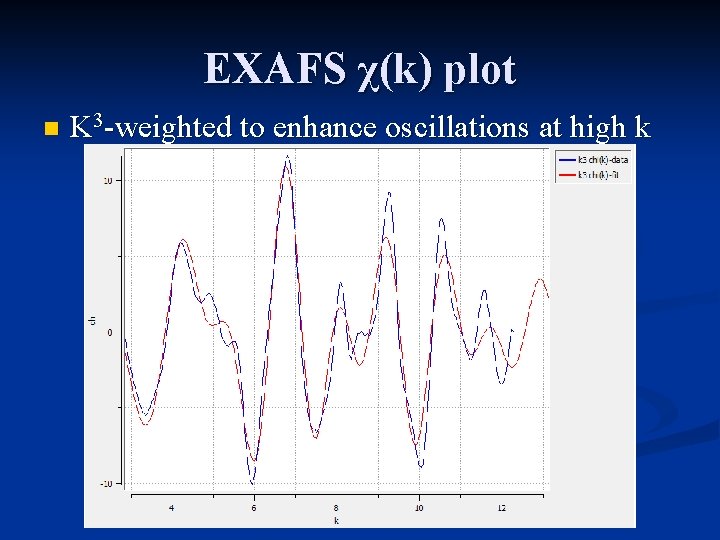
EXAFS χ(k) plot n K 3 -weighted to enhance oscillations at high k
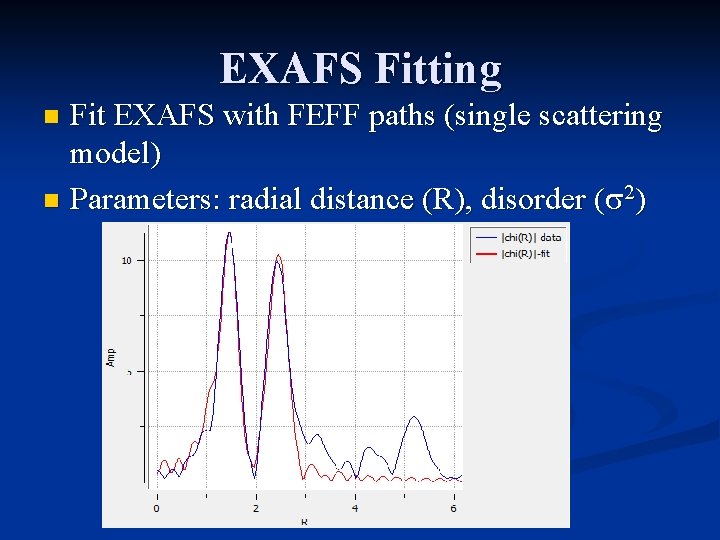
EXAFS Fitting Fit EXAFS with FEFF paths (single scattering model) n Parameters: radial distance (R), disorder ( 2) n
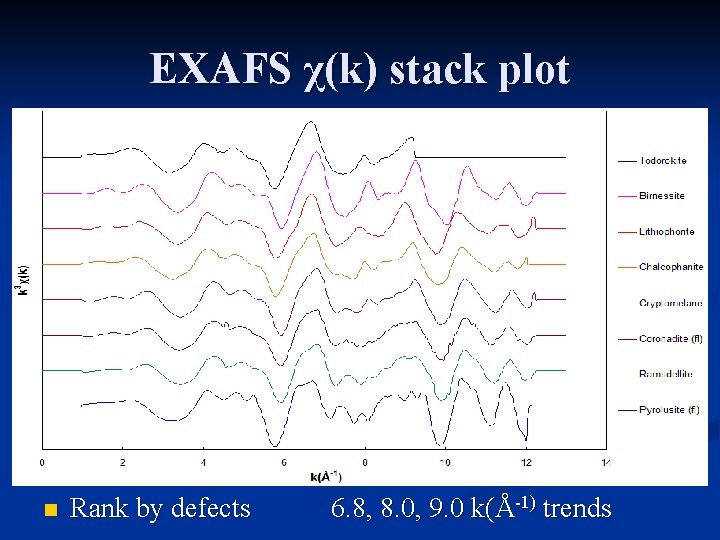
EXAFS χ(k) stack plot n Rank by defects 6. 8, 8. 0, 9. 0 k(Å-1) trends
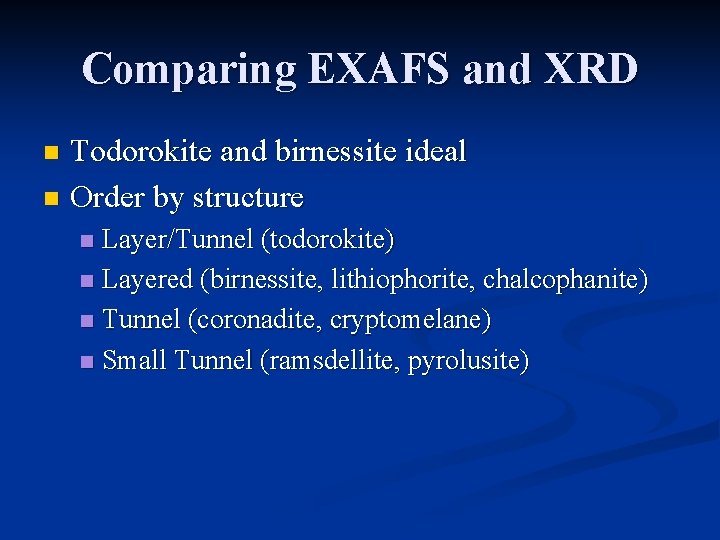
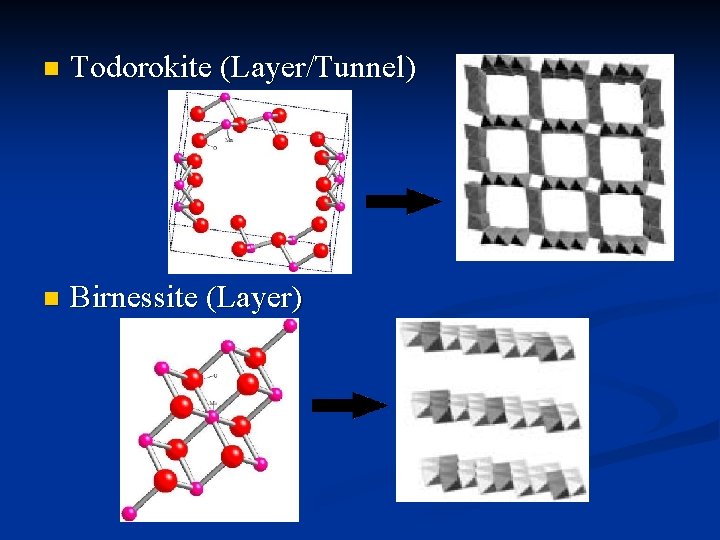
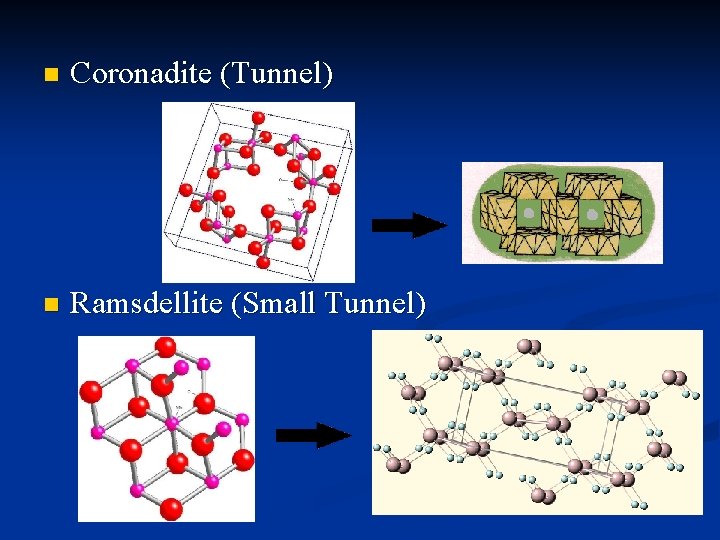
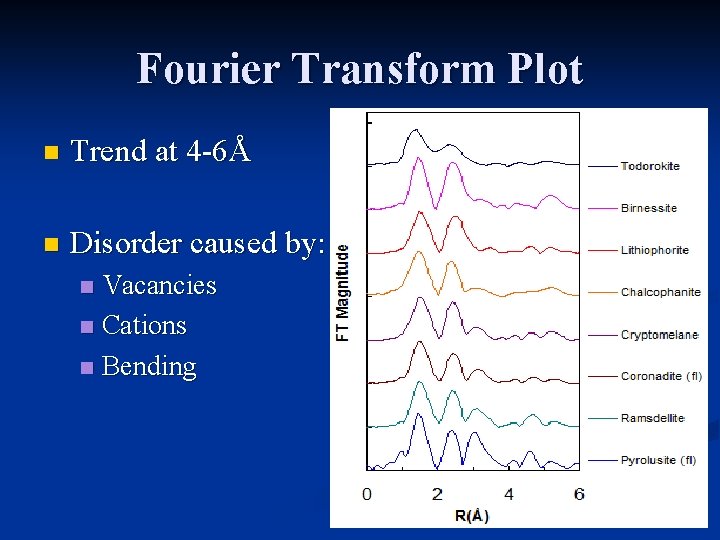
Comparing EXAFS and XRD Todorokite and birnessite ideal n Order by structure n Layer/Tunnel (todorokite) n Layered (birnessite, lithiophorite, chalcophanite) n Tunnel (coronadite, cryptomelane) n Small Tunnel (ramsdellite, pyrolusite) n
n Todorokite (Layer/Tunnel) n Birnessite (Layer)
n Coronadite (Tunnel) n Ramsdellite (Small Tunnel)
Fourier Transform Plot n Trend at 4 -6Å n Disorder caused by: Vacancies n Cations n Bending n
Constrained-to-XRD fits Amplitude reduction fit produced lower coordination numbers than predicted n If constrained to XRD parameters before fitting (CN=6), fit showed progressively more added disorder when going down the series, except for todorokite and birnessite n n Further reinforces ranking of the manganese oxides according to ideal structure
Conclusion By looking at the EXAFS, we were able to see that some manganese oxides are more defective than others n From XRD we learned about their structures, but now with EXAFS we can characterize their structures by lattice disorder and defects n Knowing about the structure may lead to insight about the way they are formed by bacteria and help us identify them if used as biosignatures n
Acknowledgements n Special thanks to: John Bargar and Apurva Mehta n Ellie Schofield and Sam Webb n Susan Schultz, Farah Rahbar, and Steve Rock n SLAC, DOE n