
Determining the Consistency of Information Between Multiple Subsystems
Determining the Consistency of Information Between Multiple Subsystems used in Maritime Domain Awareness Marie-Odette St-Hilairea, Anthony Isenorb a. OODA Technologies b. Defence Research and Development Canada
Objective Present the concept of information consistency using maritime domain awareness (MDA) pertinent information collected from multiple subsystems and propose a methodology to quantify the consistency.
Outlines • MDA, information quality and trust • Information consistency • Prototype to assess consistency of information between multiple sources • Cross comparison of information from multiple data sources • Difficulties in comparing ship related information • Consistency visualization

Maritime Domain Awareness MDA is the effective understanding of anything associated with the maritime domain that could impact the security, safety, economy, or environment.
MDA and Information Heart of MDA: Quality information gained from a combination of sources. Examples of Sources: • maritime, land, air and space surveillance systems • other government departments and the commercial sector • public web sites
Quality and Trust Information accessibility brings issues: • Information overload • Lack of processing capabilities • Trust Issues … Ø Quality of Information impacts trust
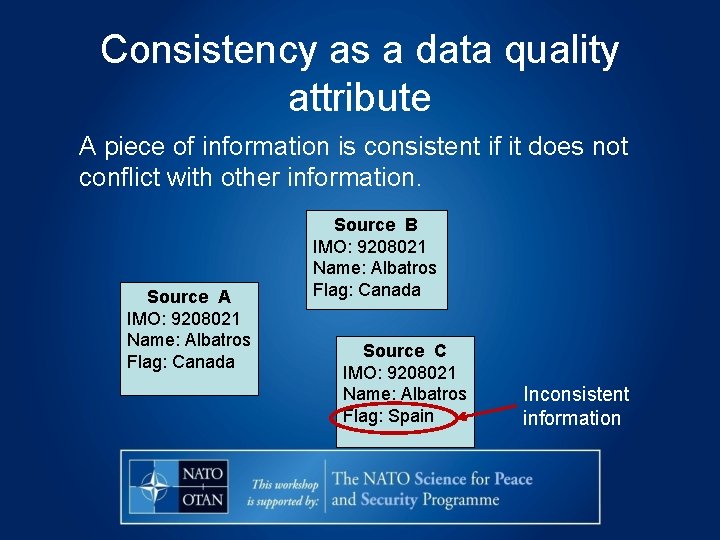
Consistency as a data quality attribute A piece of information is consistent if it does not conflict with other information. Source A IMO: 9208021 Name: Albatros Flag: Canada Source B IMO: 9208021 Name: Albatros Flag: Canada Source C IMO: 9208021 Name: Albatros Flag: Spain Inconsistent information
Assumption Consistency in information helps build the trust we place in the information. Ø To develop trust in information, the similar data items from the various sources should be compared.

Compare-MDA Project Architecture Multiple information sources Consistency evaluation Consistency visualization
High Level Description A Service-Oriented Architecture (SOA) was developed to compare the information from diverse sources. It allows one to: • Assess the consistency of information related to MDA contained in DRDC databases and from web sites • Compare information from disparate sources • Quantify a source consistency • Visualize consistency results within a Google Earth environment.
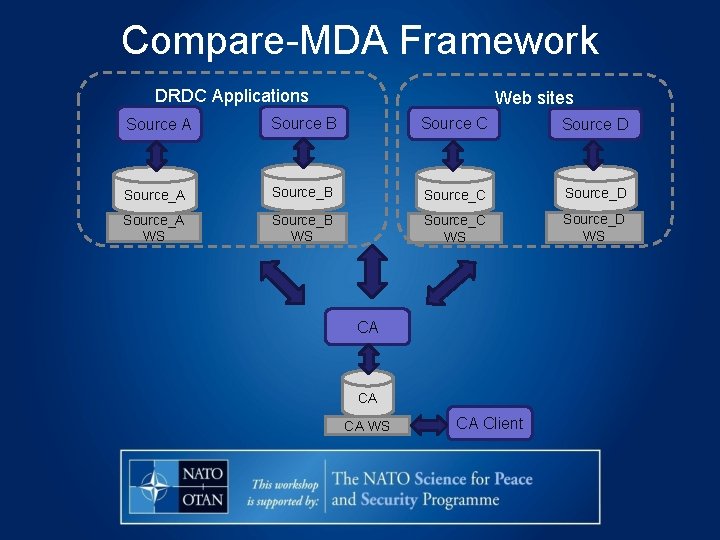
Compare-MDA Framework DRDC Applications Web sites Source A Source B Source C Source D Source_A Source_B Source_C Source_D Source_A WS Source_B WS Source_C WS Source_D WS CA CA CA WS CA Client
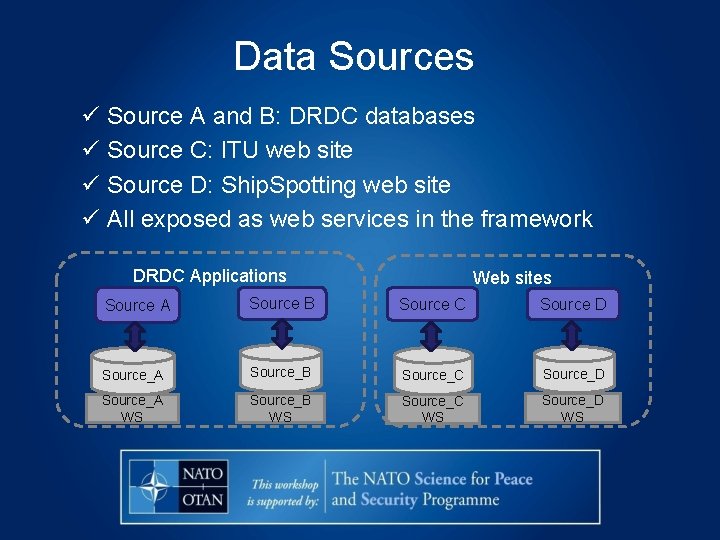
Data Sources Source A and B: DRDC databases Source C: ITU web site Source D: Ship. Spotting web site All exposed as web services in the framework DRDC Applications Web sites Source A Source B Source C Source D Source_A Source_B Source_C Source_D Source_A WS Source_B WS Source_C WS Source_D WS
DRDC Data Sources 2 MDA-related databases: • Both contain static and positional information • One contains ship photographs • Both exposed as web services in the framework
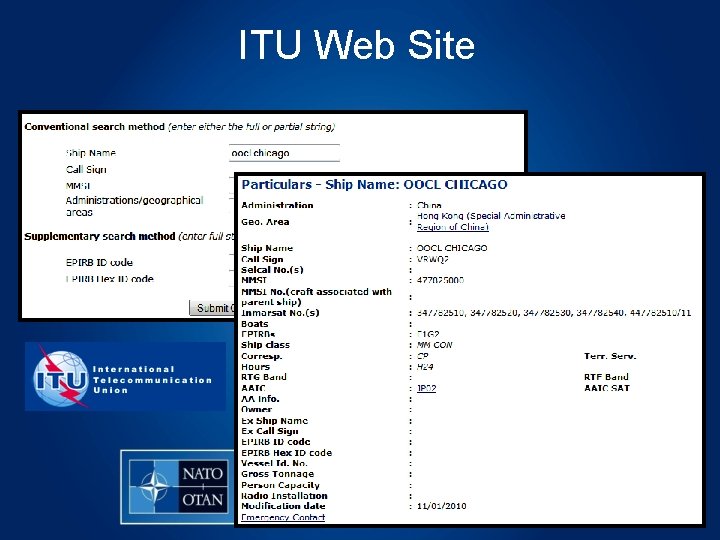
ITU Web Site
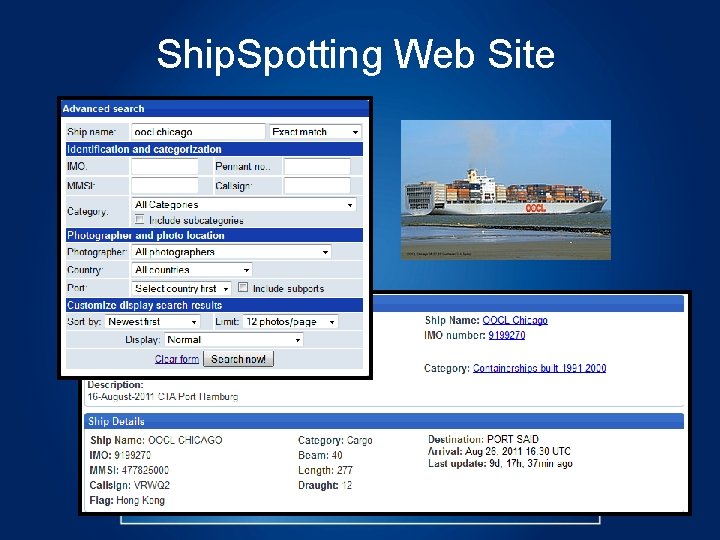
Ship. Spotting Web Site
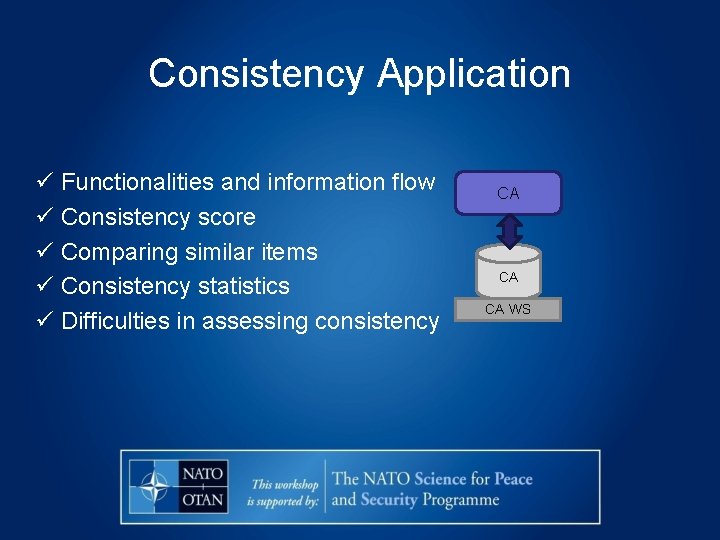
Consistency Application Functionalities and information flow Consistency score Comparing similar items Consistency statistics Difficulties in assessing consistency CA CA CA WS
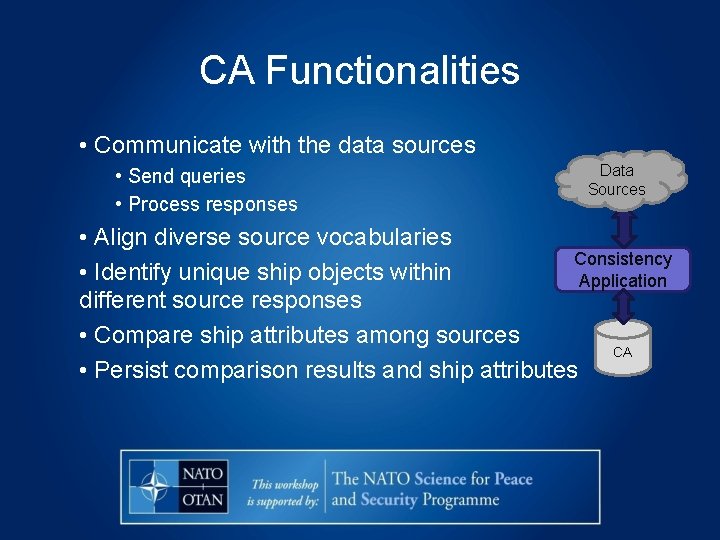
CA Functionalities • Communicate with the data sources • Send queries • Process responses Data Sources • Align diverse source vocabularies Consistency • Identify unique ship objects within Application different source responses • Compare ship attributes among sources CA • Persist comparison results and ship attributes
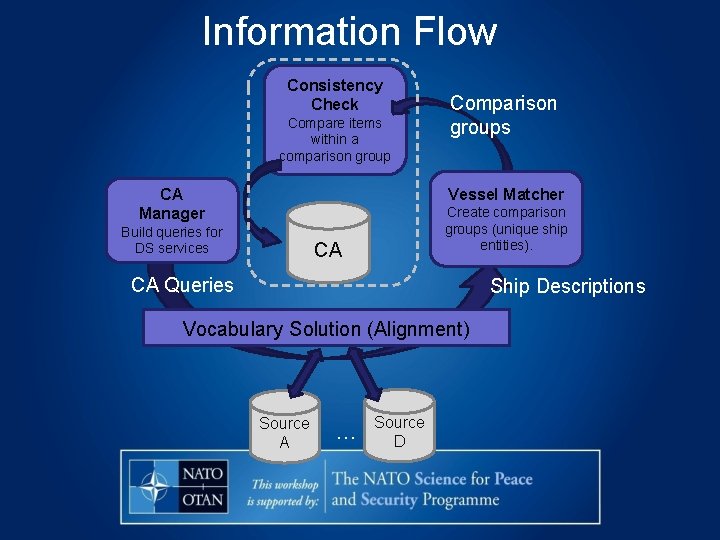
Information Flow Consistency Check Compare items within a comparison group Comparison groups Vessel Matcher CA Manager Build queries for DS services Create comparison groups (unique ship entities). CA CA Queries Ship Descriptions Vocabulary Solution (Alignment) Source A … Source D
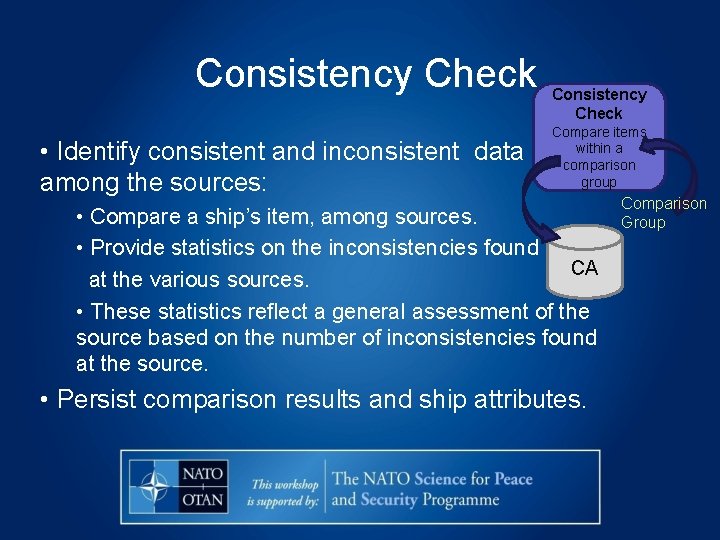
Consistency Check • Identify consistent and inconsistent data among the sources: Consistency Check Compare items within a comparison group • Compare a ship’s item, among sources. • Provide statistics on the inconsistencies found CA at the various sources. • These statistics reflect a general assessment of the source based on the number of inconsistencies found at the source. • Persist comparison results and ship attributes. Comparison Group
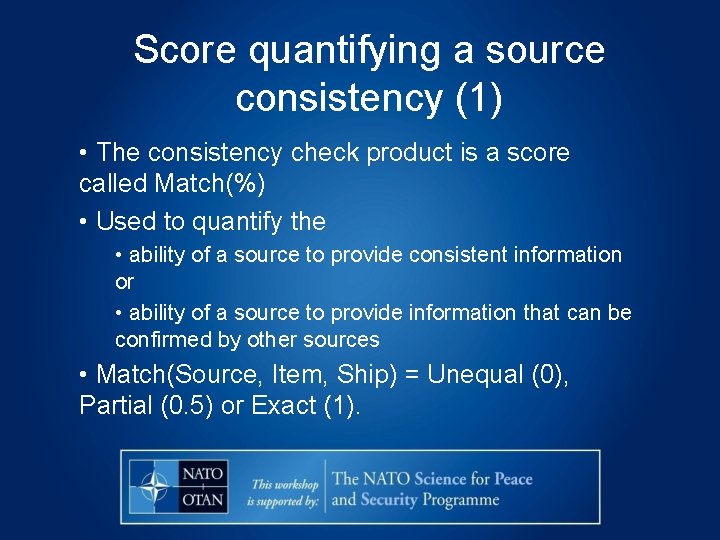
Score quantifying a source consistency (1) • The consistency check product is a score called Match(%) • Used to quantify the • ability of a source to provide consistent information or • ability of a source to provide information that can be confirmed by other sources • Match(Source, Item, Ship) = Unequal (0), Partial (0. 5) or Exact (1).

Score quantifying a source consistency (2) Match(Sourcei, Itemj, Shipk) = Propensity of Sourcei to provide information (Itemj for Shipk) that can be confirmed by other sources. Item Source A (DRDC) Source B (DRDC) ITU Ship. Spotting Ship Name MMSI number Call. Sign IMO number Ship Flag Ship Type
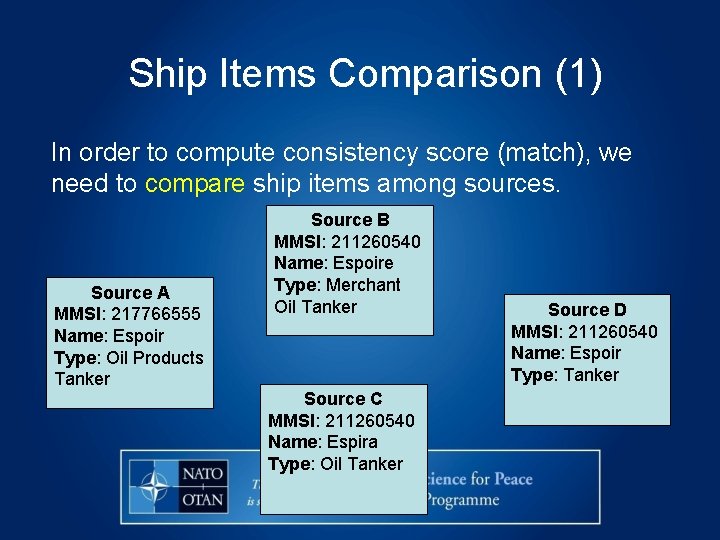
Ship Items Comparison (1) In order to compute consistency score (match), we need to compare ship items among sources. Source A MMSI: 217766555 Name: Espoir Type: Oil Products Tanker Source B MMSI: 211260540 Name: Espoire Type: Merchant Oil Tanker Source C MMSI: 211260540 Name: Espira Type: Oil Tanker Source D MMSI: 211260540 Name: Espoir Type: Tanker
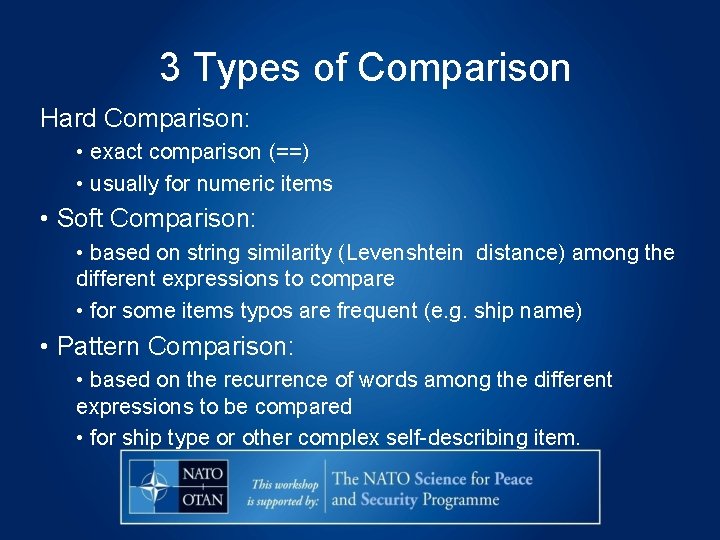
3 Types of Comparison Hard Comparison: • exact comparison (==) • usually for numeric items • Soft Comparison: • based on string similarity (Levenshtein distance) among the different expressions to compare • for some items typos are frequent (e. g. ship name) • Pattern Comparison: • based on the recurrence of words among the different expressions to be compared • for ship type or other complex self-describing item.
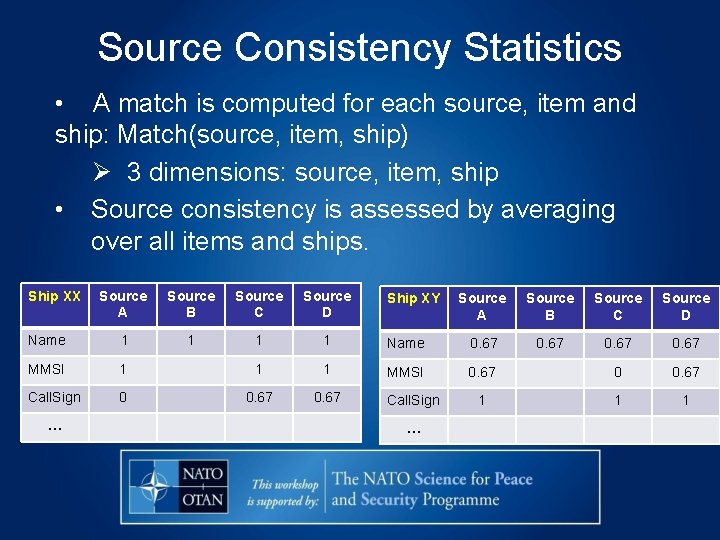
Source Consistency Statistics • A match is computed for each source, item and ship: Match(source, item, ship) Ø 3 dimensions: source, item, ship • Source consistency is assessed by averaging over all items and ships. Ship XX Source A Source B Source C Source D Name 1 1 MMSI 1 1 1 Call. Sign 0 0. 67 … Ship XY Source A Source B Source C Source D Name 0. 67 MMSI 0. 67 0 0. 67 1 1 1 Call. Sign …
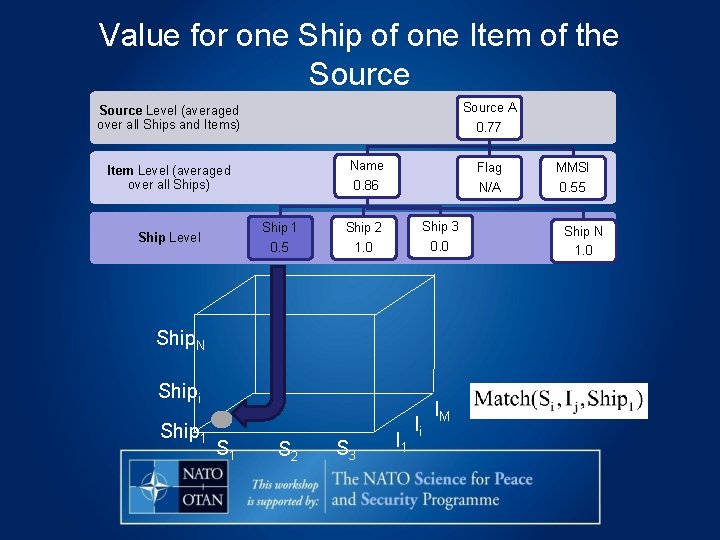
Value for one Ship of one Item of the Source A 0. 77 Source Level (averaged over all Ships and Items) Name 0. 86 Item Level (averaged over all Ships) Ship 1 0. 5 Ship Level Flag N/A Ship 3 0. 0 Ship 2 1. 0 Ship. N Shipi Ship 1 S 2 S 3 I 1 Ii IM MMSI 0. 55 Ship N 1. 0
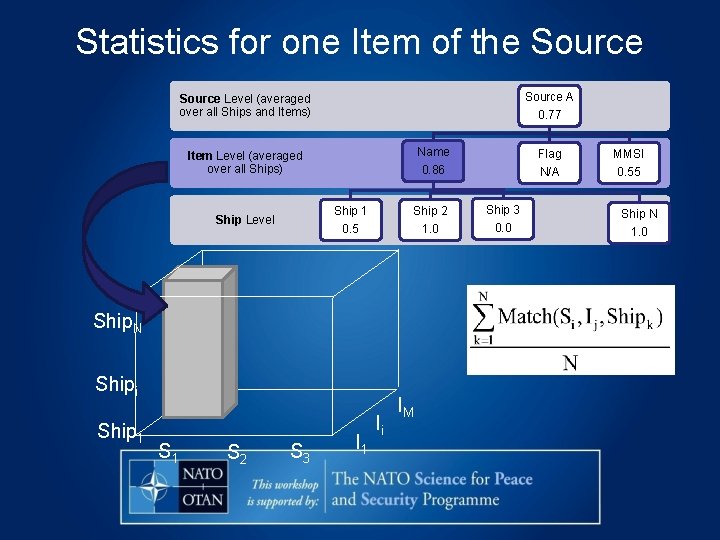
Statistics for one Item of the Source A 0. 77 Source Level (averaged over all Ships and Items) Name 0. 86 Item Level (averaged over all Ships) Ship 1 0. 5 Ship Level Ship 2 1. 0 Ship. N Shipi Ship 1 S 2 S 3 I 1 Ii IM Flag N/A Ship 3 0. 0 MMSI 0. 55 Ship N 1. 0
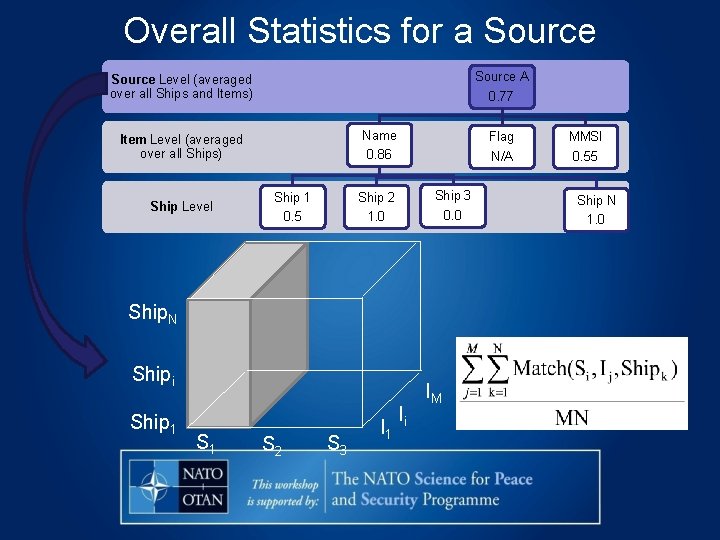
Overall Statistics for a Source A 0. 77 Source Level (averaged over all Ships and Items) Name 0. 86 Item Level (averaged over all Ships) Ship Level Ship 1 0. 5 Flag N/A Ship 3 0. 0 Ship 2 1. 0 Ship. N Shipi Ship 1 S 2 S 3 I 1 Ii IM MMSI 0. 55 Ship N 1. 0
Difficulties in assessing information consistency • Complex… and we just compared strings. • Comparison is static • no consistency tracking (does a source consistency evolves in time? ) • no comparison of dynamic information such as destination, ETA, cargo. . .
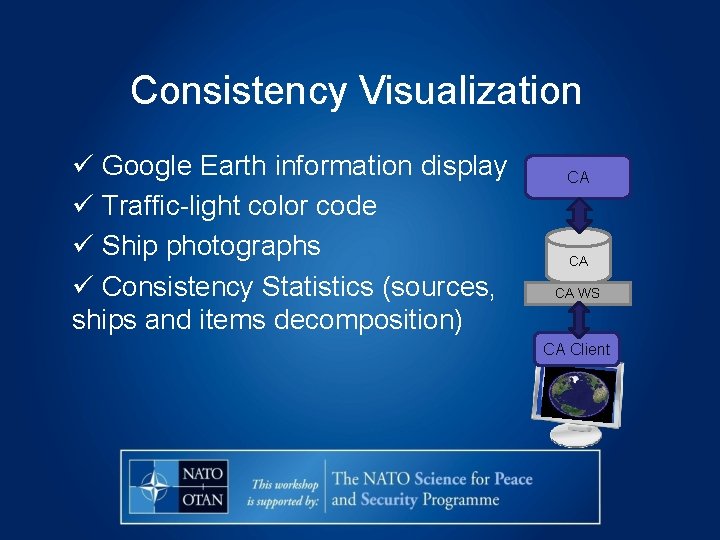
Consistency Visualization Google Earth information display Traffic-light color code Ship photographs Consistency Statistics (sources, ships and items decomposition) CA CA CA WS CA Client
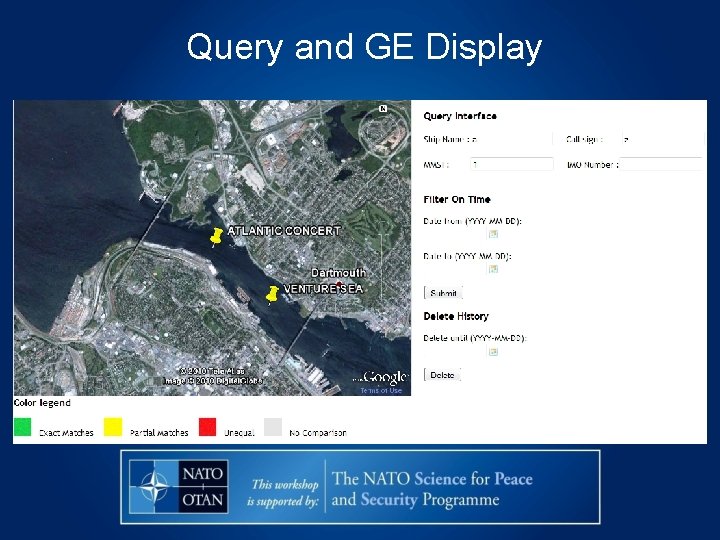
Query and GE Display
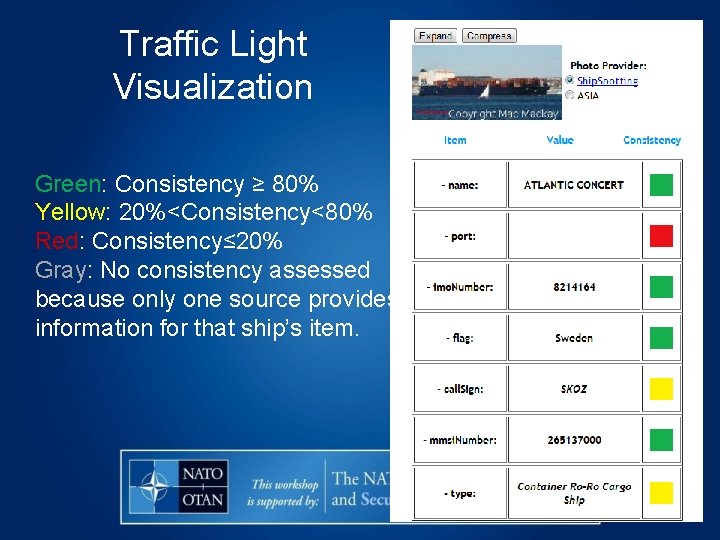
Traffic Light Visualization Green: Consistency ≥ 80% Yellow: 20%<Consistency<80% Red: Consistency≤ 20% Gray: No consistency assessed because only one source provides information for that ship’s item.
Concluding Remarks There are many information quality attributes: uncertainty, reliability, relevance, utility, expectability. . . The problem comes to quantify (build metrics to assess) these quality attributes. Ø In this project, we showed that consistency can be concretely quantified without any a priori suppositions. Ø The computed consistency can then be used • to identify some sources as providing more reliable information as compared to other sources • for post processing (e. g. information fusion)
- Slides: 32