
Determining Error Biases in SecondGeneration DNA Sequencing Data
Determining Error Biases in Second-Generation DNA Sequencing Data Project Proposal Neza Vodopivec Applied Math and Scientific Computation Program nvodopiv@math. umd. edu Advisor: Aleksey Zimin Institute for Physical Science & Technology alekseyz@ipst. umd. edu Abstract: I will study base substitution error biases in Illunima data. Specifically, I will compute how often each of the 12 substitutions occurs and determine which type of error is dominant for each quality score. I will also examine how the frequency of substitution errors changes over intervals of the genome with different GC content. I will then determine the most common errors that occur in data covering regions for a given GC content. 1
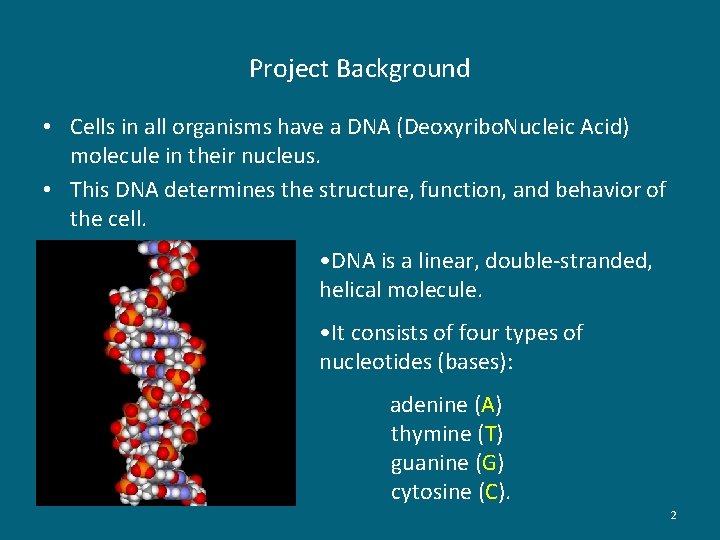
Project Background • Cells in all organisms have a DNA (Deoxyribo. Nucleic Acid) molecule in their nucleus. • This DNA determines the structure, function, and behavior of the cell. • DNA is a linear, double-stranded, helical molecule. • It consists of four types of nucleotides (bases): adenine (A) thymine (T) guanine (G) cytosine (C). 2
GENOMES • A genome is the linear sequence of bases of the DNA: …. . GATGACATGTAT…. . – Bacteria: ~2 -5 million bases – Mammals: ~3 billion bases – Plants: ~24 billion bases and up. • Current technology does not allow us to read more than 1001000 contiguous bases from a genome. • Assembly is required! • We take multiple copies of a genome, break them into small fragments, and determine the sequences of the fragments … like … a jigsaw puzzle! 3

Assembling a giant jigsaw puzzle http: //www. simonbarker. com 4
GENOME SEQUENCING DATA • Sequencing machines (e. g. Illumina sequencers) read 100 -150 bp fragments of the genome called “reads”. • Each read is a sequence of letters from the set {A, C, G, T}. • Each base is assigned a quality score q from [0, …, 40], where probability P that the base is wrong is 10^(-q/10). • Sequencing machines make mistakes, and the most common type is a SUBSTITUTION, where a letter is read incorrectly. • Insertions/Deletions (an extra letter read, or a letter missed) are rare (~ 100 times less common). 5
ERRORS are BIASED • I will study the substitution errors in Illumina data. • Such errors are biased, e. g. Dohm et al. determined that the most frequent type of base substitution error is an A to a C and the least frequent one is a C to a G. • Kelly et al. found that the dominant substitution errors changed with different quality scores. 6
DATABASES • Input data for Rhodobacter sphaeroedes bacteria : – – • • two matrices, R and Q, both (n by l), containing read sequences and quality scores, where l is the read length and n is the number of reads. Finished sequence – a string (vector) of letters (bases) of length ~4. 6 M that represents the true genome sequence for the bacteria l=101 and n=2, 000. Additional databases (faux data, published results, similar data for Staphylicoccus aureus) will be used for validation and testing. 7
APPROACH • The project will be split into three major parts: – – – Aligning the reads to the finished sequence and finding out where the substitution errors are. Constructing Substitution Error Matrices Eq for Different Quality Scores, e. g. determining the frequencies of different types of substitution errors as a function of the quality scores. Constructing Substitution Error Matrices Eg for Different GC content of the sequences, e. g. determining frequencies of different types of substitution errors as a function of the CG content of reads. 8
Part 1: Annotating the Reads • Part 1 a: Determine the best global alignment of each read to the finished sequence. • Part 1 b: Determine the best local alignment. Identify all insertion and deletion errors on the read in order to align individual bases onto the finished sequence correctly. • Part 1 c: Compare the corresponding bases in the aligned sequences to determine the substitution errors. Create annotated reads marking these substitution errors. 9
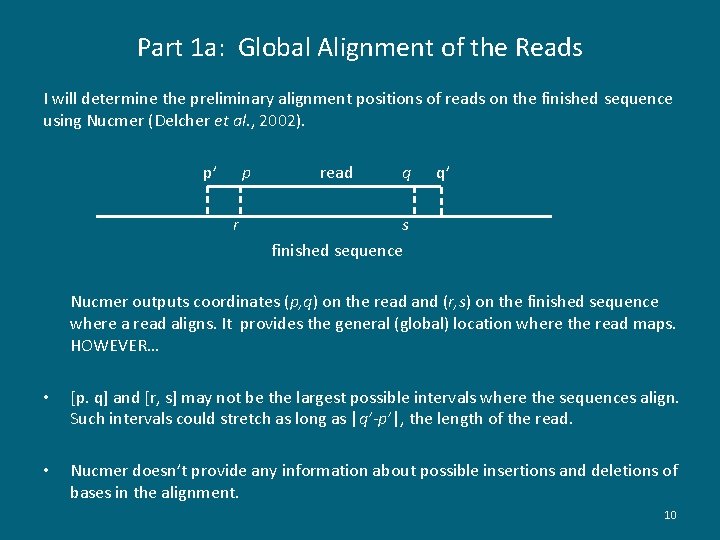
Part 1 a: Global Alignment of the Reads I will determine the preliminary alignment positions of reads on the finished sequence using Nucmer (Delcher et al. , 2002). p’ p r read q q’ s finished sequence Nucmer outputs coordinates (p, q) on the read and (r, s) on the finished sequence where a read aligns. It provides the general (global) location where the read maps. HOWEVER… • [p. q] and [r, s] may not be the largest possible intervals where the sequences align. Such intervals could stretch as long as |q’-p’|, the length of the read. • Nucmer doesn’t provide any information about possible insertions and deletions of bases in the alignment. 10
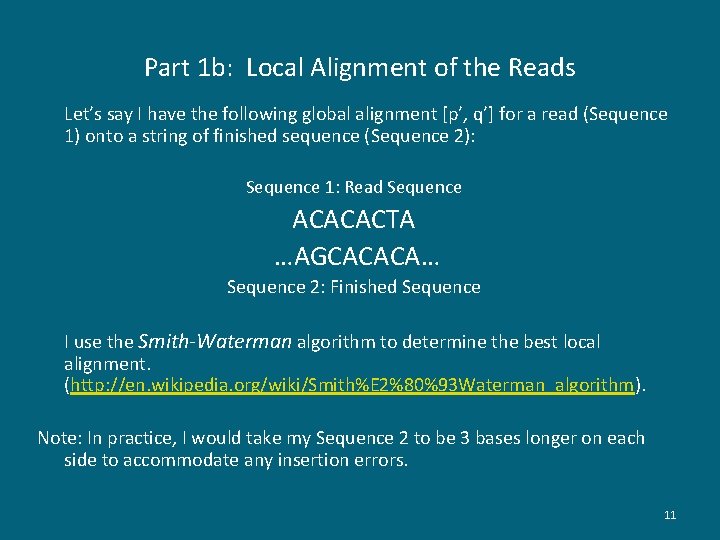
Part 1 b: Local Alignment of the Reads Let’s say I have the following global alignment [p’, q’] for a read (Sequence 1) onto a string of finished sequence (Sequence 2): Sequence 1: Read Sequence ACACACTA …AGCACACA… Sequence 2: Finished Sequence I use the Smith-Waterman algorithm to determine the best local alignment. (http: //en. wikipedia. org/wiki/Smith%E 2%80%93 Waterman_algorithm). Note: In practice, I would take my Sequence 2 to be 3 bases longer on each side to accommodate any insertion errors. 11

Smith-Waterman alignment (from Wikipedia) 12

Smith-Waterman Alignment • • I build a matrix that represents all possible alignment choices. At every base, the following are possible: The read and the finished sequence have matching letters; There was insertion or deletion of a letter; There was a substitution of one letter for another; The read no longer aligns to the finished sequence from that base forward. (A non-matching base is followed by two contiguous non-matching bases. ) I give each option a weight: reward or penalty points. My weights: w (match)= +2, w (insertion) =w(deletion)= - 2, W(mismatch) = - 1. 13

Smith-Waterman alignment: finding possible paths Sequence 1 (horizontal) = read sequence & Sequence 2 (vertical) = finished sequence 14
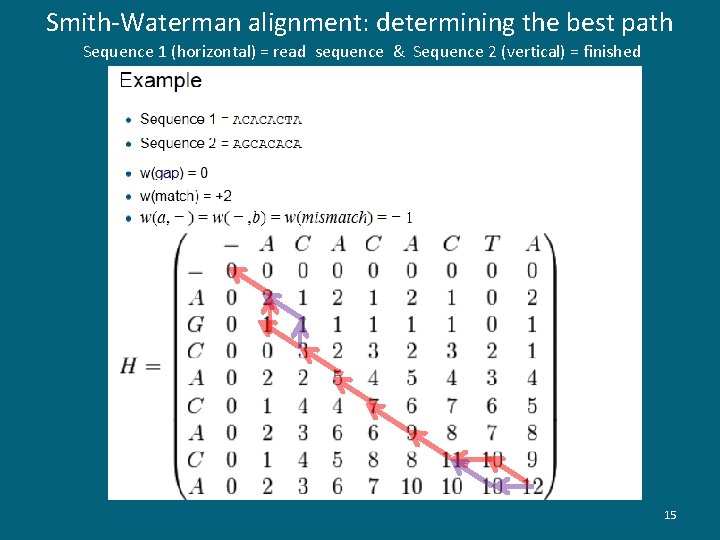
Smith-Waterman alignment: determining the best path Sequence 1 (horizontal) = read sequence & Sequence 2 (vertical) = finished sequence 15
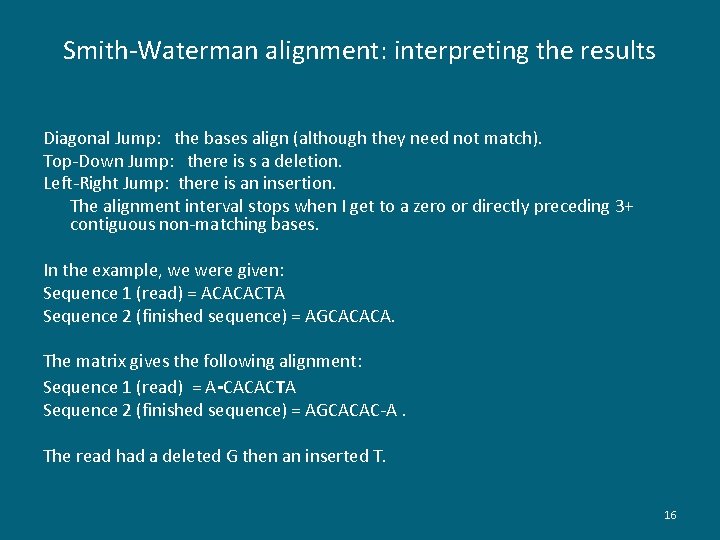
Smith-Waterman alignment: interpreting the results Diagonal Jump: the bases align (although they need not match). Top-Down Jump: there is s a deletion. Left-Right Jump: there is an insertion. The alignment interval stops when I get to a zero or directly preceding 3+ contiguous non-matching bases. In the example, we were given: Sequence 1 (read) = ACACACTA Sequence 2 (finished sequence) = AGCACACA. The matrix gives the following alignment: Sequence 1 (read) = A-CACACTA Sequence 2 (finished sequence) = AGCACAC-A. The read had a deleted G then an inserted T. 16
Expected Problems • Execution time: I have to compute an alignment for each read, which requires O(l^2) operations. I will compute Smith-Waterman alignments in parallel. • The Smith-Waterman alignment algorithm finds all local alignments. There may be multiple parts of a read aligning well, with non-aligning gaps in between. We will have a gap penalty of w= -5. 17
Part 1 c: Marking the Substitution Errors While the Smith-Waterman alignment algorithm gives information about the insertion and deletion of bases, it does not distinguish between matching and non-matching aligned bases. Therefore my last step is to identify the mismatches, or base substitutions, from each alignment and mark them on an accompanying read. The set of accompanying reads are my error-annotated reads (my deliverable). 18
Part 2: Determining the most frequent errors as a function of quality scores I use the annotated reads and the quality scores assigned to the original reads. Let (x 1, x 2, x 3, x 4) be the event that the letter (A, C, G, T) is marked at base h in the ORIGINAL sequence. Let (y 1, y 2, y 3, y 4) be the event that the letter (A, C, G, T) is marked at base h in the ANNOTATED sequence. A C G T A 0 e(1, 2) For each quality score q, I create a 4 x 4 Substitution Error C 0 Matrix, with entries eq(i, j) =∑h yj |xi. G 0 T 0 For example, e(1, 2) is the frequency of an A C error, i. e. A is erroneously read as a C. I then determine the most dominant error type for each quality score q ( my deliverable). 19
Part 3: Determining the most frequent errors as a function of GC content Next, I study how individual types of substitution errors vary with GC content. Let (x 1, x 2, x 3, x 4) be the event that the letter (A, C, G, T) is marked at base h in the ORIGINAL sequence. Let (y 1, y 2, y 3, y 4) be the event that the letter (A, C, G, T) is marked at base h in the ANNOTATED sequence. A C G T A 0 e(1, 2) For each available GC percentage g, I create a 4 x 4 Substitution C 0 Error Matrix Eg with entries eg(i, j) =∑h yj |xi. G 0 T 0 For example, e(1, 2) is the frequency of A C errors for all intervals with a GC percentage of g. I determine the most frequent error type for each GC percentage available (my deliverable). 20
Part 3: Determining the most frequent errors as a function of GC content • I compute the GC content, that is the percentage of bases whose letter is either a G or C, for each 200 -base interval on the finished sequence. There are N-200 such intervals, where N is the number of bases in the finished sequence. • I categorize each interval by its GC content and study the errors for each GC category. • First I study how the rate of substitution errors varies with GC content. • I plot the frequency of (combined) substitution errors as a function of a region’s GC content (my deliverable). 21
IMPLEMENTATION • The code will be implemented in Perl. • Outside Software: Nucmer, a DNA sequence alignment software (Delcher et al. , 2002). • Hardware: • AMD Opteron computer, 32 cores, 256 GB of Ram • Parallelization: Part 1 of the code will be parallelized. 22
VALIDATION Validating part 1: Is read annotation correct? • Generate a database of faux reads, each k bases long, by reading off subsequences from random locations in the finished sequence. Introduce random substitution errors. • Record the substitution errors for each faux reads into accompanying error–annotated faux reads. • Run the faux reads on part 1 of the code and make sure that the annotated reads produced by the code are exactly the same as the errorannotated faux reads. 23
VALIDATION Validating part 2: Are Substitution Error Matrices Eq correct? • Use the faux reads and faux annotated reads created to validate part 1. • Assign each base in the finished sequence a quality score uniformly at random. • Run part 2 of the code. The expected value for each entry in a given row is equal in all matrices since letter substitutions and quality scores were chosen at random. 24
VALIDATION Validating part 3: Are Substitution Error Matrices Eg correct? • Again use the faux reads and faux annotated reads created in part 1. • Run part 3 of the code. The plot created should show no correlation between GC content and frequency of substitution errors. The expected value for each entry in a given row is equal for all matrices since letter substitutions and GC content were chosen at random. 25
TESTING • I will run my finished software with data from another genome, Staphylococcus aureus. This genome is smaller than the Rhodobacter sphaeroedes and has a much lower GC content. The two genomes were sequenced at different Illumina sequencing centers. • I will also compare my results with published studies. (Dohm et al. , 2008; Kelly et al. , 2010). 26
PROJECT SCHEDULE / MILESTONES • October: Learn how to use Nucmer software. Use Smith-Waterman algorithm to align reads and identify insertions/deletions. • November: Annotate reads for substitutions. Validate part 1 of the code. • December: Prepare mid-year presentation. • January: Create error matrices as a function of quality scores. Validate part 2 of code. • February: Compute GC contents on intervals. Compute error frequencies. Create error matrices as a function of GC content. • March: Validate part 3 of code. Create all tables and plots. • April: Write final project report and prepare presentation. 27
DELIVERABLES 1. Finished code. 2. Rhodobacter sphaeroedes reads annotated for insertion, deletion, and substitution errors. 3. Table of the most frequent error type for each quality score. 4. Plot of the frequency of the combined substitution errors as a function of a region’s GC content. 5. Table of the most frequent error type for each available GC content. 28
REFERENCES Dalloul RA, Long JA, Zimin AV, Aslam L, et al. Multi-Platform Next-Generation Sequencing of the Domestic Turkey (Meleagris gallopavo): Genome Assembly and Analysis. PLo. S Biol. 2010, 8(9): e 1000475. Delcher AL, Phillippy A, Carlton J, Salzberg SL: Fast algorithms for large-scale genome alignment and comparison. Nucleic Acids Res. 2002, 30(11): 2478 -83. Dohm JC, Lottaz C, Borodina T, Himmelbauer H: Substantial biases in ultra-short read data sets from high-throughput DNA sequencing. Nucleic Acids Res 2008, 36: e 105+. Genome 10 K Community of Scientists: Genome 10 K: a proposal to obtain wholegenome sequence for 10 000 vertebrate species. J. Heredity 2009, 100: 659 -674. Kelley DR, Schatz MC, Salzberg SL: Quake: quality-aware detection and correction of sequencing errors. Genome Biol 2010, 11(11): R 116. 29
- Slides: 29