Detector of UV and IR Radiation on Board

Detector of UV and IR Radiation on Board “Tatiana” and- “Tatiana-2” Satellites and Applications for Future Experiments and in Complex Detector for TLE Study at Aragats Cosmic Station” G. K. Garipov Skobeltsyn Institute of Nuclear Physics, Moscow State University, Russia Content. 1. MSU Micro satellite TATIANA UV Detector and Results of measurements 2. MSU Micro satellite TATIANA-2 UV, IR and Charged Particles detectors and First Results of measurements 3. ISR of RAS Micro satellite CHIBIS-M UV and IR detectors 4. UV and IR detectors for Ararat's Cosmic Station for Study Elementary Particle Acceleration in Thunderstorm Electric Field. 5. Conclusion TEPA 2010

Parameters of the ‘‘Tatiana’’ satellite Mass, kg Power, Wt 25 7

Ground track of TATIANA satellite Altitude 1000 km Inclination 820 TATIANA

Parameters of the UV detector Mass, kg 0. 5 Field of view, degree ± 7 Power, Wt 0. 6 PMT R 1463 The scientific instruments were prepared and constructed by D. V. Skobeltsyn Institute of Nuclear Physics. Mass of scientific instrument, kg Power, Wt 7 4. 2

Block-diagram of the UV detector at the MSU “Tatiana” satellite UV detector comprises 2 PMT tubes and electronics block. (first tube measures an optical radiation, second measures the charge particle background) Two code are recorded and used in measurements: M- PMT gain DAC code and N- the PMT anode current ADC code (1) collimator, (2) UV-1 filter, (3) cover, MX—multiplexor, HV—voltage supply for PM tubes, ADC and DAC—analog-digital and digital-analog convertors, Logic Unit-FPGA.

UV & blinded PMT electronics block- diagram

Gain control circuit or detector

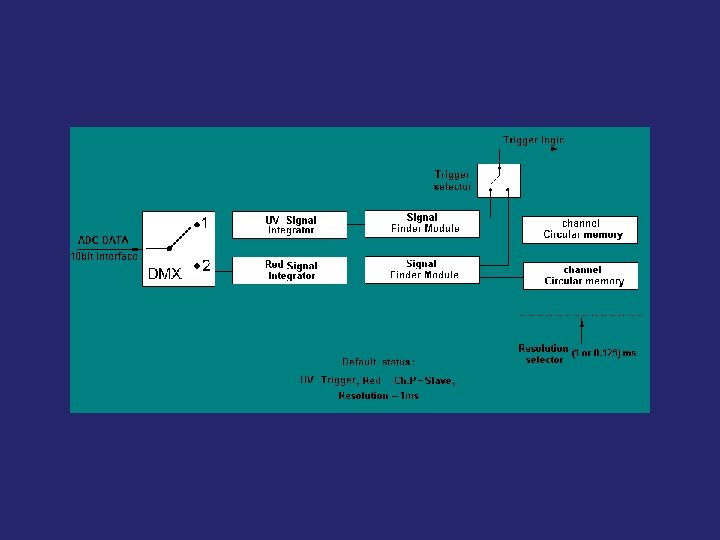
Digital integrator and Signal finder circuit. The ‘‘flash’’ event finding algorithm

Electronics diagram

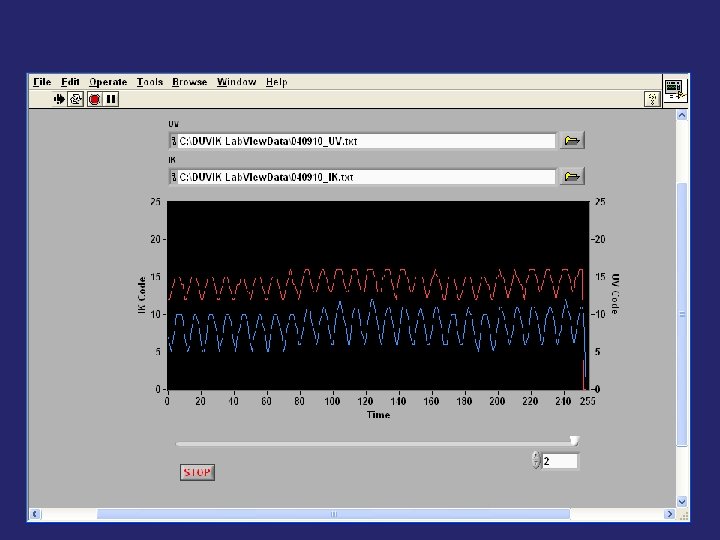
Example of the measured oscillogram of the airglow signal on the day side, satellite is illuminated by the Sun ground track of the orbit

Stability of the PMT performance. Moon was used as source of calibrated light

Examples of UV intensity and AURORA and near equatorial ovals recording on – route at South latitudes in moonless night in two circulations.

Registering of the TLE. It performed by 2 oscilloscopes: with trace length 4 ms and time sample 16μs, and trace length 64 ms and time sample 256μs. Examples of UV flashes of energy 1011 – 1012 erg in 1 -64 ms intervals were detected.

Global map of UV flashes

Positions of the UV detector at new moon and full moon in reference to the Earth and the Sun. UV transient event number as a function of lunar phase

Correlation between the transient UV event rates

Energy distribution of UV TLE radiation recorded by DUV

Carrier rocket: “Soyuz-2” Upper-stage rocket “Fregat” Operating orbit: Polar Sun synchronous Altitude : 800 – 850 km Inclination 98. 80 Mass: Power: 100 kg 100 W

Assembling of the satellite and scientific equipment

Ground track of TATIANA-2 satellite Altitude Inclination 850 km 98. 80

Block-diagram of UV, IR and CPD detectors at the MSU “Tatiana 2” satellite

Thickness 0. 5 cm Sensitive aria 350 cm 2 Energy threshold 1 Mev

UV & CPD detectors electronics block- diagram

Example of UV intensity recording on-orbits.

Examples of UV, IR and CP temporal distribution by TATIANA-2 above SAA

One day TLE distribution recorded by TATIANA-2 above cloud word map Part of flash events are observed in cloudless regions and was not detected by WWLLN Every orbit with close longitudes have been observed the same picture-long series of flash events. Length of such series reach 10 thousand kilometers which is much more longer then thunderstorm or clouds area crossed by satellite.

Lighting flashes density above land ~ 5· 10 -5 min-1 km-2 above water ~ 5· 10 -7 min-1 km-2 Flash events density recorded by TATIANA-2 above land ~ 5· 10 -5 min-1 km-2 above water ~ 5· 10 -5 min-1 km-2

Typical lighting geographical distribution in winter and summer All recorded thunderstorm cloud to ground lightings are in good correlation with clouds distribution.

Low energy flash events distributed uniformly at the globe map, at least at the night site of orbit observed by UV detector during TATIANA-2 mission.

Low energy flash event Global distribution statistics Distribution of registered flash events on the map in pixels 300

Main number of flashes distributed above continents at the regions with high lighting activity. We believe main part of flashes have ionospheric origin.

DUV on the board CHIBIS micro satellite of Institute for Space Research of Russian Academy of Sciences

Total mass Serves equipment Scientific payload Power Orbit altitude 40 kg 12, 6 kg 10, 8 kg 50 Wt 480 km The launch of the CHIBIS micro satellite is planned to celebrate the 50 -years of the launching of the first man in space in USSA

UV 240 -400 nm Red 610 -800 nm Sensitive area ~ 0. 5 cm 2 Field of view ~ 150 Mass ~ 0. 65 k. G Power < 2. 5 Wt

UV and IR detector for Aragats cosmic station

Structure of the set up for lighting observation at Aragats Cosmic Station

Aragats UV and IR detector testing in Nor Amberd laboratory with lamp

Aragats UV and IR detector testing in Nor Amberd laboratory with LED sours

CONCLUSIONS 1. The background radiation of light from charged particles in the optical components of the detector is negligibly small as compared with the airglow on the darkest nights. 2. It is confirmed by experiments that the PMT can operate with a regulated high-voltage power supply in the transition mode from a large illumination on the day side of the Earth to a small one on the night side. 3. The afterglow effect of the PMT proves to be small as compared with the airglow even on the darkest nights. In ultraviolet intensity measurements by one detector, a wide dynamic range of ~105 was reached. 4. For observation of bursts, the digital oscilloscope method was successfully applied. Bursts with an ultraviolet radiant energy of hundreds of k. J were recorded 5, Ground base UV and IR detector successfully was tested in Nor Amberd Cosmic Ray Laboratory with LED flash source

1. PMT is able to operate in period of several years in the orbit in the day and night regime. 2. The regime of the PMT operation with variable gain following by the UV light intensity increase detector duty cycle.
- Slides: 42