Detection and Classification of Apple Fruit Diseases Using


 rot(sunken. brown spots) normal")


 A(R, G, B) : represents number of pixels")
 D(A,C)= D(A,B); D(B,C)= 0")
 Improve color histogram CCV computes two color histograms one")


")
")
")


![References [1] J. Hartman, “Apple Fruit Diseases Appearing at Harvest”, Plant Pathology Fact Sheet,](https://slidetodoc.com/presentation_image_h/33c52551891a91cf1ea71d4163f66ddc/image-25.jpg "References [1] J. Hartman, “Apple Fruit Diseases Appearing at Harvest”, Plant Pathology Fact Sheet,")
- Slides: 25
Detection and Classification of Apple Fruit Diseases Using Complete Local Binary Patterns 學生: 陳建宇 指導教授: 丁建均 教授
Outline 秘密任務 Framework Training apple fruit images Image segmentation Feature extraction Training by multi-class SVM Result Future work Q&A
Framework
Training apple fruit images scab gray. brown blotch (irregular) rot(sunken. brown spots) normal
Image Segmentation K-means
Procedure Step 1. Read input image. Step 2. Transform image from RGB to L*a*b* color space. Step 3. Classify colors using K-Means clustering in 'a*b*'space. Step 4. Label each pixel in the image from the results of K-Means. Step 5. Generate images that segment the image by color. Step 6. Select the segment containing disease.
First cluster Fourth cluster
Image Segmentation Result
Feature Extraction Global Color Histogram (GCH) A(R, G, B) : represents number of pixels in color D: sum of Euclidean distances. The larger the distance value, the less similar the images are
Global Color Histogram (GCH) D(A,C)= D(A,B); D(B,C)= 0
Color Coherence Vector (CCV) Improve color histogram CCV computes two color histograms one for coherent pixels another for incoherent pixels
Feature extraction algorithm 1. Blur the image (by replacing each pixel’s value with the average value of the 8 adjacent pixels surrounding that pixel). 2. Discretize the color-space (images’ colors) into n distinct color. 3. Classify each pixel either as coherent or incoherent. This is computed by *Find connected components for each discretized color. * Determine tau’s value (Tau is a user-specified value (Normally it’s about 1% of image’s size)). * Any Connected Component has number of pixels more than or equal to tau then its pixels are considered coherent and the others are incoherent. 4. For each color compute two values (C and N). *C is the number of coherent pixels. *N is the number of incoherent pixels. *It’s clear that the summation of all color’s C and N = number of pixels.
Now we’ll discretize the colors to only three colors (0: 9, 10: 19, 20: 29). Assuming that our tau is 4: 1. For color 0 we have 2 CC (8 coherent pixels) 2. For color 1 we have 1 CC (8 coherent pixels) 3. For color 2 we have 2 CC (6 coherent pixels and 3 incoherent pixels) So finally our feature vector is
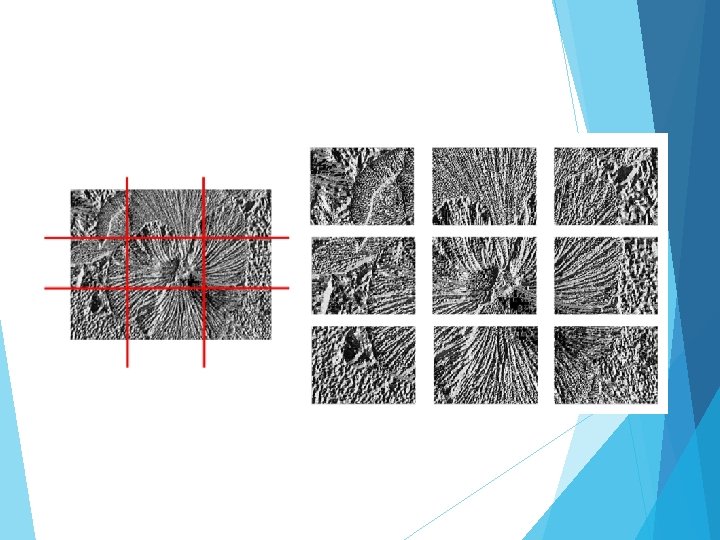
Local Binary Pattern (LBP)
Local Binary Pattern (LBP)
Complete Local Binary Pattern (CLBP)
Training by multi-class SVM • SVM
multi-class SVM
Result
Result
CONCLUSIONS The proposed approach is composed of mainly three steps. In the first step image segmentation is performed using K-Means clustering technique. In the second step features are extracted. In the third step training and classification are performed on a Multiclass SVM. They have used three types of apple diseases namely: Apple Blotch, Apple Rot, and Apple Scab. Based on the experiments, we have found that normal apples are easily distinguishable with the diseased apples and CLBP feature shows more accurate result for the classification of apple fruit diseases and achieved more than 93% classification accuracy. Further work includes consideration of fusion of more than one feature to improve the output of the proposed method.
References [1] J. Hartman, “Apple Fruit Diseases Appearing at Harvest”, Plant Pathology Fact Sheet, College of Agriculture, University of Kentucky, http: //www. ca. uky. edu/agcollege/plantpath ology/ext_files/PPFShtml/PPFS-FR-T-2. pdf, viewed on December 2011. [2] Q. Li, M. Wang, and W. Gu, “Computer vision based systemfor apple surface defect detection, ” Computers and. Electronics in Agriculture, vol. 36, pp. 215– 223, Nov. 2002. [3] Shiv Ram Dubey, and Anand Singh Jalal, ” Detection and Classification of Apple Fruit Diseases using Complete Local Binary Patterns”, 23 -25 Nov. 2012.