Detecting Harmonic Oscillations In Process Measurements Using Spectral


- Slides: 16
Detecting Harmonic Oscillations In Process Measurements Using Spectral Envelope Bhushan Gopaluni Matrikon Inc, Richmond, Canada
Overview • Oscillations in Process Measurements • Literature Review • Spectral Envelope • Industrial Case Study • Conclusions
Oscillations in Process Measurements • Oscillations in multiple process Measurements are observed • Poor controller tuning • Sticky Valves • Disturbances • Oscillations would lead to decrease in throughput • Wear and tear on the valves
Oscillations in Process Measurements • Oscillations spread through the process making it to identify the source • A typical plant would have a number of oscillating loops • Useful to group measurements oscillating with sim harmonics • A first step in identifying the source
Literature • N. F Thornhill, S. L Shah, B Huang, and A Vishnu Spectral principal component analysis of dynam process data. Control Engineering Practice, 200 • Use spectral PCA method to group oscillatin measurements. • B Kedam. Time series analysis by higher order crossings. IEEE Press, 1993 • Determine from zero crossings in time doma
Literature • N. F Thornhill and T Hagglund. Detection and diagn of oscillation in control loops. Control Engineering Practice, 5: 1343– 1354, 1997. • Use autocovariance function and integrated absolute error. • Rely on number of zero crossings of the autoco function
Spectral Envelope • A elegant method to find similarities in time series • Can be used to detect measurements with similar harmonics • D. S Stoffer. Detecting common signals in multiple time series using the spectral envelope. Journal of the American Statistical Association, 94(448): 1341– 1356, 1999.
Spectral Envelope • The spectrum of a time series depends on the transformation used • Chooses a transformation that emphasizes period features in a time series • Very easy to interpret visually when a number of ti data are analyzed
Spectral Envelope
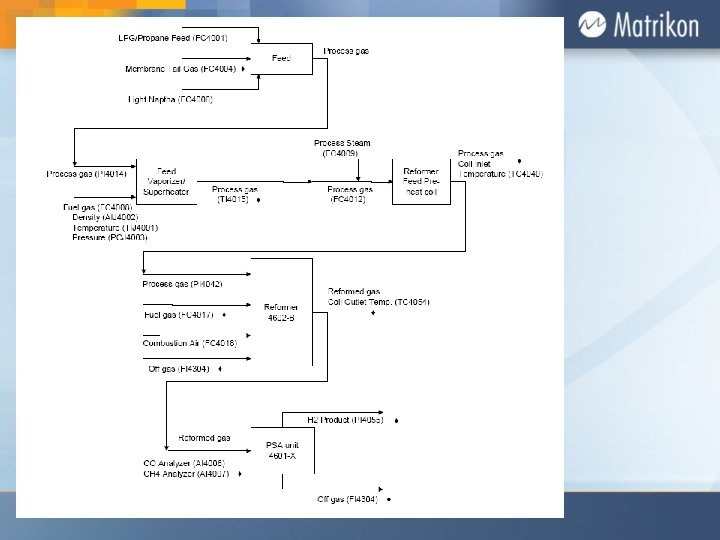
Industrial Case Study
• Example is an Oil refinery experiencing a high degree of variation in the coil outlet temperature of the tubular reformer in the Hydrogen Generation Unit. • The main objectives of this study are: • To evaluate the current performance levels of the existing key controllers • To identify the source of oscillations in coil outlet temperature • We have used Matrikon’s Performance assessmenttool Process. Doctor
• Minimum variance based Performance Indices ar calculated
• The main input streams entering the reformer are • Fuel Gas (FC 4017) • PSA Off Gas (FC 4304) • Process Gas (FC 4012) • Cross-correlation functions were calculated between the coil outlet temperature and the input streams • Off-Gas flow and COT have similar spectra with a peak at about a period of 17 mins
• The spectral envelope of all the measurements is below Three peaks at perio 16. 67 min, 8. 33 min, 3. 32 min
Conclusions • Detecting oscillations and identifying their cause i important industrial problem • Idea of Spectral Envelope was introduced • Spectral Envelope chooses an optimal transformat on the data that emphasizes certain spectral characteristics • Presented an Industrial Case Study