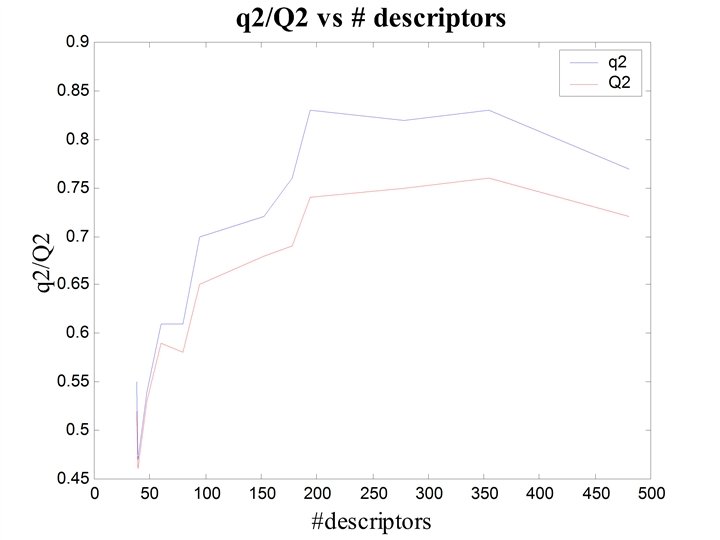
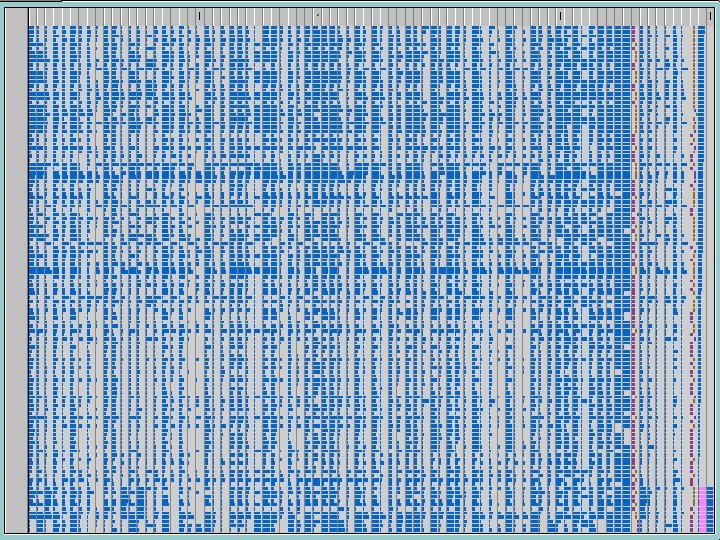
Detailed q 2Q 2 results for 100 bootstraps

Detailed q 2/Q 2 results for 100 bootstraps for final runs with (38 + dummy features)
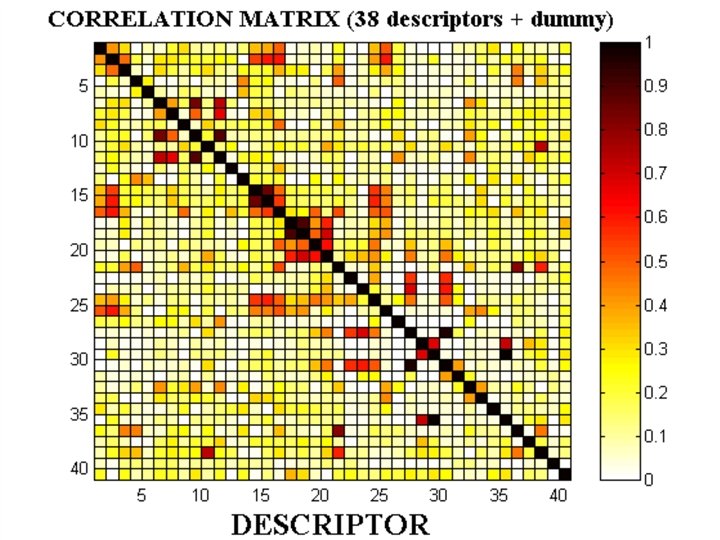

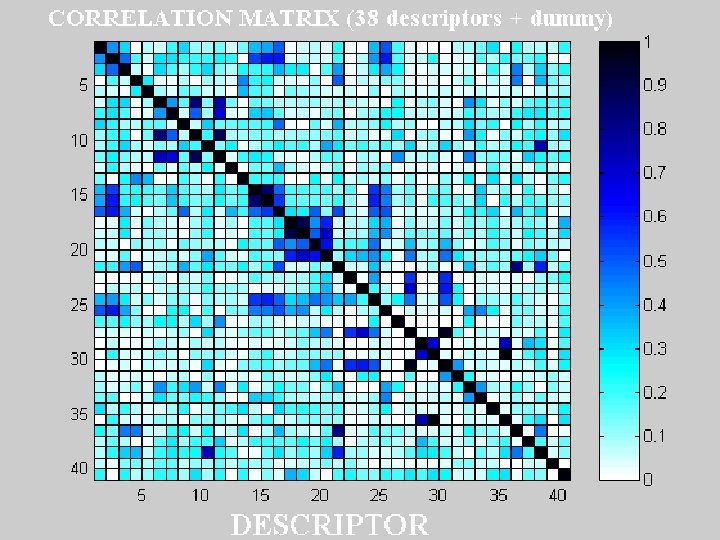
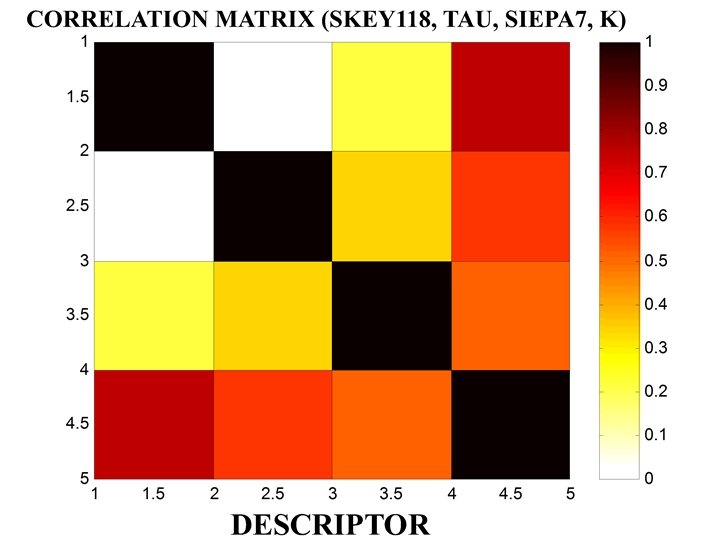
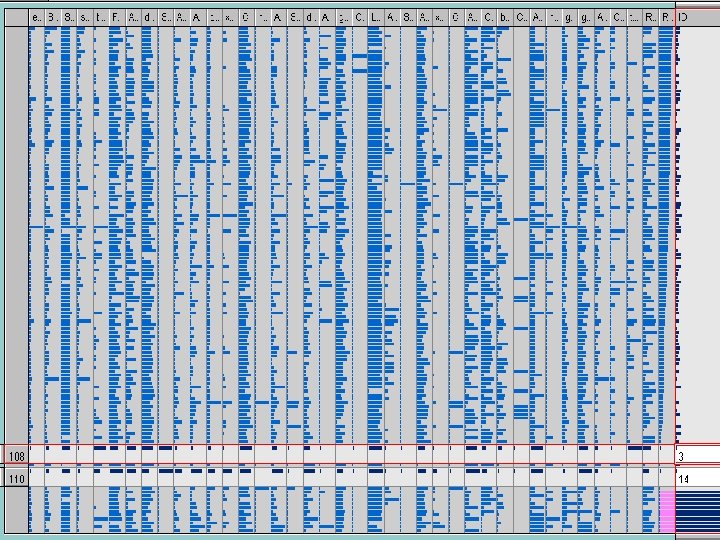
Ordered by correlation coefficient

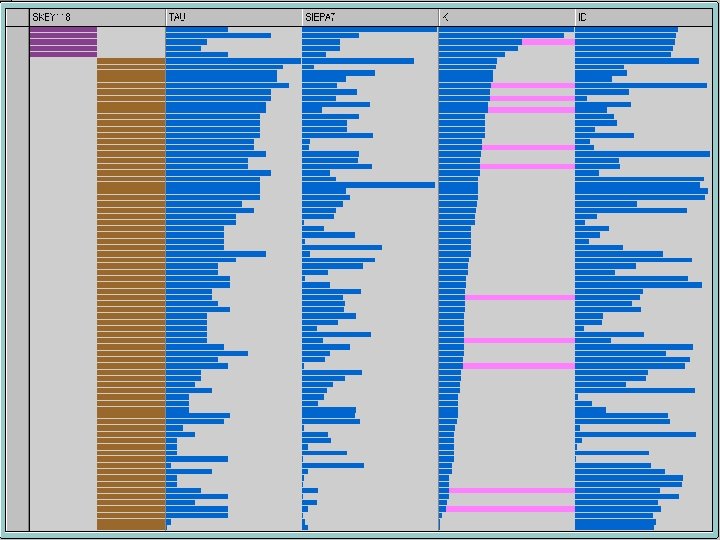
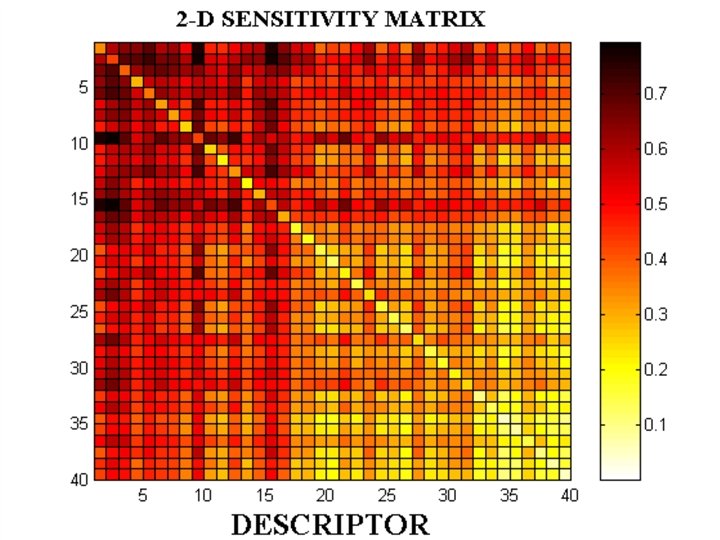
Example last pass feature Selection from 80 sensitivity bags Bagged relative sensitivity from 80 bootstraps for the random dummy variable: descriptors with lower sensitivities will be eliminated in the next iteration Random dummy variable Descriptors that will be eliminated in the next iteration

STRIPMINER OPERATION MODE Bootstraps with sensitivity analysis with a dummy var for descriptor selection (480 39 descriptors) Ensemble bagging for selected descriptors Note: all ANNs 39 x 13 x 11 x 1 trained to error of 0. 12 11 pats in validation set Bag prediction on test set Note: ensemble results weighted by Q 2 calculated in Mode#0 Mode #6: feature selection with sensitivity analysis (~ 1000 neural nets) (Q 2 = 0. 46, all molecules) Mode #0: train neural nets 300 bootstrap ANNs (300 neural nets trained) Mode #4: predict for test set using bagging weights (100 x 30/300 bags) (3000 ANNs in user mode)

REPEAT Stripminer Neural Network Sensitivity Analysis With Dummy Feature REPEAT 100 x Do neural network bootstrap And calculate Q 2 for validation set There is one random dummy feature There is a validation set for bagging Prepare file for sensitivity analysis (can be up to 30 MB) Run neural net in user mode for sensitivity analysis Calculate sensitivity results for 13 levels and tally results in sen#. txt Meta. Neural SENSIT CONTINUE Bag sensitivities Reduce features by dropping feats with lower sensitivity than dummy TEST Bagging and feature selection (repeat until the dummy variable is the least sensitive feature)

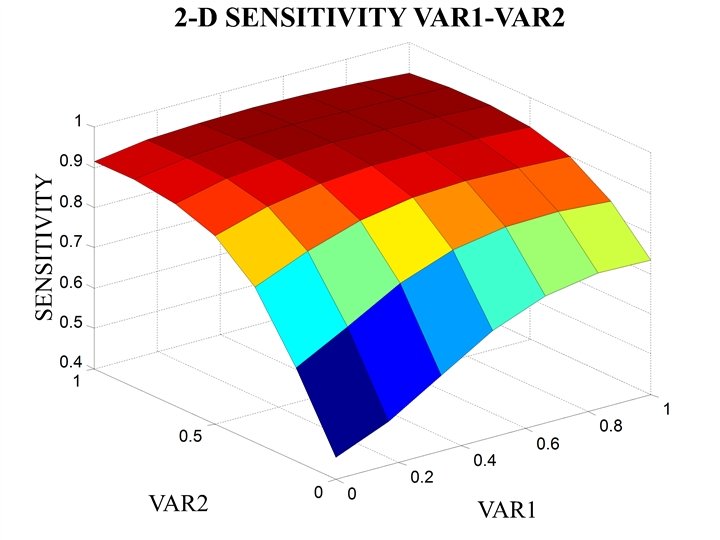
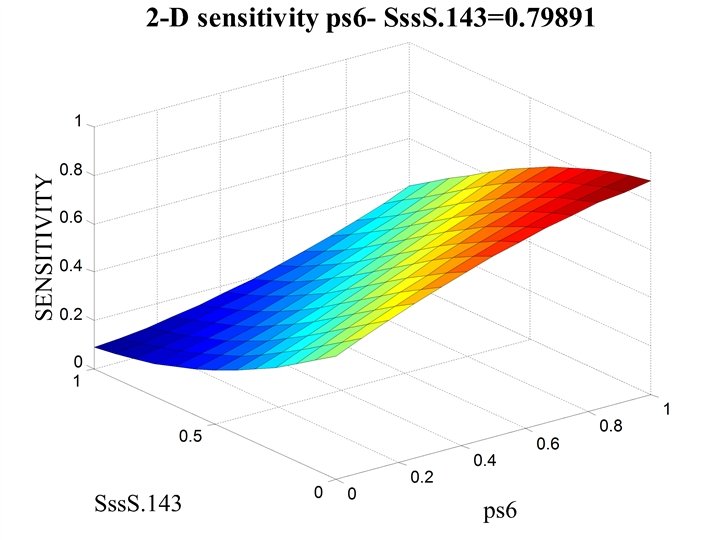
Neural Network Sensitivity Analysis Molecular weight w 11 Neural Network h w 11 H-bonding Hydrofobicity Electrostatic interactions Molecular Descriptor w 34 • • Boiling Point Biological response h w 23 Keep all inputs frozen at median values Turn one input at a time from 0 to 1 Monitor vaqiation in outputs Outputs with largest variation are most sensitive more important Observable Projection RENSSELAER
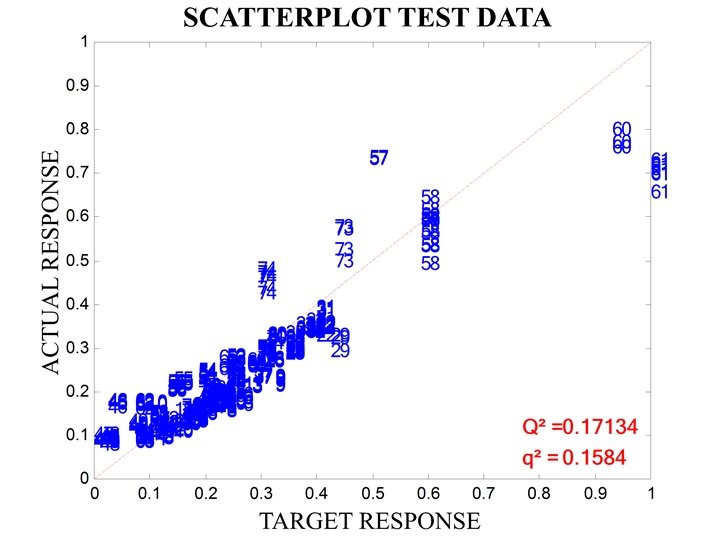

Correleation biased Sum of 30 best correlated variables seems to have spurious correlation
- Slides: 20