Designing the Perfect Science Fair Display Board Resources

Designing the Perfect Science Fair Display Board Resources: http: //science-fair-coach. com/ www. sciencebuddies. org

Ms. Pankotai’s Display Board Requirements for 8 th Graders: Boards MUST include the following sections: Title Testable Question Hypothesis Independent Variable Dependent Variable Constant Variables Materials Procedure Data Table --use Excel Graph – use create-a-graph website Conclusion Optional: Research (depends on the experiment you select to present) Data Analysis Pictures/Diagrams/Illustrations HIGHLY RECOMMENDED *SEE NEXT SLIDE for information on font selection! Resources: http: //science-fair-coach. com/ www. sciencebuddies. org

Examples and ideas are on the following slides…

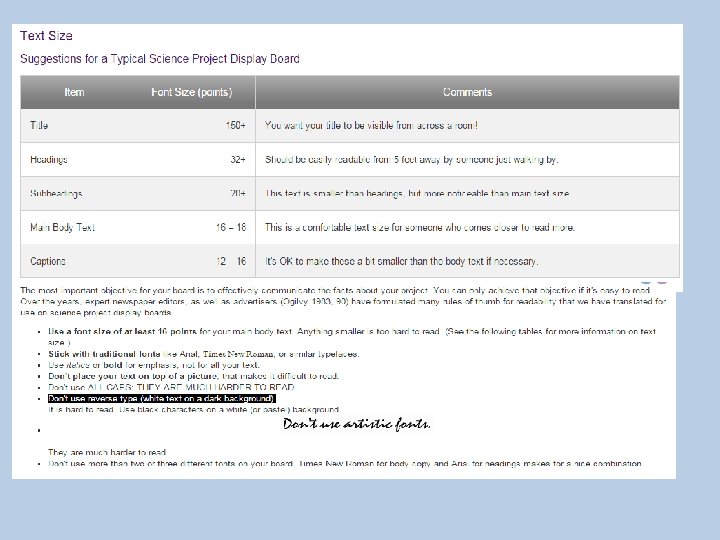
One Idea… FONT RULES Click here for a great site to help you design your board!

Another Idea…

Choose 1 to 3 colors to make the display board attractive, but not too busy or distracting. Your title should be EASILY read from a distance of 6 to 10 feet away. Pictures of the process and results will also make the board more attractive and draw viewers to your project.
 Here is a great example of an attractive board with a good balance")
) Here is a great example of an attractive board with a good balance of art and science. Some things to notice: -a catchy title -a clear testable question -logical and expected order of sections from left to right -the data and photos highlighted “center stage” -used only a few colors (in this case yellow and black to mimic the bees) -great use of photos to “tell her story” -just a touch of artistic flair (if there is too much “art” the project will look like an arts-n-crafts project and it might be interpreted as more art than science) http: //science-fair-coach. com/

What the Science Fair Judge won’t tell you Posted by Dr. Maille Lyons on December 16, 2011 As a judge, I will look at 20 to 50 projects at any given fair. Here is what you should do to ensure I am happy to be at your project board. 1. Put the title at the top of the center panel. If it is not there, I will get annoyed looking for it. I might even miss it and assume you have no title. 2. Do not use fancy fonts with swirls, circles, and scrolls. I have to review many boards and that will make my eyes hurt. I will probably just scan it and will miss key points. 3. Do not put anything longer than a heading on an angle. It will hurt my neck. I will not read it thoroughly because my neck will hurt more. 4. Double check your graphs for labeled axes (numbers AND units). It is one of the most common mistakes and I will take points off for it. Also, group your data by treatment (independent variable), not by trial to highlight variation in trial runs for each treatment. 5. Do not change your hypothesis to match your conclusion. I will be able to tell if you do. For example, if you predicted that the blue M&M would be the most common color picked out of a bag, and it was, you either were very lucky, or you did not write your prediction first. If you can not justify WHY you thought blue would be the most common, I will suspect that you did not want to reject your hypothesis, and so you changed it. 6. Make sure the board does not look like an arts & crafts project. As I scientist, I was not good at arts and crafts. I will think you spent more time decorating than experimenting.
- Slides: 10