Designing for Results Activity Results Framework Orientation March


 Multiple influences Long-term (Ultimate) outcome (changes")


 Review a Results Diagram for an Activity (redraw if")


 • Discuss the quality of the Results Measurement Table of")

 Evaluation: dependent on size and needs of the Activity")

- Slides: 29
Designing for Results: Activity Results Framework Orientation March 2016
What are Activity Results Frameworks? What are they for?
Source: Julie Smith
Purpose of session Improve understanding of what good Activity Results Frameworks look like. i. e. support: • Activity Design: agreed logic, intended results, approach for monitoring and evaluation • Activity Implementation/Management: learning, improvement, decision-making, accountability and communications - ‘inflight’ adjustments to ensure relevance and effectiveness in complex and dynamic contexts. -
3 Components of Activity Results Frameworks 1. Results Diagram 2. Results Measurement Table 3. Monitoring and Evaluation Work Plan
1. RESULTS DIAGRAM Purpose of a results diagram: • underlying logic or theory of change, informs design of outputs • how planned outputs expected to contribute desired outcomes • Based on good problem analysis (causes and consequences) • determines performance information needed from monitoring and evaluation
Results chain INPUT OUTCOME • Resources required: Money, People, Equipment, • Something being produced or delivered: services, capital goods and products • The change or improvement that occurs as a result: e. g. improved knowledge, practices, livelihoods • Can be purchased • Several levels: short, medium and long- term. • Cannot be purchased
Results Chain: example (opening up the ‘black box’) Multiple influences Long-term (Ultimate) outcome (changes in state, social, economic, environmental addressing the problem/need) Medium-term (intermediate) outcomes (e. g. changes in behaviour) Short-term (immediate) outcomes (e. g. changes in skills, awareness, knowledge, attitudes…) Increased income and resilience of smallholder farmer households in South and South-West Tanna Improved productivity of smallholder farmers through improved production, processing and business management. External environmental, political, social, economic factors… Smallholder farmers adopt improved coffee and other crop production and processing techniques. Farmers, other implementing partners? Smallholder farmers have enhanced knowledge and understanding of improved coffee growing and processing techniques. Outputs (Services, products delivered by the Activity) Smallholder farmers received training in improved coffee growing practices and processing techniques Training provider
EXAMPLE 1 Goal: Improved livelihoods through increased protection of the environment Increased protection of immediate environment including coastlines (where applicable), and within villages Longterm outcome( s) Mediu m-term outcom es Tree and plant re-growth on previously unutilised or damaged soil Increased food security for community members and crops Fruit trees provide sources of food Improved animal management and increased production of eggs, poultry meat etc. Shortterm outcomes Tree planting initiatives are established successfully Communities have increased understanding of land/ coastal protection Outputs Fruit and stability trees planted All households have raised vegetable beds with newly planted crops Communities trained in Landcare, gardening, livestock and plantations Livestock is protected from predation (e. g. poultry) and contained to prevent damage to crops (e. g. pigs) Communities have increased understanding of land/ crop/ livestock management Livestock management techniques implemented Raised garden beds built
EXAMPLE 2
Process for developing Results Diagrams SOME TIPS • Workshop the diagram – in collaboration with key stakeholders • Usually takes back and forth – more than a single meeting • Test logic: Moving up the chain, ask WHY? Moving down the chain, ask HOW? For e. g: If we successfully provide teacher training, then the effect will be increased knowledge of students, because teacher knowledge of learning techniques is important to student learning. • Focus on logic, not measurability at this stage • Aim for shared understanding of the logic with key stakeholders before developing indicators, targets etc.
Group Exercise 1 (20 minutes) Review a Results Diagram for an Activity (redraw if needed): • Do we have adequate understanding of the problem, its causes, and consequences? • Is the intervention logic clear? Are there gaps in the logic? (leaps of faith? ) • Consider assumptions and risks: • Within scope - address in design? • Outside scope - monitor and mitigate?
Simple? Complex? Complicated? Ø Complexity and predictability of outcomes? Ø Evolving/changing risks? Opportunities?
How do we know adaptive management is appropriate? What does it mean for how we plan, monitor, evaluate and learn? Confident on solution Adaptive design and management: monitoring, evaluation and learning supporting fast feedback and response Traditional planning, project management, monitoring and evaluation Stable context Unstable context Move to another quadrant! Positive deviance? Not confident on solution Adaptive design and management: monitoring, evaluation and learning supporting experimentation and iteration
Programme Logic Long term outcomes X U V ? Short term outcomes E F A B ? H? G? ? ? Outputs Contextual: political, social, economic, environmental Y Z Medium term outcomes Influences C? ? Activity D? Ø Our ‘best guess’ of how outcomes will be achieved: honesty and humility? Ø Test, refine with in-country stakeholders: during concept, design, inception? Ø Regularly review based on evidence: • Are causal links and assumptions still valid? • Are outputs, indicators, and targets still appropriate?
Key questions for Activity management and Performance Assessment should drive M&E Question: What are the MFAT Activity Quality Criteria and how do they relate to Results and Monitoring and Evaluation?
Key questions for Activity management and Performance Assessment should drive M&E Key criteria from MFAT Activity Quality Policy 1. Relevance – doing the right things? Any changes to context that affect relevance of the outputs? 2. Effectiveness a) Outputs: quantity, quality, relevance, timeliness, coverage? b) Outcomes: § What difference is the Activity making? § Which aspects are working better, for whom, why? § Unintended consequences? § Key factors that helped or hindered achievement? § Lessons learned? What improvements can be made?
Key questions for Activity management and Performance Assessment should drive M&E Key criteria from Activity Quality Policy(cont’d) c) Cross cutting issues - Gender Equality & women’s empowerment, human rights, environment and climate change 4. Efficiency – is this Activity being managed/delivered cost effectively? Harmonisation/coordination to avoid duplication or maximise synergies? 5. Impact - extent to which contributing to long term outcomes? Beyond the life of most Activities 6. Sustainability – likelihood of benefits continue beyond MFAT funding?
2. RESULTS MEASUREMENT TABLE Purpose: sets out how the results identified in the results diagram will be assessed Suggested improvements in response to feedback: Ø to enhance ability to address performance questions in DAC criteria (relevance, effectiveness, efficiency, impact and sustainability): § Choose indicators that help assess these questions § supplement quantitative indicators (what and how many) with qualitative information to address evaluative questions (why, how, so what) Ø Separate baselines from targets for clarity Ø Separate data source from frequency of measurement
Example Results Measurement Table
Indicators Ø Clear and neutral: – number of training participants – quality of water Ø Balanced view of performance (quantity and quality) Ø Concise and meaningful: count what counts! Ø Use existing indicators where relevant and available (esp. for long term outcome indicators) Ø Where new data collection needed- include in M&E workplan
Baselines describe the situation prior to the intervention enabling us to measure change • Where not already available, baseline may need to be measured early in implementation- note in M&E workplan • Good baseline data enables us to set realistic targets
Targets • The quantity or quality that is intended to be achieved by a stated time period (what success, or achieving the result, looks like) • Are always time bound: Year 1, Year 2, Year 3, total • Often determined subjectively - it is important to have complete agreement with partners • How good is the target? look at baseline, similar Activities, data trends or by gaining opinions of partners, and /or stakeholders. – realistic and achievable – regular review required to ensure they remain so
Targets • Hard targets and soft targets – recognising we have greater control over results at output and short-term outcome level (compared to medium and long-term results), it is important to treat targets accordingly. Hard (or specific) targets should be agreed for outputs and short-term outcomes For example: 90% of water samples 150 people trained (80 women and 70 men). Soft (or directional) targets are usually more appropriate for medium and long-term outcomes For example: Improving educational achievement Decreasing rates of disease
Exercise 2 (20 minutes) • Discuss the quality of the Results Measurement Table of your Activity – Start with Outputs, then short term outcomes (the main focus of partner progress assessment and reporting) – Look for opportunities to align to some SRF Direct Indicators where relevant Tips: • Indicator must be neutral • Balance indicator focus on quality and quantity • Use consistent unit of measurement
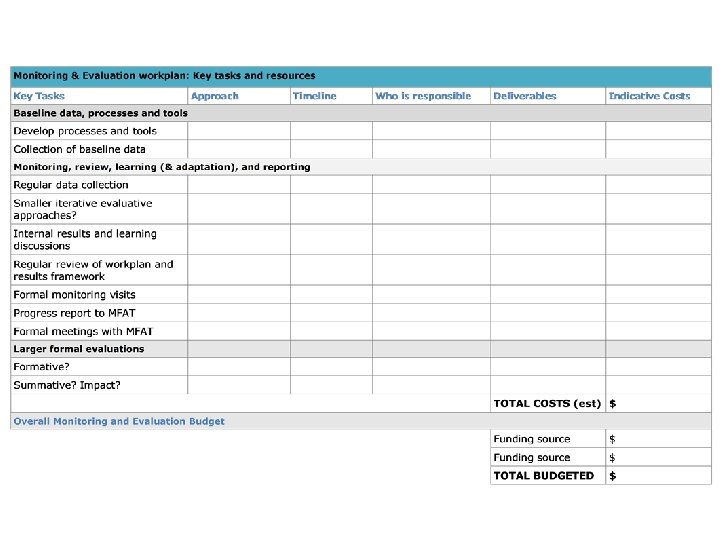
3. MONITORING AND EVALUATION WORKPLAN • Purpose: Implementation plan for M&E of an Activity – key tasks, responsibilities, timeframes and resources (est. 4 - 6% of budget) • Baseline data, processes and tools Ø Strengthening or creating monitoring systems, processes and capacity Ø Baseline data collection • Monitoring, review, learning and reporting Ø Regular data collection, monitoring visits Ø Regular results and learning discussions (incl review of Results Framework) and reporting: v review progress, issues, and lessons based on quantitative and qualitative evidence v informs workplan, and any adjustments to ensure relevance and effectiveness in complex/dynamic Aid context Ø Regular reporting
Monitoring and Evaluation Workplan (cont’d) Evaluation: dependent on size and needs of the Activity • What is and is not working well, and why, what improvements? • Formative or process evaluations- early in the life of an Activity, aim to inform and improve implementation • Summative or outcome evaluations- at the end of Activity (or later), aim to make a judgement about the value of an Activity, and identify lessons learned for other Activities • Could be led by Partner or MFAT • Independent evaluation commissioned by MFAT is mandatory for Activities >$10 M.
Conclusion: Activity Results Frameworks are not…. 1. An admin reporting burden Ø Relevant critical questions - for managing Activity, inform decisions, communicate results on relevance, effectiveness, efficiency, sustainability 2. Over-complicated and slow Ø Ø Adaptive Management of complex Activities in dynamic context (risks/opportunities)- frequent, timely feedback, formative evaluation Baking a cake, building a rocket, or raising a child? Predictability of outcomes, risks determines level of monitoring and evaluation 3. Rigid Ø Activity Results Frameworks (Results Diagram/Theory of Change, Outputs, Indicators, targets) regularly reviewed and updated to ensure relevance, and used for progress assessment and reporting 4. About counting widgets Ø Count what counts, not what can be easily counted. Quality, not just quantity. Also qualitative evidence (incl. informed perspectives of key stakeholders)