Design of Optical Digital Transmission Systems PointtoPoint Links


 • A rise-time budget analysis determines the dispersion limitation of an")
 14")

- Slides: 16
Design of Optical Digital Transmission Systems
Point-to-Point Links Key system requirements needed to analyze optical fiber links: 1. The desired (or possible) transmission distance 2. The data rate or channel bandwidth 3. The desired bit-error rate (BER) LED or laser (a) Emission wavelength (b) Spectral line width (c) Output power (d) Effective radiating area (e) Emission pattern MMF or SMF (a) Core size (b) Core index profile (c) BW or dispersion (d) Attenuation (e) NA or MFD pin or APD (a) Responsivity (b) Operating λ (c) Speed (d) Sensitivity
Selecting the Fiber Bit rate and distance are the major factors Other factors to consider: attenuation (depends on? ) and distance-bandwidth product (depends on? ) cost of the connectors, splicing etc. Then decide • Multimode or single mode • Step or graded index fiber
Selecting the Optical Source • Emission wavelength depends on acceptable attenuation and dispersion • Spectral line width depends on acceptable dispersion (LED wide, LASER narrow) • Output power in to the fiber (LED low, LASER high) • Stability, reliability and cost • Driving circuit considerations
Selecting the detector • Type of detector – APD: High sensitivity but complex, high bias voltage (40 V or more) and expensive – PIN: Simpler, thermally stable, low bias voltage (5 V or less) and less expensive • Responsivity (that depends on the avalanche gain & quantum efficiency) • Operating wavelength and spectral selectivity • Speed (capacitance) and photosensitive area • Sensitivity (depends on noise and gain)
Typical bit rates at different wavelengths Wavelength LED Systems LASER Systems. 800 -900 nm 150 Mb/s. km (Typically Multimode Fiber) 2500 Mb/s. km 1300 nm (Lowest 1500 Mb/s. km dispersion) 25 Gb/s. km (In. Ga. As. P Laser) 1550 nm (Lowest 1200 Mb/s. km Attenuation) Up to 500 Gb/s. km (Best demo)
Design Considerations • Link Power Budget – There is enough power margin in the system to meet the given BER • Rise Time Budget – Each element of the link is fast enough to meet the given bit rate These two budgets give necessary conditions for satisfactory operation
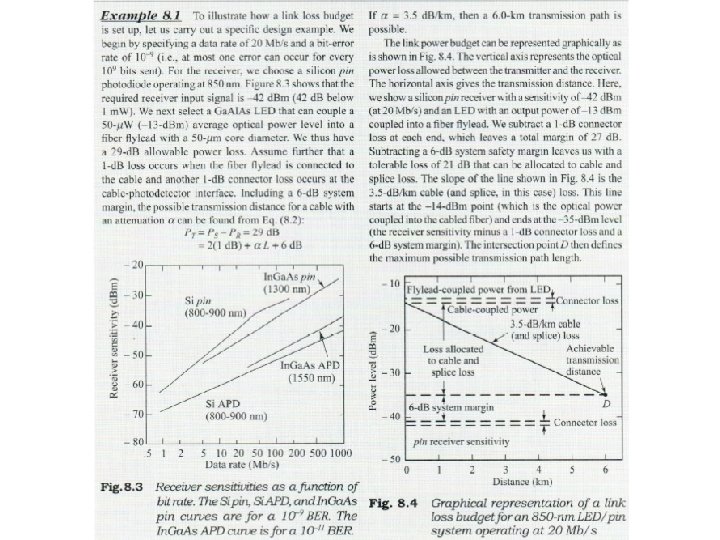
Optical power-loss model Try Ex: 8. 1
Power Budget Example • • • Specify a 20 -Mb/s data rate and a BER = 10– 9. With a Si pin photodiode at 850 nm, the required receiver input signal is – 42 d. Bm. Select a Ga. Al. As LED that couples 50 u. W into a 50 -μm core diameter fiber flylead. Assume a 1 -d. B loss occurs at each cable interface and a 6 -d. B system margin. The possible transmission distance L = 6 km can be found from PT = PS – PR = 29 d. B = 2 lc + αL + system margin = 2(1 d. B) + αL + 6 d. B • The link power budget can be represented graphically (see the right-hand figure).
Example: Spreadsheet Power Budget
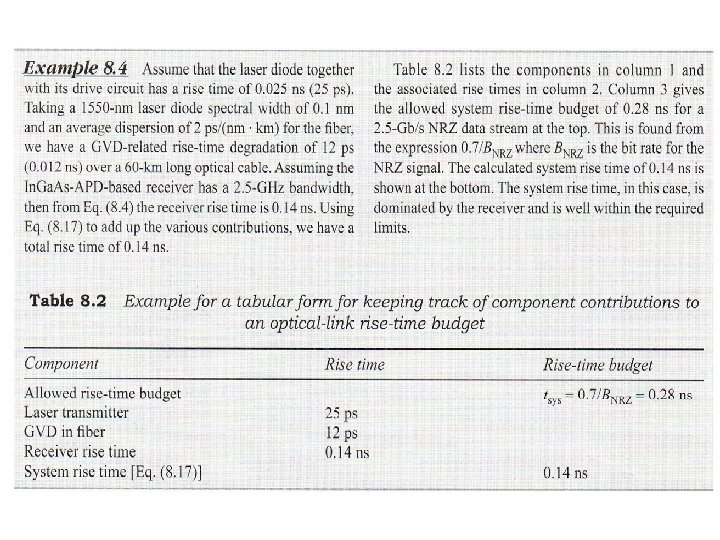
Rise-Time Budget (1) • A rise-time budget analysis determines the dispersion limitation of an optical fiber link. • The total rise time tsys is the root sum square of the rise times from each contributor ti to the pulse rise-time degradation: – – The transmitter rise time ttx The group-velocity dispersion (GVD) rise time t. GVD of the fiber The modal dispersion rise time tmod of the fiber The receiver rise time trx Here Be and B 0 are given in MHz, so all times are in ns. L: Link length D: Dispersion q: 0. 5 to 1
Rise-Time Budget (2) 14
Short-Wavelength Band Attenuation and dispersion limits on the transmission distance vs. data rate for a 770– 910 -nm LED/pin combination. • The BER was 10– 9 ; the fiber-coupled power was – 13 d. Bm up to 200 Mb/s. • The attenuation limit curve was derived by using a fiber loss of 3. 5 d. B/km • The receiver sensitivities shown in the left figure (8. 3) 16