Design and Performance of the Ice Cube Electronics

Design and Performance of the Ice. Cube Electronics R. G. Stokstad (Lawrence Berkeley National Laboratory) for the Ice. Cube Collaboration • High Energy Neutrino Astronomy • Ice. Cube Detector • DAQ and Electronics • Performance • Summary and Outlook Heidelberg, September 12, 2005

Goals of High Energy Neutrino Astronomy • Discover the origin of H. E. Cosmic Rays C. R. with energies up to 1020 e. V are observed. Where are they accelerated? Candidate sources: proton • SNe remnants, m. Quasars accelerators • Active Galactic Nuclei • Gamma Ray Bursts • Exotics (decays of topological defects. . . ) ? Guaranteed sources (from Cosmic Rays): • Atmosphere C. R. induced p & K decay) • Searches for exotica: • galactic plane: Wimps, C. R. interacting with ISM Monopoles, • Cosmos … C. R. interacting with CMB UHE p g D+ n p+ (p p 0)

H. E. Neutrino Detection Event reconstruction by Cherenkov light timing ~ km-long muon tracks from nm ~10 m-long cascades, ne nt neutral current Large volume, shielding => deep water/ice ~15 m Longer absorption length => larger effective volume

Detectors for High Energy Neutrino Astronomy AMANDA skyplot 2000 -2003 • • • AMANDA ANTARES BAIKAL ICECUBE NEMO NESTOR 3329 events below horizon 3438 events expected from atmospheric n’s An active and growing field including operating detectors, construction, and planned projects. KM 3 Net Cf. Session A 1 Tuesday, 11: 00 on NEMO electronics.

Site of AMANDA and Ice. Cube: Amundsen-Scott South Pole Station South Pole road to work Station facilities AMANDA 1500 m [not to scale] 2000 m Ic e. C ub e

Ice. Top Air shower array Ice. Cube • 70 -80 Strings • 4200 -4800 PMTs • Instrumented volume: ~1 km 3 (1 Gton) • Ice. Cube will detect neutrinos of all flavors at energies from 1011 e. V to 1020 e. V, and low energy n’s from supernovae Amanda String 21

Hose reel Drill tower Hot water generator The drilling site in January, 2005 Ice. Top tanks

Each 2 m dia. Ice. Top tank contains two Digital Optical Modules. The freezing of the water is done in a controlled manner to produce clear ice.

Ice. Cube’s First String: January 28, 2005 27. 1, 10: 08: Reached maximum depth of 2517 m 28. 1, 7: 00: preparations for string installation start 9: 15: Started installation of the first DOM 22: 36: last DOM installed 12 min/DOM 22: 48: Start drop 29. 1, 1: 31: String secured at depth of 2450. 80 m 20: 40: First communication to DOM

Ice Drives the Design • Surface temperatures -20 o. C -70 o. C • At-depth temperatures -35 o. C -10 o. C • Freeze-in subjects cables, connectors, optical modules to high stress • Inaccessibility requires reliability, remote operation --- • Once modules are deployed, have stable environment • No radioactivity in ice PMT rate < 1 k. Hz • Optical scattering relaxes timing requirements • Prototype string (41 Digital Optical Modules) deployed in Jan. 2000 (AMANDA -”String-18”)
 §")
‘Electronic’ Requirements • Quality data, maximum information, high information/noise (identify, analyze rare events) § Timing (ability to reconstruct tracks, locate vertices) 3 ns <7 ns rms § Waveform capture (all photons carry information) 300 MHz (for 400 ns), 40 MHz (for 6. 4 msec) § Charge dynamic range (energy resolution) ~500 PE/15 ns >200 PE/15 ns § Onboard calibration devices LEDs for int. & ext. calibration. Electronic pulser § Hardware local coincidence in the ice Nearest and next-nearest neighbor § Communications signaling rate to surface 1 Mbaud/twisted pair

‘Environmental’ Requirements • Robust equipment for a harsh environment copper cable, rugged connectors • Effective operation (reduce manpower at S. Pole) automatic, self-calibration; remote commissioning • Low power (fuel expensive at S. Pole) ≤ 5 W/DOM • Insensitivity to interference from other experiments at S. Pole: VLF, Radar Common mode rejection • Long life time > 10 years after completion Design for reliability • Minimize cost Two DOMs per twisted pair

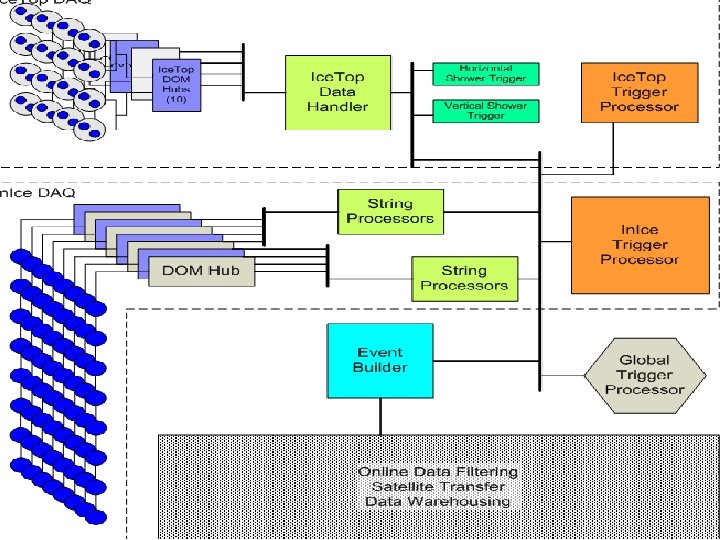
Ice. Cube DAQ Block Diagram Ethernet DAQ E L E C T R O N I C S PCI bus

The DAQ is based on the Digital Optical Module, a semiautonomous sensor/processor with high functionality. “Real-time” DAQ Elements GPS Master Clock Hub DOMs (60/string) SP (String Processor) DOM: “local time units” Hub: “ master time units” SP: transforms local time stamps to master time
 FPGA Pulser x 16 Delay ATWD x 2")
DOM MB Block diagram Trigger (2) FPGA Pulser x 16 Delay ATWD x 2 R 7081 -02 25 cm x 0. 25 x 2. 6 ATWD MUX OB-LED ADC 10 b 10 b CPU DP Ram 40 MHz 1 megabaud DOR 8 b x 9 f. ADC (n+1) (n– 1) 10 b DAC LPF +/-5 V, 3. 3 V, 2. 5 V, 1. 8 V DC-DC Configuration Device 32 b LC 8 Mbit SDRAM 16 Mb 20 MHz Oscillator Corning Frequency Ctl (was Toyocom) Monitor & Control DACs & ADCs 8 b, 10 b, 12 b 16 b CPLD PMT Power Flash 4 Mb 8 b Flasher Board 4 Mb 64 Bytes

Key Components Analog Transient Waveform Digitizer - ATWD • • Custom ASIC having high speed and low power consumption Switched capacitor array 4 channels x 128 samples deep, acquisition on launch Digitization: 10 bit, 30 ms /channel Variable sampling speed: 250 - 800 MHz Power consumption 125 m. W Design - S. Kleinfelder ~1996 (also used in Kam. LAND, NESTOR) 2 ATWD/DOM: 0. 25 W
 FPGA Pulser x 16 Delay ATWD x 2")
DOM MB Block diagram Trigger (2) FPGA Pulser x 16 Delay ATWD x 2 R 7081 -02 25 cm x 0. 25 x 2. 6 ATWD MUX OB-LED ADC 10 b 10 b CPU DP Ram 40 MHz 1 megabaud DOR 8 b x 9 f. ADC (n+1) (n– 1) 10 b DAC LPF +/-5 V, 3. 3 V, 2. 5 V, 1. 8 V DC-DC Configuration Device 32 b LC 8 Mbit SDRAM 16 Mb 20 MHz Oscillator Corning Frequency Ctl (was Toyocom) Monitor & Control DACs & ADCs 8 b, 10 b, 12 b 16 b CPLD PMT Power Flash 4 Mb 8 b Flasher Board 4 Mb 64 Bytes

Key Components, cont. Very stable crystal oscillator • • • Provides time stamp for launch of ATWD Clock for FPGA, CPU, FADC, DACs, ADCs Allan Variance typical ~1 x 10 -11 Toyocom 16. 6 MHz $ 7 used in AMANDA prototype Vektron/Corning 20 MHz $70 chosen for reliability, specs 10 -10, -40 o. C, tested Toyocom df/f Corning 2 • 10 -9
 FPGA Pulser x 16 Delay ATWD x 2")
DOM MB Block diagram Trigger (2) FPGA Pulser x 16 Delay ATWD x 2 R 7081 -02 25 cm x 0. 25 x 2. 6 ATWD MUX OB-LED ADC 10 b 10 b CPU DP Ram 40 MHz 1 megabaud DOR 8 b x 9 f. ADC (n+1) (n– 1) 10 b DAC LPF +/-5 V, 3. 3 V, 2. 5 V, 1. 8 V DC-DC Configuration Device 32 b LC 8 Mbit SDRAM 16 Mb 20 MHz Oscillator Corning Frequency Ctl (was Toyocom) Monitor & Control DACs & ADCs 8 b, 10 b, 12 b 16 b CPLD PMT Power Flash 4 Mb 8 b Flasher Board 4 Mb 64 Bytes

Key Components, cont. FPGA + CPU • Altera EPXA 4 • System On a Programmable Chip § FPGA • 400, 000 gates • 20, 40 MHz § CPU • • ARM 922 T 32 -bit processor Single Port SRAM 128 Kbytes Dual Port SRAM 64 Kbytes 80 MHz • Power consumption 0. 5 - 0. 7 W Supports: control, communications, ATWD readout, data compression, calibration, …. .

Digital Optical Module Mainboard design, fabrication and testing by Lawrence Berkeley National Laboratory

Digital Optical Module HV generator HV PMT base LED flasher board main board 75 ns delay board 25 cm PMT 33 cm Benthosphere 4 W

Digital Optical Module LED flasher board main board DOM assembly facilities at U. Wisconsin, DESY-Zeuthen, U. Stockholm

Key Components, cont. The ~ 3 km Cable • • 0. 9 mm copper wire Twisted quad configuration 145 Ohm impedance DC resistance < 140 Ohm/2. 5 km (cold) low cross talk between twisted pairs is essential § > 50 db suppression near end cross talk § > 30 db suppression far end cross talk § Requires careful mechanical construction. 45 mm Two twisted pair per quad
 96 V Power Control Ch 0. . Ch")
Surface Front-End Readout Card (“DOR” card) 96 V Power Control Ch 0. . Ch 3 On Cur Vol DOM quad cable Comm. Ch 0 ADC / DAC PLL 20 MHz In_sel Comm. FPGA Comm. Ch 1 ADC / DAC In 0 In 1 10 MHz SRAM Cfg Comm. Ch 2 ADC / DAC DOM quad cable Osc. 10 MHz 1 PPS Timestring 1 MByte Local Bus Comm. Ch 3 ADC / DAC PCI FPGA Cfg Req PLD FLASH 2 MByte JTAG PLD FPGA JTAG PCI Bus Mem. Bus Readout Card design, fabrication, testing by DESY-Zeuthen
 Surface front-end readout card 0. 7 W/DOM")
DOR (Digital Optical module Readout) Surface front-end readout card 0. 7 W/DOM

DOM Hub services 1 String = 60 DOMs DOM Power Supplies Power Distr. Card Chassis Fans 8 DOR Cards ~300 W running 60 DOMs CPU GPS distr. Hard Drive

RELIABILITY • Goals and constraints § § 10 years operation after construction <0. 2%/yr complete failure, <1%/yr partial failure Inaccessibility of components after deployment Cost vs component quality (comm. , indust. , mil. ) • Use sound reliability & design practice § Parts selection • Derating • Preferred, qualified vendors • Special attention to key components § Quality fabrication (IPC 610 class 3 - used for medical, satellite applications) § Testing, and more Testing

Some reliability design consequences • Used industrial parts spec’d to -40 o. C • Tin-lead solder used wherever possible • Electrolytic caps replaced with higher reliability plastic caps • High stability crystal oscillator (~$7 Toyocom replaced by ~$70 Corning) • Found and replaced component types that did not operate properly at low temperature.

Testing Sequence • Mainboard Design Verification Testing § § Small number of boards tested Software test suite resident on Mainboard Extreme conditions - determine range of operation -80 o. C to +80 o. C, 30 G rms vibration • Mainboard Production Testing § All boards tested § Temperature cycling (+65 o. C to -50 o. C), vibration 7 G rms § Burn in 24 hours at +65 o. C 24 hours at -50 o. C § Integration testing with other DOM components • 3 km cable • PMT • Flasher board

Testing Sequence, cont. • Final Acceptance Testing of assembled DOMs § 14 days at temperatures down to -55 o C • Communications • Calibration • Timing with laser, fiber optic distribution Transport to South Pole • Retest all DOMs before deployment § Ambient temperature -25 o. C to -35 o. C

Performance • Time calibration • Detector verification with LED flashers • Muon reconstruction • Timing verification with muons • Coincidence events § Ice. Cube - Ice. Top § Ice. Cube - AMANDA

Time Calibration automatic, every few seconds In-ice DOMs Time Ice. Top for 76 DOMs

Timing verification with flashers 1. 74 ns rms All 60 DOMs {

Timing verification with flashers Photons going down 47 Photons going up

Some typical highmultiplicity muon events

Time calibration verification using muons The random and systematic time offsets from one DOM to the next are small, ≤ +/- 3 ns

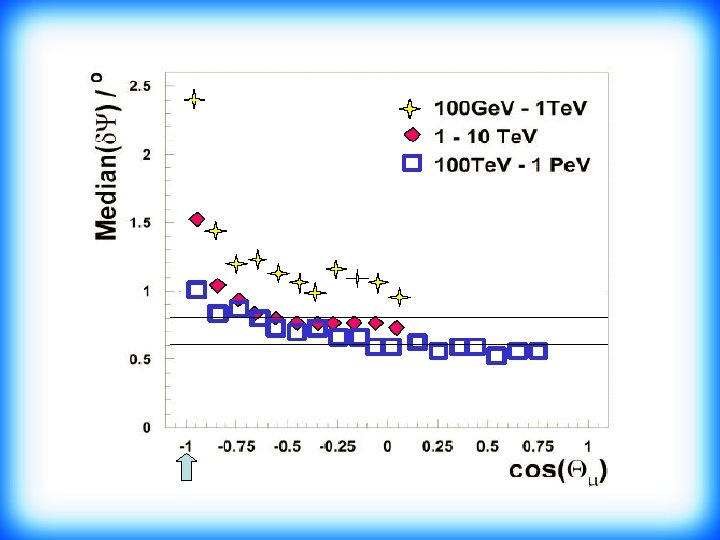
Ice. Cube muon data reconstruction

Ice. Top and in-ice coincidences The difference is due to shower curvature

AMANDA and in-ice coincidences Off-line search through GPS time-stamped AMANDA and Ice. Cube string- 21 events.

Summary • The first Ice. Cube string and four Ice. Top stations have been sucessfully deployed • All 76 DOMs function well • The overall detector timing uncertainty was measured to be <3 ns • Muons and air showers have been analyzed • The observed muon flux is consistent with the expectation from simulations • The first components of the Ice. Cube detector perform as expected, or better.
 • 2006 -07")
OUTLOOK • 2005 -06 up to 10 strings (Ice. Cube >AMANDA) • 2006 -07 14 -16 • 2007 -08 16 -18 • 2008 -09 16 -18 • 2009 -10 14 -18 71 -79 strings

THE ICECUBE COLLABORATION Sweden: USA: Bartol Research Institute, Delaware Univ. of Alabama Pennsylvania State University UC Berkeley UC Irvine Clark-Atlanta University Univ. of Maryland IAS, Princeton University of Wisconsin-Madison University of Wisconsin-River Falls Lawrence Berkeley National Lab. University of Kansas Southern University and A&M College, Baton Rouge Uppsala Universitet Stockholm Universitet UK: Imperial College, London Oxford University Netherlands: Utrecht University Germany: Universität Mainz DESY-Zeuthen Universität Dortmund Universität Wuppertal Universität Berlin Belgium: Université Libre de Bruxelles Vrije Universiteit Brussel Universiteit Gent Université de Mons-Hainaut Japan: Chiba university New Zealand: University of Canterbury (The Ice. Cube Collaboration now includes AMANDA)


Optical Scattering in S. P. Ice

Time calibration verification using muons • reconstruct muon tracks without DOM X • plot the time residual for DOM X for nearby reconstructed tracks • if optical scattering length is longer than the distance cut (10 m) the most likely residual should be 0, otherwise residual will show delay increasing with the amount of scattering. Time residual = (photon arrival time - reconstructed time*) *assuming no scattering.

Inside the DOM Hub From Master Clock Unit For GPS distribution DOR card DOR card Power Supplies Fans Monitors CPU DSB Card 10 MHz, 1 pps. Time String 10 MHz (Twisted Pair) 1 Pulse per Second (Twisted Pair) RS-232 Time String (Twisted Pair)
- Slides: 49