
Design and Implementation of a Low Cost Mini

- Slides: 38
Design and Implementation of a Low Cost Mini Weather Monitoring System By Ukhurebor K. E and Azi S. O Department of Physics, Edo University Iyamho, Edo State, Nigeria Presented at the 4 th. Annual International Conference of the Nigerian Geophysical Society (NGS) held at Bayero University, Kano, Nigeria 9 th -12 th May, 2017 1
Outline ü Introduction ü Literature review ü Statement of the problem ü Aim & Objectives ü Materials and Method ü Results and Discussion ü Findings ü Contribution to Knowledge ü Conclusion, Suggestions for Further Studies and Acknowledgement ü References 2
Introduction ü The study of weather is as old as the creation; it has always had a significant influence on the lives of people and shaped their cultures, habits, attitudes, behaviour and their environments in general. Weather is mostly influenced by the following factors: i. Location latitude ii. Elevation iii. Proximity to water bodies (Karl, 2014; Ukhurebor et al. , 2017). ü Weather has always been a universal concern and a major force of nature that has influenced mankind in a very authoritative approach for an elongated period of time and the recent changes in the climate are becoming issues of great concern (Akhilesh et al. , 2015; Parvez et al. , 2016). ü Man has always tried to find out the causes of different weather conditions he finds himself in and possibly monitor and forecast what the weather would be at any given time. Taking weather and trying to forecast it appropriately can make a difference for the survival and prosperity of the human race (Ukhurebor et al. , 2017; Karl, 2014). 3
Introduction (Cont’d) üThere cannot be a study of the weather neither its prediction without the knowledge of the prevailing conditions of the atmosphere (Satyanarayana and Mazaruddin, 2013; Susmitha and Sowmyabala, 2014). üWeather measuring, monitoring and forecasting holds great importance and has uses in several areas and for this reason man has always devise different means of measuring the various elements or parameters of the weather. üIn the ancient times before the advancement in science and technology, weather measurements, monitoring and predictions were mostly done by human experiences over the cloud cover and the movements of the wind. Those involve in agricultural activities were the ones mainly affected by the atmospheric weather conditions (Dushyant and Sanjeev, 2013). üBut with the advancement of technology, new methods and equipment have been developed to measure, collect and monitor weather information and today a whole field of study known as Meteorology is dedicated to it (Ukhurebor et al. , 2017). 4
Introduction (Cont’d) üMeteorology is the science of the atmosphere. Its domain is the lower atmosphere of the universe and its practice involves the daily cooperation of every action in the atmosphere of the universe (Akpan et al. , 2016). üIn meteorology, the data collected are used in monitoring and forecasting the weather; weather monitoring and forecasting which are useful in one way or the other in the course of our daily activities (Akpan et al. , 2016). üMeteorologically, weather is used to describe the momentary atmospheric conditions at a certain place. It is the state of the atmosphere of a given place at a particular time. Weather describes the condition of the atmosphere over a short period of time (Dushyant and Sanjeev, 2013). üThe climate of an area is known through the average weather over a long period of time. Climate describes the average weather conditions over a longer period of time usually calculated over a thirty year time period for a particular region and time period (Dushyant and Sanjeev, 2013). 5
Introduction (Cont’d) üIn describing the atmospheric conditions of a given place at any given time, certain weather elements or parameters must be known, measured and quantified (Pramod and Vaijanath, 2015; Popa and Iapa, 2011). üSome of the most crucial weather elements are temperature, relative humidity, atmospheric pressure, wind speed and direction, precipitation, luminous intensity. The weather and climate of any region is determined by these weather parameters and the seasons. üTemperature is a widely measured variable and is a very critical factor in determining the weather; because it influences and controls most of the elements of the weather (Akhilesh et al. , 2015). üThere is no doubt that an accurate measurement, proper observation and monitoring of the atmospheric conditions using standard meteorological instruments would help guide against the occurrences of most climate induced environmental disasters and improve agricultural productivity in our community (Okhakhu, 2014; Ukhurebor et al. , 2017). 6
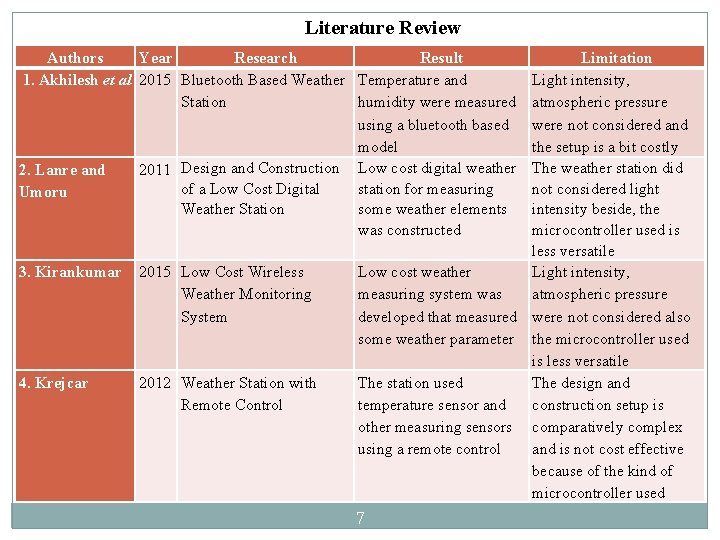
Literature Review Authors Year Research Result 1. Akhilesh et al 2015 Bluetooth Based Weather Temperature and Station humidity were measured using a bluetooth based model 2. Lanre and 2011 Design and Construction Low cost digital weather of a Low Cost Digital station for measuring Umoru Weather Station some weather elements was constructed 3. Kirankumar 2015 Low Cost Wireless Weather Monitoring System 4. Krejcar 2012 Weather Station with Remote Control Limitation Light intensity, atmospheric pressure were not considered and the setup is a bit costly The weather station did not considered light intensity beside, the microcontroller used is less versatile Low cost weather Light intensity, measuring system was atmospheric pressure developed that measured were not considered also some weather parameter the microcontroller used is less versatile The station used The design and temperature sensor and construction setup is other measuring sensors comparatively complex using a remote control and is not cost effective because of the kind of microcontroller used 7
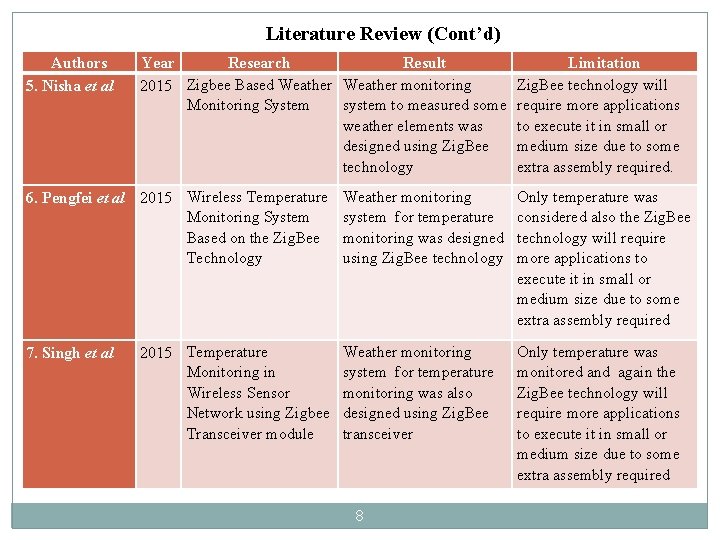
Literature Review (Cont’d) Authors 5. Nisha et al Year Research Result 2015 Zigbee Based Weather monitoring Monitoring System system to measured some weather elements was designed using Zig. Bee technology 6. Pengfei et al 2015 Wireless Temperature Monitoring System Based on the Zig. Bee Technology 7. Singh et al 2015 Temperature Monitoring in Wireless Sensor Network using Zigbee Transceiver module Limitation Zig. Bee technology will require more applications to execute it in small or medium size due to some extra assembly required. Weather monitoring system for temperature monitoring was designed using Zig. Bee technology Only temperature was considered also the Zig. Bee technology will require more applications to execute it in small or medium size due to some extra assembly required Weather monitoring system for temperature monitoring was also designed using Zig. Bee transceiver Only temperature was monitored and again the Zig. Bee technology will require more applications to execute it in small or medium size due to some extra assembly required 8
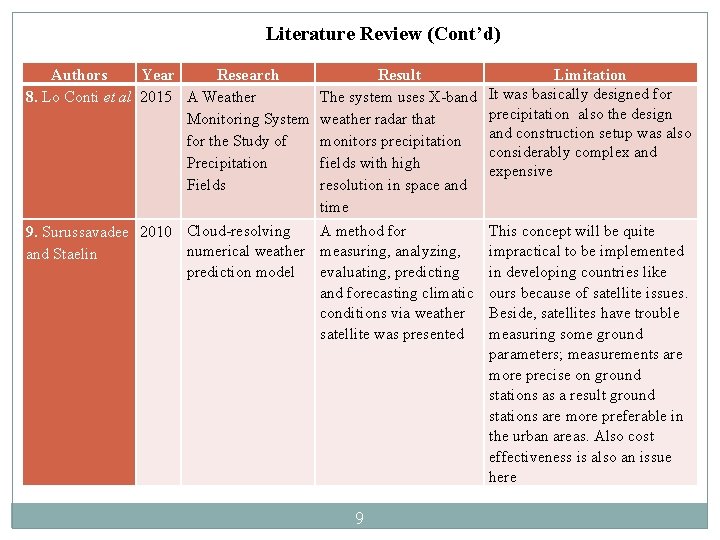
Literature Review (Cont’d) Authors Year Research 8. Lo Conti et al 2015 A Weather Monitoring System for the Study of Precipitation Fields Result The system uses X-band weather radar that monitors precipitation fields with high resolution in space and time A method for 9. Surussavadee 2010 Cloud-resolving numerical weather measuring, analyzing, and Staelin prediction model evaluating, predicting and forecasting climatic conditions via weather satellite was presented 9 Limitation It was basically designed for precipitation also the design and construction setup was also considerably complex and expensive This concept will be quite impractical to be implemented in developing countries like ours because of satellite issues. Beside, satellites have trouble measuring some ground parameters; measurements are more precise on ground stations as a result ground stations are more preferable in the urban areas. Also cost effectiveness is also an issue here
Statement of the Problem üThe motivation for this work is centred on prevailing shortage of weather related data in most of our rural, remote and interior villages/communities in particular. The evidence of this fact could be seen in poor weather monitoring and forecasting that result in weather related environmental hazards that have some negative effects on agricultural activities also the destruction of lives and properties as a result of the unavailability in network of weather monitoring systems dedicated for weather services in these areas. üEven in some urban areas of the country where we have these weather monitoring systems and stations/devices, there are still some constraints; partly due to the high cost of importation. Also, operating and managing some of these imported weather monitoring systems and stations/devices requires high technical expertise making their use some how difficult even for public uses let alone private users like small-scale agriculturists/farmers, industrialists, researchers, travellers, schools and institutions. 10
Aim & Objectives üThe aim of this research is to design a cost effective, flexible and portable mini weather monitoring system that will be used to measure and monitor temperature, atmospheric pressure, relative humidity, light intensity, dew point temperature, altitude üThe objectives of this research work are to: 1. Design the circuit using Arduino Mega 2560 microcontroller with some modern reliable sensors and other components. 2. Write the code using the C++ computer programming language to program the Arduino Mega 2560 Microcontroller with other components. 3. Use the system to log in weather data to ensure that the device measures weather data periodically and log the data to a database. 4. Approximate the dew point temperature and calculate the altitude. 5. Compare the readings from the weather monitoring system with those from the Centre for Atmospheric Research (CAR) and online weather reports (Accu Weather Report). 11
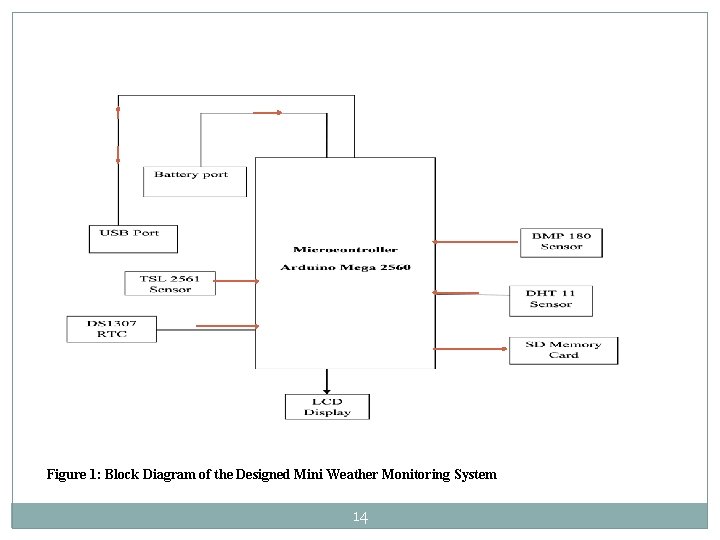
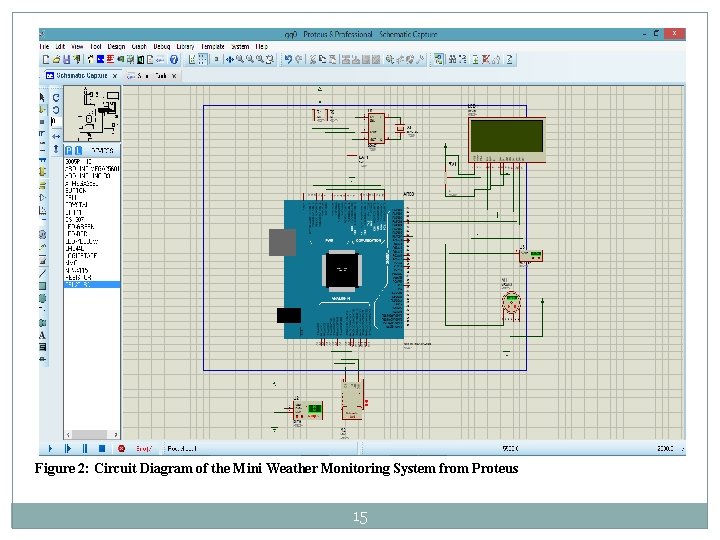
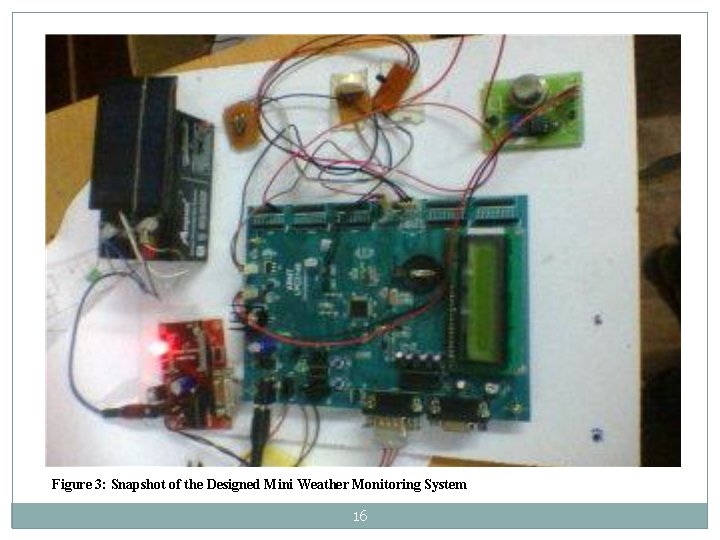
Materials and Method The project consists of two parts; the hardware and the software. üThe hardware implementation involves designing the circuit using Arduino Mega 2560 Microcontroller, Some Modern Reliable Sensor; DHT 11 Digital Temperature and Humidity Sensor, BMP 180 Pressure and Temperature Sensor and TSL 2561 Luminosity Sensor/Light Sensor, Data Logger which consist of the Real Timer (DS 1307), Memory Card, HD 444780 LCD, other Circuit Elements/ Materials like Connectors, Resistors; 1000Ω Pot Resistor, Fixed 470Ω Resistor and Power source. These components were properly selected to meet the Institute of Electrical and Electronic Engineering (IEEE) and other regulatory bodies on instrumentation standards for obtaining valid and accurate measurements. ü The software implementation involves; writing the code using the C++ computer programming language to program the Arduino Mega 2560 microcontroller with other components (simulation) from Proteus 8. üFigure 1 shows the method and approach of the system, Figure 2 shows the circuit diagram of the weather monitoring system from the simulation from Proteus 8, while Figure 3 shows the snapshot of the designed mini weather monitoring system. 12
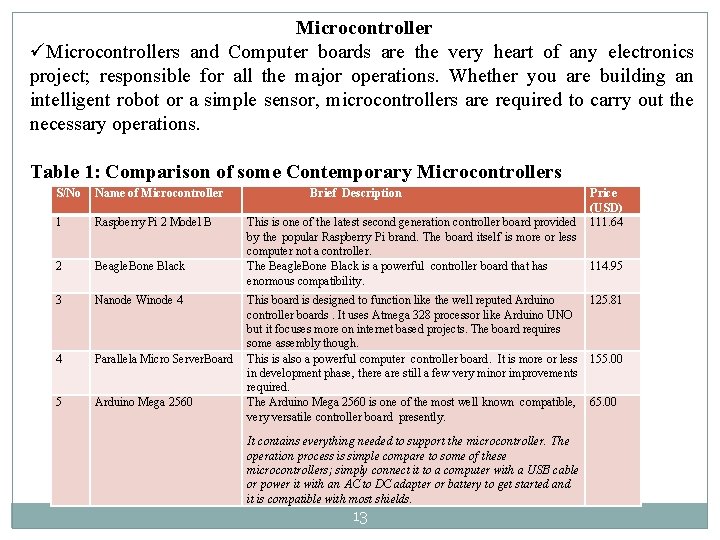
Microcontroller üMicrocontrollers and Computer boards are the very heart of any electronics project; responsible for all the major operations. Whether you are building an intelligent robot or a simple sensor, microcontrollers are required to carry out the necessary operations. Table 1: Comparison of some Contemporary Microcontrollers S/No Name of Microcontroller 1 Raspberry Pi 2 Model B 2 Beagle. Bone Black 3 Nanode Winode 4 4 Parallela Micro Server. Board 5 Arduino Mega 2560 Brief Description Price (USD) This is one of the latest second generation controller board provided 111. 64 by the popular Raspberry Pi brand. The board itself is more or less computer not a controller. The Beagle. Bone Black is a powerful controller board that has 114. 95 enormous compatibility. This board is designed to function like the well reputed Arduino 125. 81 controller boards. It uses Atmega 328 processor like Arduino UNO but it focuses more on internet based projects. The board requires some assembly though. This is also a powerful computer controller board. It is more or less 155. 00 in development phase, there are still a few very minor improvements required. The Arduino Mega 2560 is one of the most well known compatible, 65. 00 very versatile controller board presently. It contains everything needed to support the microcontroller. The operation process is simple compare to some of these microcontrollers; simply connect it to a computer with a USB cable or power it with an AC to DC adapter or battery to get started and it is compatible with most shields. 13
Figure 1: Block Diagram of the Designed Mini Weather Monitoring System 14
Figure 2: Circuit Diagram of the Mini Weather Monitoring System from Proteus 15
Figure 3: Snapshot of the Designed Mini Weather Monitoring System 16
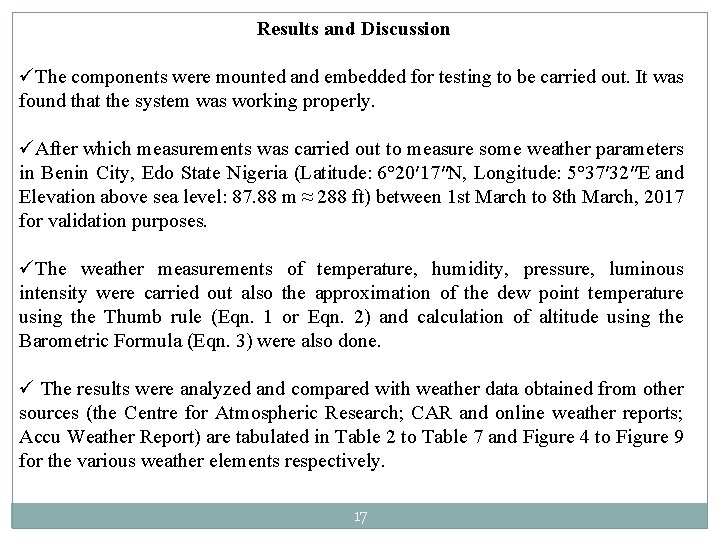
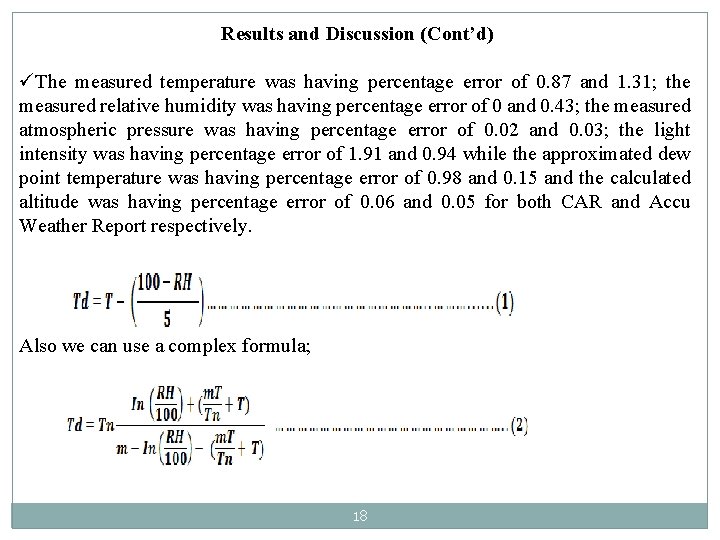
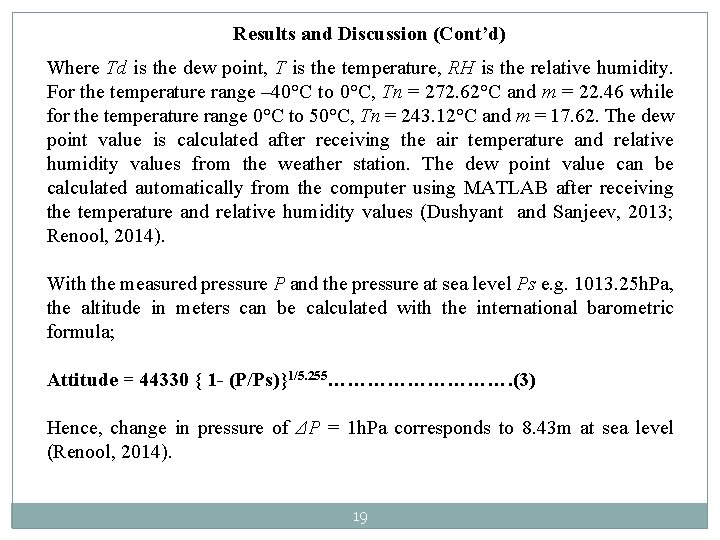
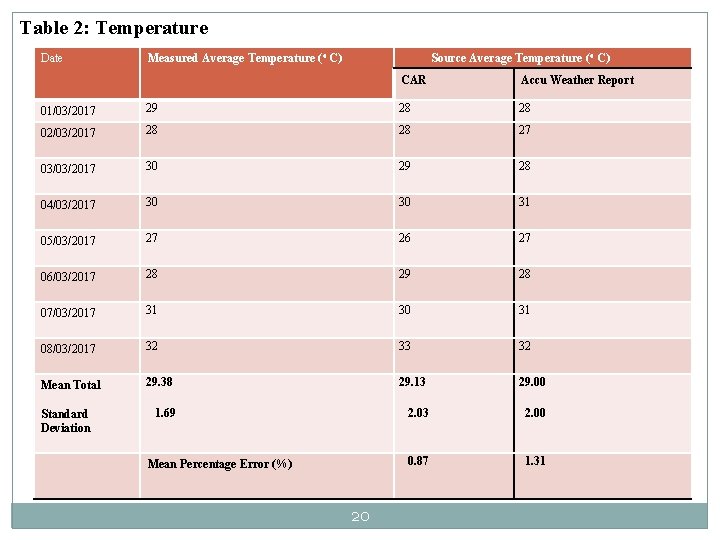
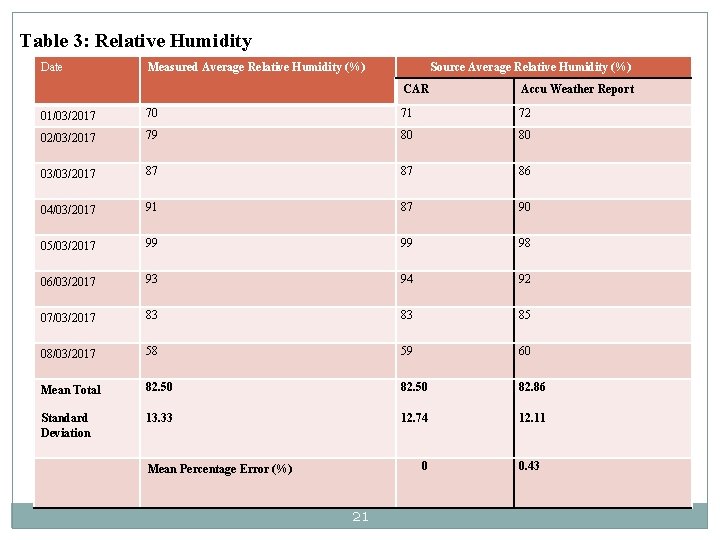
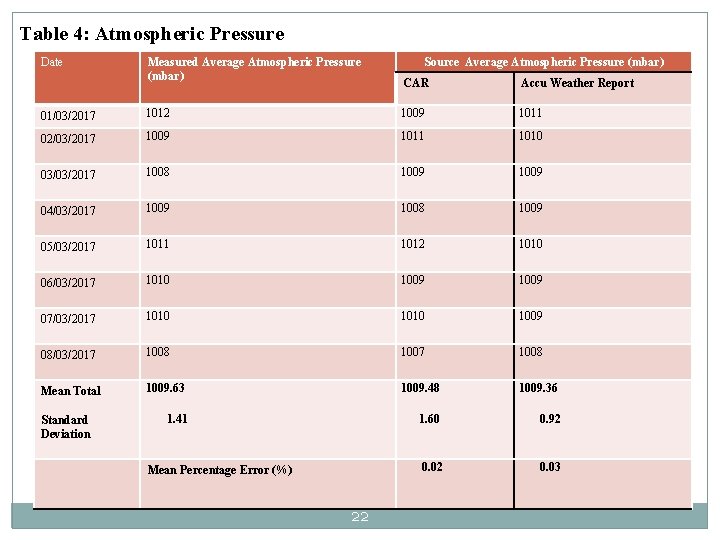
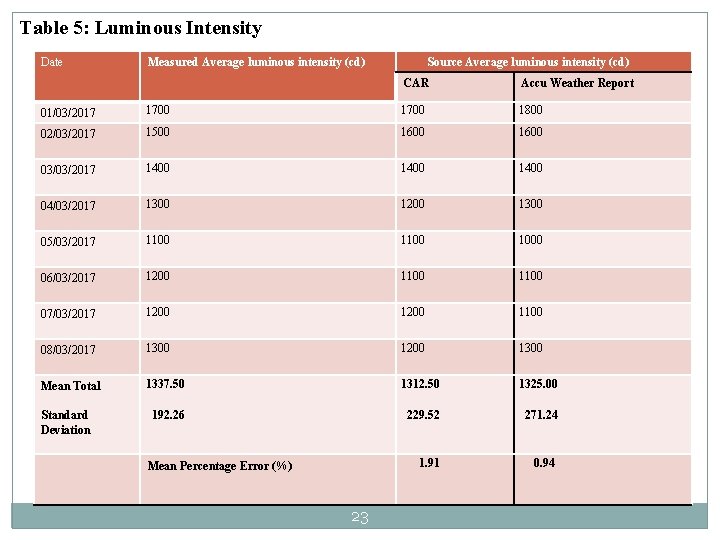
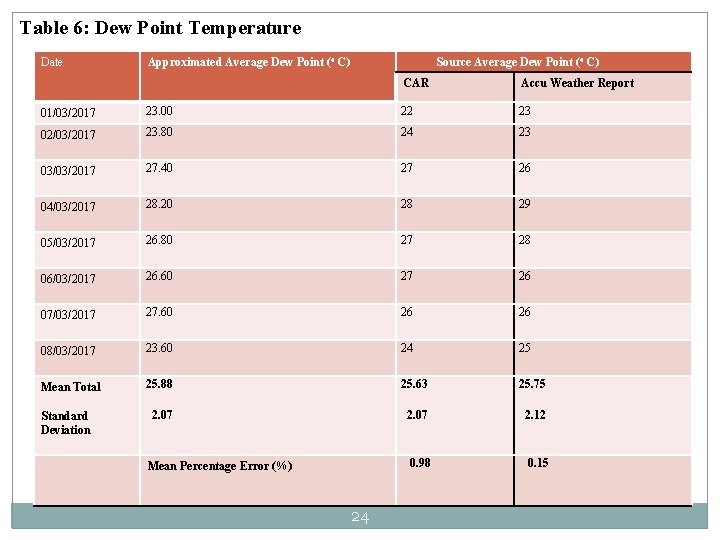
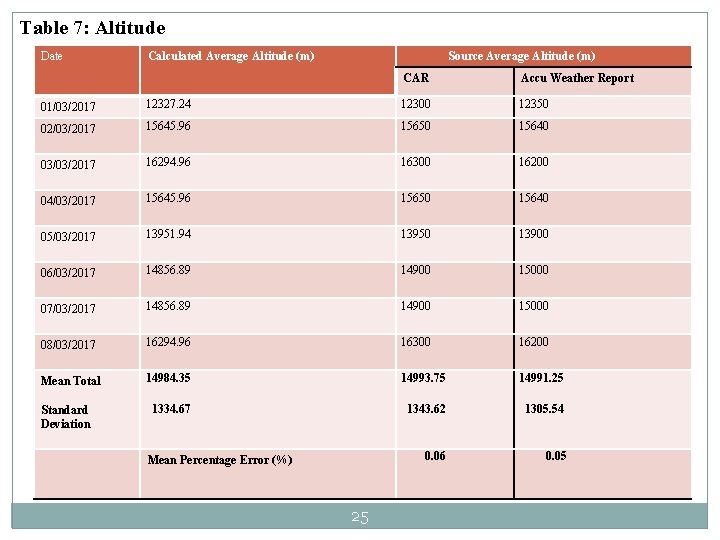
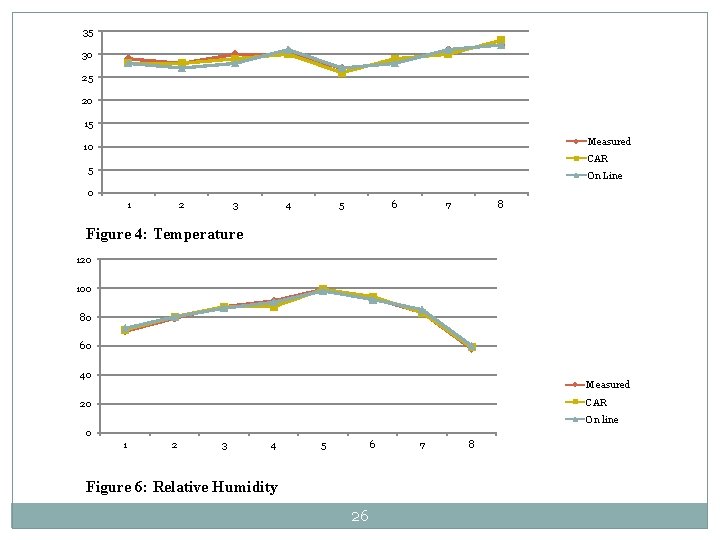
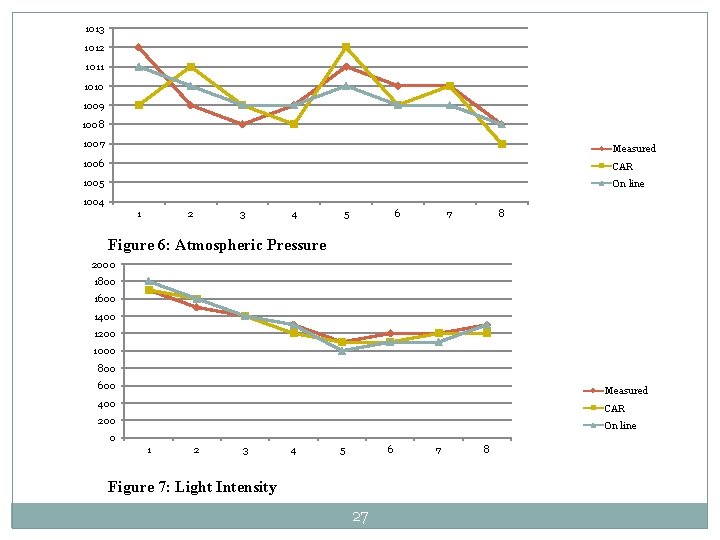
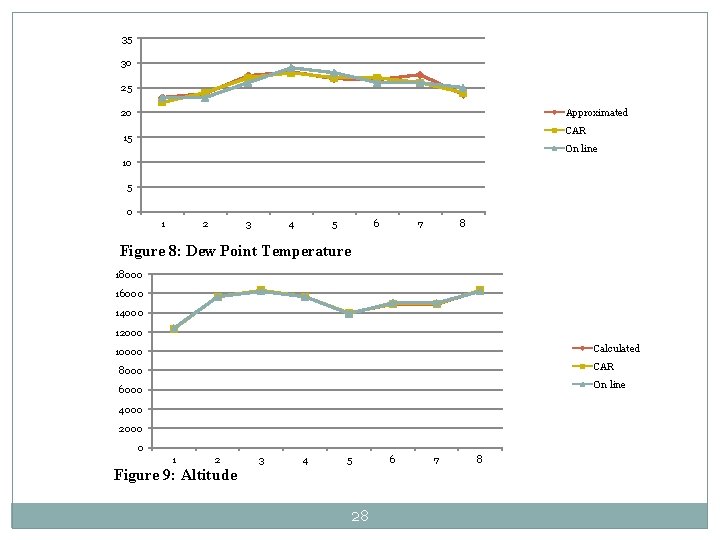
Results and Discussion üThe components were mounted and embedded for testing to be carried out. It was found that the system was working properly. üAfter which measurements was carried out to measure some weather parameters in Benin City, Edo State Nigeria (Latitude: 6° 20′ 17″N, Longitude: 5° 37′ 32″E and Elevation above sea level: 87. 88 m ≈ 288 ft) between 1 st March to 8 th March, 2017 for validation purposes. üThe weather measurements of temperature, humidity, pressure, luminous intensity were carried out also the approximation of the dew point temperature using the Thumb rule (Eqn. 1 or Eqn. 2) and calculation of altitude using the Barometric Formula (Eqn. 3) were also done. ü The results were analyzed and compared with weather data obtained from other sources (the Centre for Atmospheric Research; CAR and online weather reports; Accu Weather Report) are tabulated in Table 2 to Table 7 and Figure 4 to Figure 9 for the various weather elements respectively. 17
Results and Discussion (Cont’d) üThe measured temperature was having percentage error of 0. 87 and 1. 31; the measured relative humidity was having percentage error of 0 and 0. 43; the measured atmospheric pressure was having percentage error of 0. 02 and 0. 03; the light intensity was having percentage error of 1. 91 and 0. 94 while the approximated dew point temperature was having percentage error of 0. 98 and 0. 15 and the calculated altitude was having percentage error of 0. 06 and 0. 05 for both CAR and Accu Weather Report respectively. Also we can use a complex formula; 18
Results and Discussion (Cont’d) Where Td is the dew point, T is the temperature, RH is the relative humidity. For the temperature range – 40°C to 0°C, Tn = 272. 62°C and m = 22. 46 while for the temperature range 0°C to 50°C, Tn = 243. 12°C and m = 17. 62. The dew point value is calculated after receiving the air temperature and relative humidity values from the weather station. The dew point value can be calculated automatically from the computer using MATLAB after receiving the temperature and relative humidity values (Dushyant and Sanjeev, 2013; Renool, 2014). With the measured pressure P and the pressure at sea level Ps e. g. 1013. 25 h. Pa, the altitude in meters can be calculated with the international barometric formula; Attitude = 44330 { 1 - (P/Ps)}1/5. 255……………. (3) Hence, change in pressure of ΔP = 1 h. Pa corresponds to 8. 43 m at sea level (Renool, 2014). 19
Table 2: Temperature Date Measured Average Temperature ( o C) Source Average Temperature ( o C) CAR Accu Weather Report 01/03/2017 29 28 28 02/03/2017 28 28 27 03/03/2017 30 29 28 04/03/2017 30 30 31 05/03/2017 27 26 27 06/03/2017 28 29 28 07/03/2017 31 30 31 08/03/2017 32 33 32 Mean Total 29. 38 29. 13 29. 00 1. 69 2. 03 2. 00 0. 87 1. 31 Standard Deviation Mean Percentage Error (%) 20
Table 3: Relative Humidity Date Measured Average Relative Humidity (%) Source Average Relative Humidity (%) CAR Accu Weather Report 01/03/2017 70 71 72 02/03/2017 79 80 80 03/03/2017 87 87 86 04/03/2017 91 87 90 05/03/2017 99 99 98 06/03/2017 93 94 92 07/03/2017 83 83 85 08/03/2017 58 59 60 Mean Total 82. 50 82. 86 Standard Deviation 13. 33 12. 74 12. 11 0 Mean Percentage Error (%) 21 0. 43
Table 4: Atmospheric Pressure Date Measured Average Atmospheric Pressure (mbar) Source Average Atmospheric Pressure (mbar) CAR Accu Weather Report 01/03/2017 1012 1009 1011 02/03/2017 1009 1011 1010 03/03/2017 1008 1009 04/03/2017 1009 1008 1009 05/03/2017 1011 1012 1010 06/03/2017 1010 1009 07/03/2017 1010 1009 08/03/2017 1008 1007 1008 Mean Total 1009. 63 1009. 48 1009. 36 1. 41 1. 60 0. 92 0. 03 Standard Deviation Mean Percentage Error (%) 22
Table 5: Luminous Intensity Date Measured Average luminous intensity (cd) Source Average luminous intensity (cd) CAR Accu Weather Report 01/03/2017 1700 1800 02/03/2017 1500 1600 03/03/2017 1400 04/03/2017 1300 1200 1300 05/03/2017 1100 1000 06/03/2017 1200 1100 07/03/2017 1200 1100 08/03/2017 1300 1200 1300 Mean Total 1337. 50 1312. 50 1325. 00 192. 26 229. 52 271. 24 1. 91 0. 94 Standard Deviation Mean Percentage Error (%) 23
Table 6: Dew Point Temperature Date Approximated Average Dew Point (o C) Source Average Dew Point (o C) CAR Accu Weather Report 01/03/2017 23. 00 22 23 02/03/2017 23. 80 24 23 03/03/2017 27. 40 27 26 04/03/2017 28. 20 28 29 05/03/2017 26. 80 27 28 06/03/2017 26. 60 27 26 07/03/2017 27. 60 26 26 08/03/2017 23. 60 24 25 Mean Total 25. 88 25. 63 25. 75 2. 07 2. 12 0. 98 0. 15 Standard Deviation Mean Percentage Error (%) 24
Table 7: Altitude Date Calculated Average Altitude (m) Source Average Altitude (m) CAR Accu Weather Report 01/03/2017 12327. 24 12300 12350 02/03/2017 15645. 96 15650 15640 03/03/2017 16294. 96 16300 16200 04/03/2017 15645. 96 15650 15640 05/03/2017 13951. 94 13950 13900 06/03/2017 14856. 89 14900 15000 07/03/2017 14856. 89 14900 15000 08/03/2017 16294. 96 16300 16200 Mean Total 14984. 35 14993. 75 14991. 25 1334. 67 1343. 62 1305. 54 0. 06 0. 05 Standard Deviation Mean Percentage Error (%) 25
35 30 25 20 15 Measured 10 CAR 5 On Line 0 1 2 3 4 5 6 7 8 Figure 4: Temperature 120 100 80 60 40 Measured CAR 20 On line 0 1 2 3 4 5 6 Figure 6: Relative Humidity 26 7 8
1013 1012 1011 1010 1009 1008 1007 Measured 1006 CAR 1005 On line 1004 1 2 3 4 5 6 7 8 Figure 6: Atmospheric Pressure 2000 1800 1600 1400 1200 1000 800 600 Measured 400 CAR 200 On line 0 1 2 3 4 5 6 Figure 7: Light Intensity 27 7 8
35 30 25 Approximated 20 CAR 15 On line 10 5 0 1 2 3 4 5 6 7 8 Figure 8: Dew Point Temperature 18000 16000 14000 12000 Calculated 10000 CAR 8000 On line 6000 4000 2000 0 1 2 3 4 5 Figure 9: Altitude 28 6 7 8
Findings üFrom the results of this research, the following findings were made: 1. The results and data from the designed mini weather monitoring system were in good conformity with data obtained from other sources. 2. The temperature and relative humidity have influence on the dew point temperature. 3. The atmospheric pressure and relative humidity have influence on the altitude. 29
Contribution to Knowledge An affordable, effective, flexible, portable and simple mini weather monitoring system that will be use for measuring temperature, atmospheric pressure, relative humidity, light intensity have been designed that will be helpful in mitigating climate-induced environmental disasters and also aid in the improvement of agricultural productivity in our rural communities in particular. 30
Conclusion üIn this era of global warming, research in weather measurement, monitoring and forecasting are becoming more and more relevant; getting the latest weather forecast and taking the necessary precaution have become a major issue all over the world. üWeather monitoring plays an important role in human life, so the collection of information about the temporal dynamics of weather changes is very paramount. üThis research demonstrates the design and Implementation of an affordable mini weather monitoring system that ensures flexibility, portability, scalability and user friendly operations which can provide data of some weather variables including temperature, humidity, pressure, ambient light intensity with Real Time Data Logger also the dew point temperature was approximated for using the Thumb Rule and the altitude was calculated using the Barometric Formula. 31
Suggestions for Further Studies üWe conclude by outlining the following possible suggestions for future research: 1. Addition of more sensors to monitor other weather and environmental parameters with plans for expanding the range of weather data being measured. 2. The power requirements should be increased. This could be catered for by modifying the operation of the system to save energy also solar tracking, employing backup battery and connecting an additional source of power could also be considered. 3. Furthermore, the overall system robustness should be evaluated and statistically weather data should also be measured, collected, analyzed and evaluated so as to make appropriate and accurate monitoring and prognostications. 32
Acknowledgements üWe are grateful to the Centre for Atmospheric Research (CAR) under the auspices of the National Space Research and Development Agency (NASRDA) for their assistance hitherto. üWe are also grateful to the Management of Edo University Iyamho, Edo State, Nigeria. 33
References Akhilesh Chawla, Tejas Bangera, Chinmay Kolwalkar and Mahalaxmi Bhat (2015) ‘Bluetooth Based Weather Station ’. International Journal of Engineering Trends and Technology (IJETT), Volume 28, Number 2, Page 98 -101. Akpan Vincent A, Reginald O. A. Osakwe and Sylvester A. Ekong (2016) ‘A Hypothetical Database-Driven Web-Based Meteorological Weather Station with Dynamic Datalogger System’. Journal of Information Engineering and Applications ISSN 2224 -5782 (print) ISSN 2225 -0506 (online) Vol. 6, No. 1, Page 13 -39. Dushyant Pande and Sanjeev Gaba (2013) ‘Measurement And Transmission Of Atmospheric Parameters Using Radio Frequency’. Communication International Journal Of Technical Research And Applications E-ISSN: 2320 -8163, Volume 1, Issue 3, Page 85 -90. Karl Ingi Eyjólfsson (2014) ‘Portable Weather Station’. Final thesis for B. Sc. degree School of Engineering and Natural Sciences, Keilir Institute of Technology University of Iceland Reykjanesbær, Page 1 -113. Kirankumar G. Sutar (2015) ‘Low Cost Wireless Weather Monitoring System’. International Journal of Engineering Technology and Management Research, Vol. 1, No. 1, Page 48 -52. 34
References (Cont’d) Krejcar O (2012) ‘Low cost weather station with remote control’. Applied Machine Intelligence and Informatics (SAMI), 2012 IEEE 10 th International Symposium, doi: 10. 1109/SAMI. 2012. 6209011, Page 463 -468. Lanre Joseph Olatomiwa and Umoru Sam Adikwu (2012) ‘Design and Construction of a Low Cost Digital Weather Station ’. AU J. T. 16(2): Technical Report 125, Page 125 -132 Lo Conti F, Pumo D, Incontrera A, Framcipane A, Noto L. V and La Loggia G (2015) ‘A Weather Monitoring System for The Study of Precipitation Fields, Weather and Climate in an Urban Area’. 11 th International Conference on Hydroinformatics, DOI: 10. 13140/2. 1. 1723. 5847, Page 1 -8. Nisha Gahlot, Varsha Gundkal, Sonali Kothimbire and Archana Thite (2015) ‘Zigbee Based Weather Monitoring System’. The International Journal Of Engineering and Science , ISSN (e): 2319 -1813 ISSN (p): 2319 -1805, Volume 4, Issue 4, Page 61 -66. Okhakhu Poly Alens (2014) ‘Meteorological Services for Disaster Risk Prevention and Mitigation in Nigeria’ Journal of Environment and Earth Science ISSN 2224 -3216 (Paper) ISSN 2225 -0948 (Online) Vol. 4, No. 8, Page 66 -76. 35
References (Cont’d) Parvez S. H, Saha J. K, Hossain M. J, Hussain H, Ghuri Md M. A, Chowdhury T. A, Rahman M, Shuchi N. Z, Islam A, Hasan M and Paul B (2016) ‘A Novel Design and Implementation of Electronic Weather Station and Weather Data Transmission System Using GSM Network’ . Article in WSEAS Transactions on Circuits and Systems, Page 21 -34. Pengfei L, Jiakun L and Junfeng J (2010) ‘Wireless temperature monitoring system Based on the Zig. Bee technology’. 2 nd International Conference on Computer Engineering and Technology, Vol. 1, Page 160– 163. Popa M and Iapa C (2011) ‘Embedded weather station with remote wireless control’. Telecommunications Forum (TELFO R ) 22 -24, Page 297 - 300. Pramod Arvind Kulkarni and Vaijanath V. Yerigeri (2015) ‘An Economical Weather Monitoring System Based on GSM using Solar and Wind Energy’. International Journal of Advanced Technology and Innovative Research Volume. 07, Issue. No. 02, Page 263 -268. Roneel V. Sharan (2014) ‘Development of a Remote Automatic Weather Station with a PC-based Data Logger’. International Journal of Hybrid Information Technology Vol. 7, No. 1, Page 233 -240. 36
References (Cont’d) Satyanarayana G. V and Mazaruddin S. D (2013) ‘Wireless Sensor Based Remote Monitoring System for Agriculture Using Zig. Bee and GPS’. Conference on Advances in Communication and Control Systems, Page 110 -114. Singh R and Mishra S. (2010) ‘Temperature Monitoring in Wireless Sensor Network using Zigbee Transceiver Module’. International Conference on Power, Control and Embedded Systems (ICPCES), Page 1 -4. Surussavadee C and Staelin D. H (2008) ‘Global Millimeter-Wave Precipitation Retrievals Trained With a Cloud-Resolving Numerical Weather Prediction Model, Part I: Retrieval Design’. Geoscience and Remote Sensing, IEEE Transactions, Vol. 46, no. 1, Page 99 -108. Susmitha P and Sowmyabala G (2014) ‘Design and Implementation of Weather Monitoring and Controlling System’. International Journal of Computer Applications (0975 -8887) Volume 97, No. 3, Page 19 -22. Ukhurebor Kingsley E, Azi Samuel O, Abiodun Isaac C and Enoyoze Esosa (2017) ‘Approximation of the Dew Point Temperature Using a Cost Effective Weather Monitoring System’. Physical Science International Journal 14(3), Article no. PSIJ. 32862 ISSN: 2348 -0130 DOI: 10. 9734/PSIJ/2017/32862; Page 1 -6 37
THANK YOU FOR LISTENING AND MAY GOD ALMIGHTY BLESS YOU RICHLY 38