
Design and Computational Fluid Dynamic analysis of the


- Slides: 20
Design and Computational Fluid Dynamic analysis of the T 2 K Target Neutrino Beams and Instrumentation 6 th September 2006 Mike Fitton Engineering Analysis Group
Contents • • • Aims of Design Current Design Geometry CFD and Heat Transfer analysis Summary Future work Mike Fitton Engineering Analysis Group
Aims of Design • Graphite target to be completely encased in titanium to prevent oxidation • Helium should cool both upstream and downstream titanium window before target due to material limits • Pressure drop in the system should be kept to a minimum due to high flow rate required (less than 0. 7 bar) • Target to be uniformly cooled (but kept above 400°C to reduce radiation damage) • It should be possible to remotely change the target in the first horn Mike Fitton Engineering Analysis Group
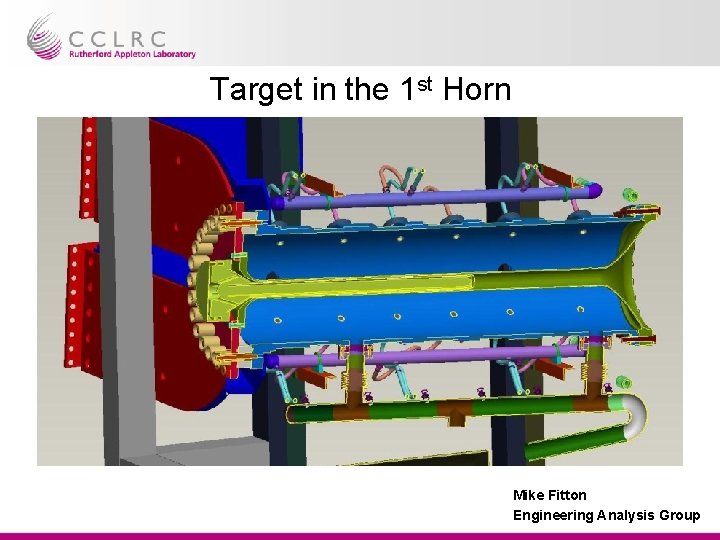
Target in the 1 st Horn Mike Fitton Engineering Analysis Group
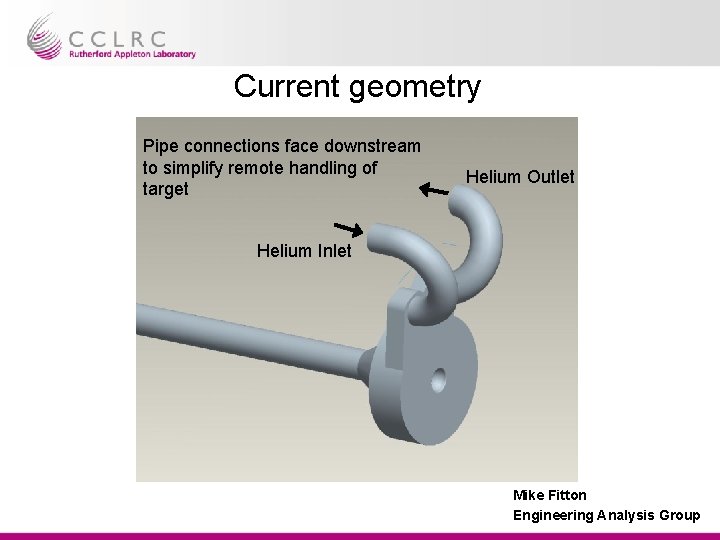
Current geometry Pipe connections face downstream to simplify remote handling of target Helium Outlet Helium Inlet Mike Fitton Engineering Analysis Group
Section of target Outlet Manifold Inlet Manifold Matt Rooney’s initial calculations suggest this window is ok for pressure and shock. Mike Fitton Engineering Analysis Group
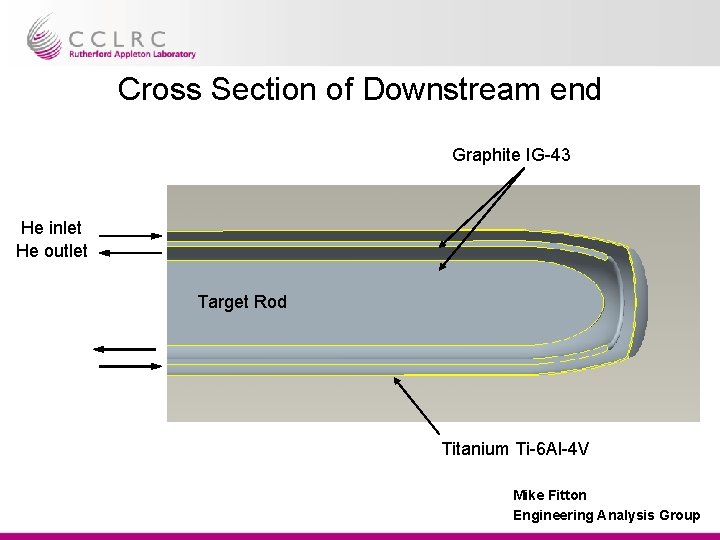
Cross Section of Downstream end Graphite IG-43 He inlet He outlet Target Rod Titanium Ti-6 Al-4 V Mike Fitton Engineering Analysis Group
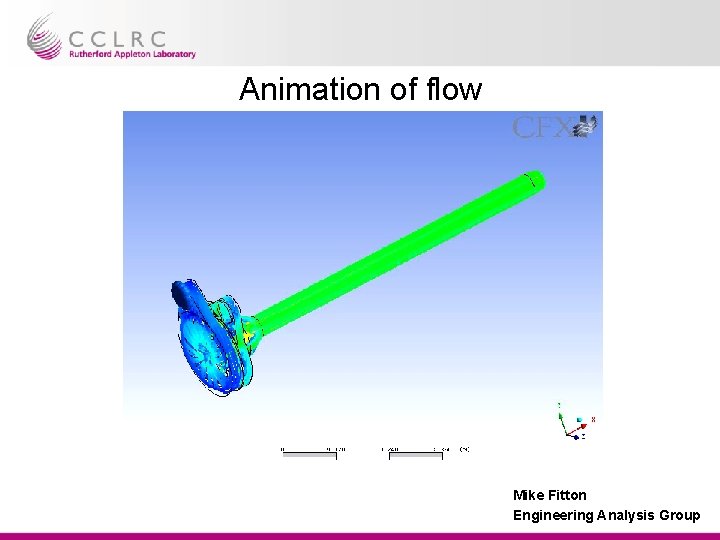
Animation of flow Mike Fitton Engineering Analysis Group
Target Analysis Outline Boundary conditions (Helium – Ideal gas model) Inlet Mass flow rate = 0. 032 kg/s (Max compressor flow rate) Inlet helium temperature = 300 K Outlet Pressure = 0. 9 bar (gauge) Heat deposited – On target as cloud of point (x, y, z, heat) – On Graphite upstream structure as total source – On upstream and downstream window as radial function (NOTE - Downstream heat scaled from 50 Ge. V and needs verifying) Mike Fitton Engineering Analysis Group
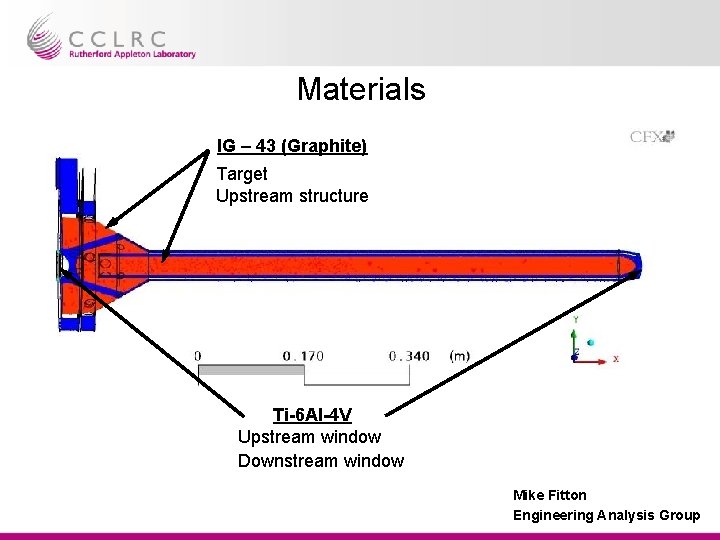
Materials IG – 43 (Graphite) Target Upstream structure Ti-6 Al-4 V Upstream window Downstream window Mike Fitton Engineering Analysis Group
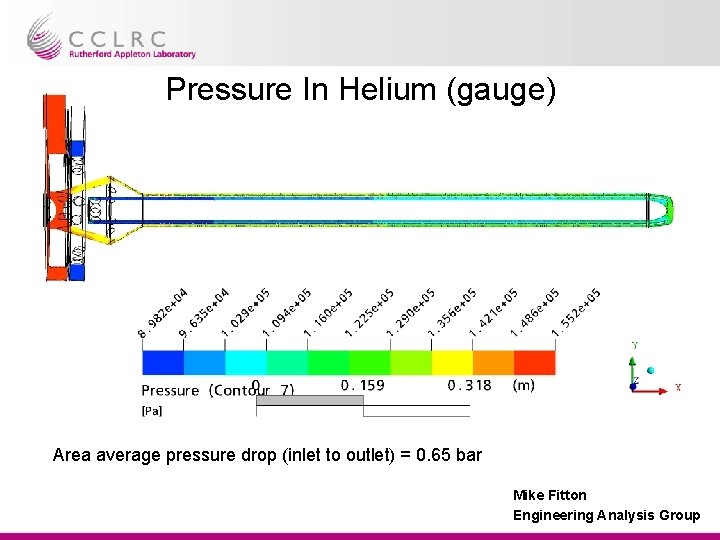
Pressure In Helium (gauge) Area average pressure drop (inlet to outlet) = 0. 65 bar Mike Fitton Engineering Analysis Group
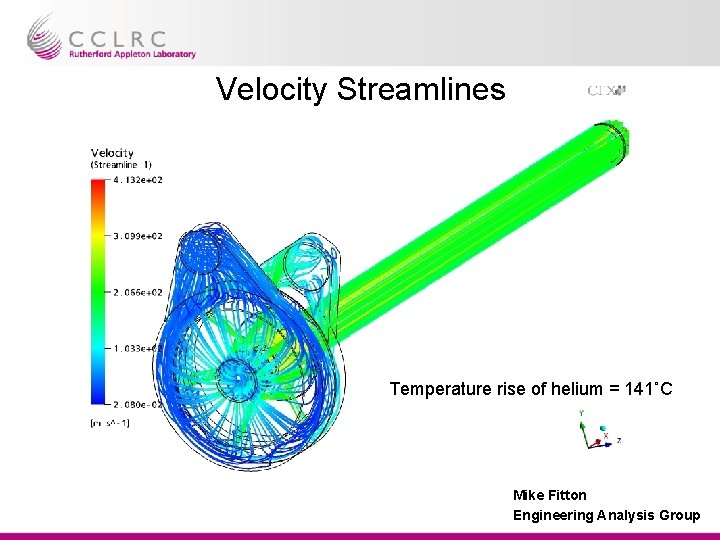
Velocity Streamlines Temperature rise of helium = 141˚C Mike Fitton Engineering Analysis Group
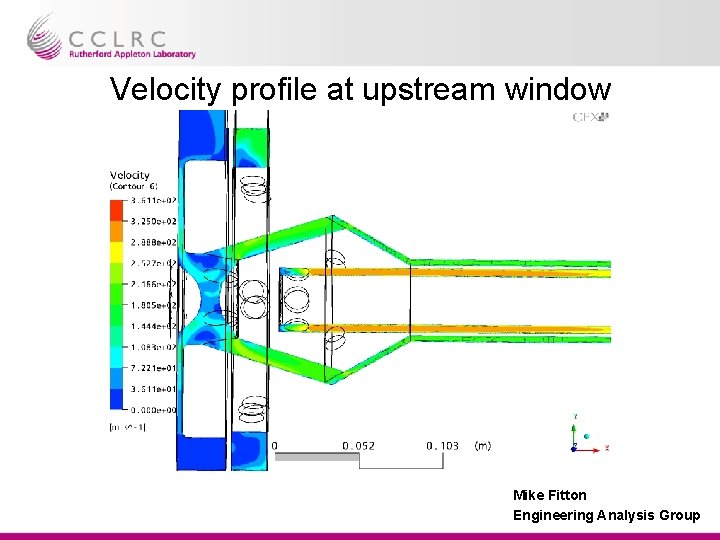
Velocity profile at upstream window Mike Fitton Engineering Analysis Group
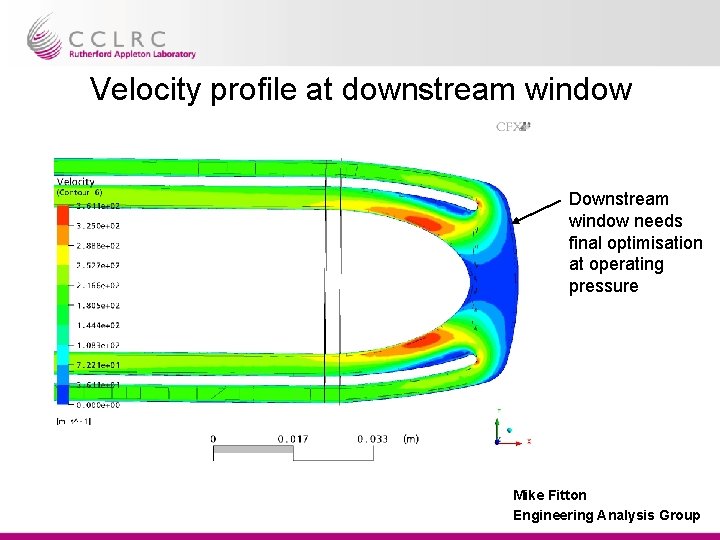
Velocity profile at downstream window Downstream window needs final optimisation at operating pressure Mike Fitton Engineering Analysis Group
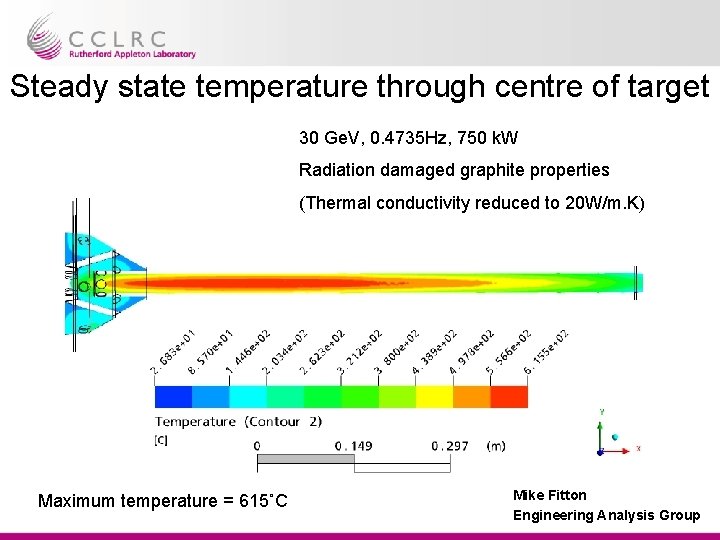
Steady state temperature through centre of target 30 Ge. V, 0. 4735 Hz, 750 k. W Radiation damaged graphite properties (Thermal conductivity reduced to 20 W/m. K) Maximum temperature = 615˚C Mike Fitton Engineering Analysis Group
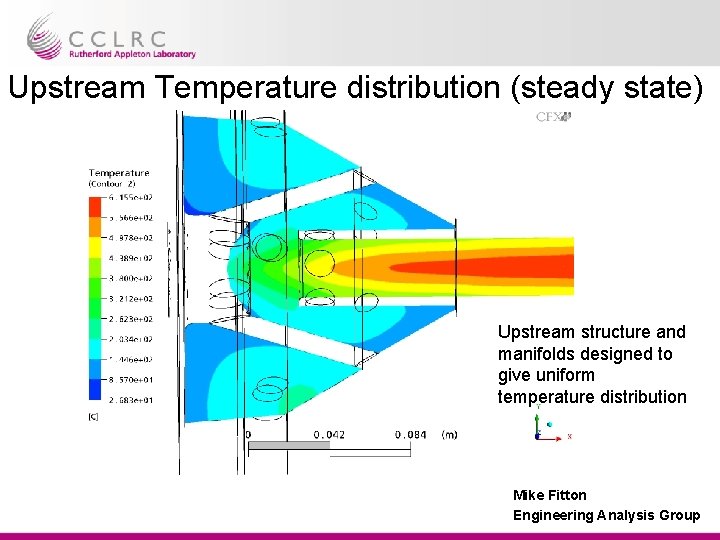
Upstream Temperature distribution (steady state) Upstream structure and manifolds designed to give uniform temperature distribution Mike Fitton Engineering Analysis Group
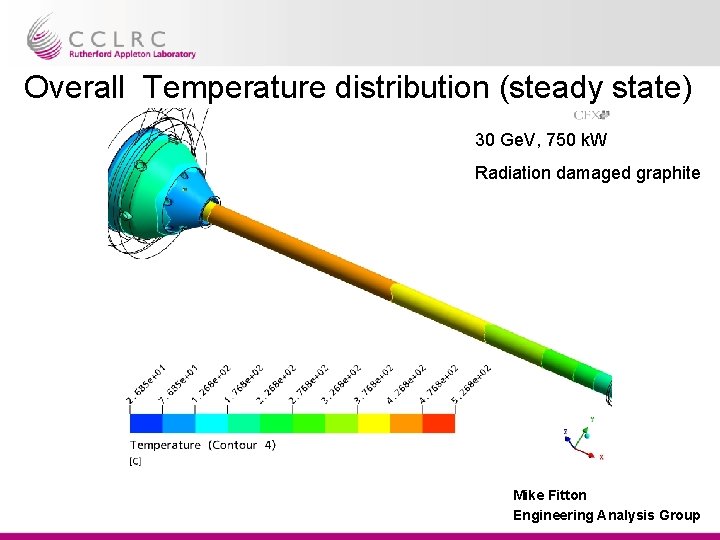
Overall Temperature distribution (steady state) 30 Ge. V, 750 k. W Radiation damaged graphite Mike Fitton Engineering Analysis Group
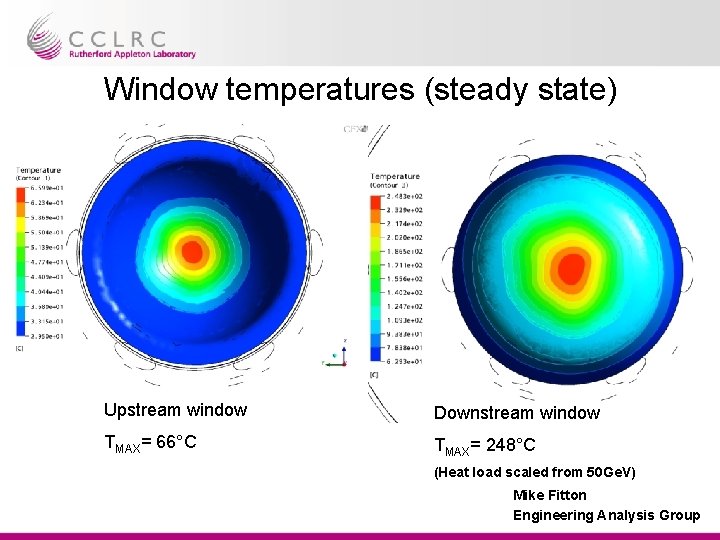
Window temperatures (steady state) Upstream window Downstream window TMAX= 66°C TMAX= 248°C (Heat load scaled from 50 Ge. V) Mike Fitton Engineering Analysis Group
Summary • Temperature rise of helium at 0. 032 kg/s = 141° (23. 4 k. W heat load) • Pressure drop from inlet to outlet = 0. 65 bar (specification was 0. 7 bar) • Analysis shows the upstream window is sufficiently cooled • Downstream window needs fine tuning to reduce temperature • Temperature distribution is reasonably symmetric • Single forward facing inlet and outlet pipes will simplify remote handling Mike Fitton Engineering Analysis Group
Future work • Model to be repeated for 13 mm radius target • Next design needs to focus on ease of manufacture • Heat load on target and tubes needs more work (e. g. apply heat as a function of radius and z Mike Fitton Engineering Analysis Group