Descriptive Statistics BUS 172 Lecture 1 Niza Talukder

Descriptive Statistics BUS 172 Lecture 1 Niza Talukder

Descriptive statistics: Suppose we have a bunch of data and we want to obtain information about it. Once we are able to describe the set of data, we can start making inferences, conclusion or judgements about it. Let’s consider the following set: 40 k 30 k 10 k 70 k 60 k 10 k How can we obtain a typical number that represents the entire bunch? It could be a figure that appears most frequently or maybe a number that represents the centre of all the numbers in the set. Mean: average or the measure of central tendency. Mean = 40+30+10+70+60+10 6 = 36. 67 ( a representative number)

What are the other ways to describe the data or find the average? Or in other words, find a typical or middle value? Median: It is literally the middle value of a data set • Order all the numbers and then choose the one in the centre. • If you have two middle numbers ( in case of an even data set) you simply need to find the average of the two numbers 40 30 10 Putting the above in order: 10 70 10 60 30 10 40 60 70 Since there are six numbers, there’s not one middle number but two. Thus we need to go half way between the two. That is, take the mean. This is what you do when you have an even data set Median: 30 + 40 = 35 k 2 Mode: Most common number in the data set or the value that occurs most frequently
 Questions: 1)")
Mode: 10 ( appears twice in the data set unlike the rest) Questions: 1) Annual salary of shop floor supervisor staff: 34500 30700 32900 36000 34100 33800 32500 Find the - mean salary - median salary - Mode 2) A start up company has hired 7 workers with pay of £ 10 per hour. The supervisor will be paid £ 50 per hour. a) Find the mean, median and mode of all eight workers. Write down, which measure of central tendency would you use in the following situation. b) When asked the typical hourly rate of pay for the start up. c) When trying to persuade a prospective candidate to work for the start up.

Mean, Median and Mode of Multiple Observations Often you will encounter problems involving frequencies i. e the number of times the event occurred in an experiment or study. Lets consider the following example A publisher receives a copy of a 500 page textbook. The page proofs are carefully read and the number of errors on each page is recorded, producing the data shown in table. Find the mean number of errors per page. (in this example, frequency is the number of pages)

Mean = total number of errors total number of pages That is, Mean = Frequency x observation values total number of observations - Mode : observation with the highest frequency - Median – the middle value after arranging the observations in order according to the given frequency Q. Find the median and mode from the following data set.

Population and Sample Suppose P&G wants to bring a new shampoo in the market. They first want to assess the likely level of demand for the product. To do this, they can carry out a market research survey. P&G is interested in the population of all potential buyers but it is typically unattainable and expensive to contact every single member of the population for their opinions. An easier way is to collect a subset or sample of the population who can be contacted for the survey. Any conclusion about the population will be based on information drawn from the sample. Sample taken to infer things/information about the entire population. Examples: Want to find out the mean height of the men in the US (The difference between sample and population has been explained in detail in class)
 A survey of")
Lying with statistics: What is wrong with the following statements? 1) A survey of shoppers reveal that 80% of people enjoy shopping. • A survey will not include shoppers who love shopping but shop online 2) A telephone survey households suggest that average family income was £ 27500 • A lot of people may not revel their actual income on telephone • Many people may not even have telephones at home Statements can often distort the whole picture. Data may simply reflect factual material and contain no value judgement. False impression might be created if too little summary measure is provided 3) A very small sample size can lead to the mistake of generalizing a population.
 : average distance between each data value")
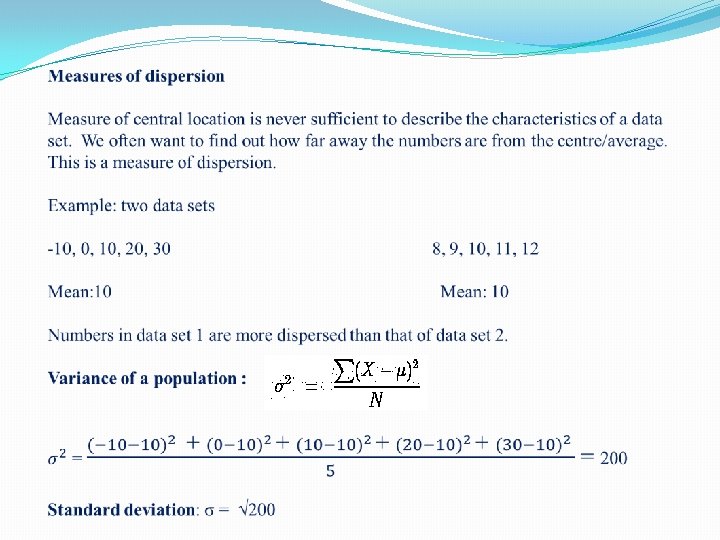
Measures of dispersion Mean absolute deviation (MAD) : average distance between each data value and the mean. Both MAD and standard deviation provide measures of spread. They roughly measure the average deviation of observations from the mean. Both MAD and standard deviation will be large when the data are spread out and small when the data are close together. Example: 3, 6, 6, 7, 8, 11, 15, 16 ( height of my plants) Step 1 : find the population mean (note: I am saying population because I am taking into account all the 8 plants in my garden; not a sample of the plants) µ = 3 + 6 + 7 + 8 + 11 + 15 + 16 = 9 8 Step: 2 : Find the absolute deviations i. e. the absolute value of the deviation (how far the heights are from the mean)

Step: 2 : Find the absolute deviations i. e. the absolute value of the deviation (how far the heights are from the mean) x │x- µ│ 3 6 7 8 11 15 16 Step 3: Find the mean deviation (3. 75 is the answer)
 A student has grades of 84, 65, and 76 on three")
Practice Questions: 1) A student has grades of 84, 65, and 76 on three statistics quizzes. What grade must he obtain on the next test to have an average of exactly 80 for the four tests? 2) In January of 2010, your family moved to a tropical climate. For the year that followed, you recorded the number of rainy days that occurred each month. Your data contained 14, 10, 12, 11, 13, 11, 14, 10, 13, 8. a) Find the mean, mode and median for your data set of rainy days. b) Find the standard deviation
- Slides: 14