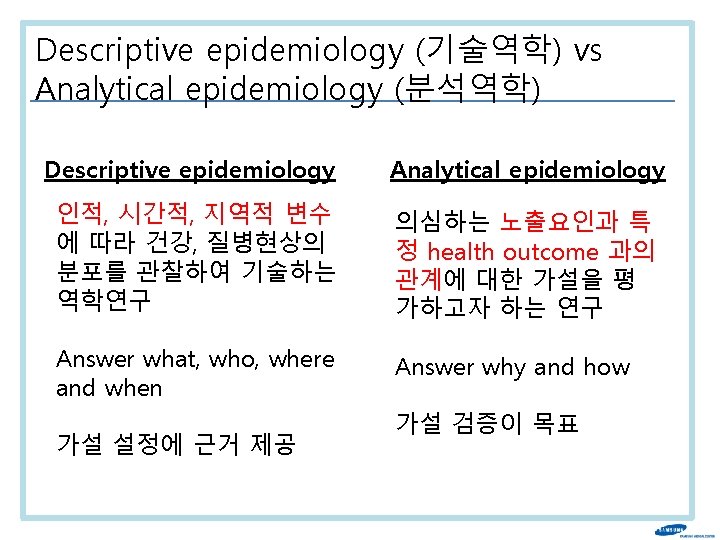
Descriptive epidemiology What Who When Where Analytical epidemiology


 의 개념 2. Cross-sectional study 설계 및 수행 2")


 의 개념 2. Cross-sectional study 설계 및 수행 2")
")
 - to assess the health and nutritional")
 - includes demographic, socioeconomic, dietary, and health-related")

 Sampling Probability (확률) 표본추출 • Simple random • Systematic random")

 Sampling Probability (확률) 표본추출 • Simple random • Systematic random")
 Cluster sample Stratified random sample eligible criteria")
 – Intra-subject – Intra-observer –")

 1개월 내 금연 계획에 대한 답 2009 45. 0 2010 40. 0 35.")
 개복술 경피술 돌의 크기 <")

 의 개념 2. Cross-sectional study 설계 및 수행 2")
 - descriptive approach • 정의: 인구 집단에서, 한 질환의 existing case 의")


의 표준화 A B population No. of death 900, 000 862")
의 표준화 Age group All ages 30 -49 50 -69 70+")
")
 = incidence")
 의 개념 2. Cross-sectional study 설계 및 수행 2")
 지표 – analytic approach • 노출군과 비노출군의 유병률을 비교 Disease (+) Disease")

 의 개념 2. Cross-sectional study 설계 및 수행 2")

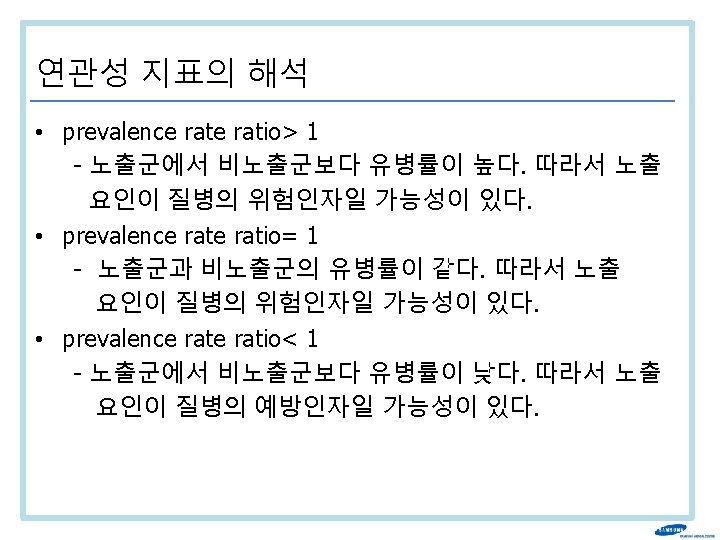
 § 유병률비 (prevalence ratio:")


- Slides: 73
Descriptive epidemiology – What? – Who? – When? – Where? 가설에 대한 근거 Analytical epidemiology Hypothesis – Why? – How? 가설 검증
Descriptive study Analytical study Aggregate Ecological studies Individual Experimental Controlled trials Observational Case report Cohort Case series Case-control Cross-sectional study
Outlines 1. 단면연구 (Cross-sectional study) 의 개념 2. Cross-sectional study 설계 및 수행 2 -1. 관심 연구집단의 선정 2 -2. 측정: 결과변수, 노출요인, 혼란변수 3. Cross-sectional study 자료분석 및 해석 3 -1. Prevalence 3 -2. 연관성 분석: Prevalence ratio 4. Cross-sectional study의 장단점 및 Bias
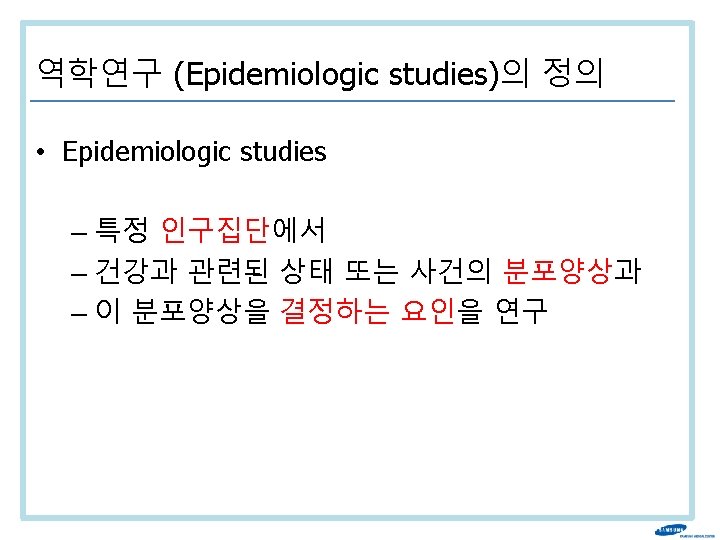
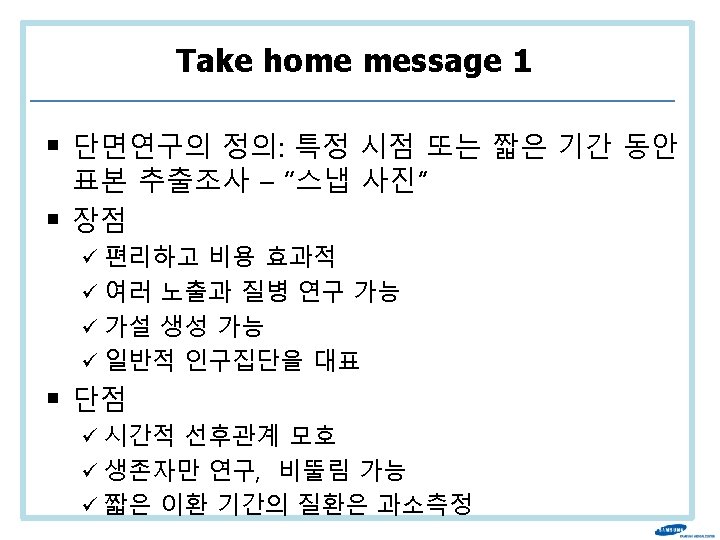
Cross-sectional study의 정의 1 • Questions: How common is this disease or condition? • 목적: 질병 (Disease)과 특정 폭로 요인 (Exposure)에 대한 정보를 한 시점에 얻고자 함. • physical “cross section” of the population of interest • “snapshot” of something at a particular point in time
Cross-sectional study의 정의 2 • Design: No comparison group • Population: All members of a small, defined group or a sample from large group (is NOT guided by exposure or disease status) • Results: estimates of the prevalence of a health condition in population of interest at a given time point
Cross-sectional study의 기본 틀 연구대상 집단 요인 노출과 질환에 관한 정보 수집 Ø Exposure and outcome are assessed simultaneously Ø No follow-up 노출 YES 질병 YES 노출 YES 질병 NO 노출 NO 질병 YES 노출 NO 질병 NO
Outlines 1. 단면연구 (Cross-sectional study) 의 개념 2. Cross-sectional study 설계 및 수행 2 -1. 관심 연구집단의 선정 2 -2. 측정: 결과변수, 노출요인, 혼란변수 3. Cross-sectional study 자료분석 및 해석 3 -1. Prevalence 3 -2. 연관성 분석: Prevalence ratio 4. Cross-sectional study의 장단점 및 Bias
National Health and Nutrition Examination Survey (NHANES)
National Health and Nutrition Examination Survey (NHANES) - to assess the health and nutritional status of adults and children in the United States. - combines interviews and physical examinations - a major program of the National Center for Health Statistics (NCHS). - NCHS is part of the Centers for Disease Control and Prevention (CDC), and has the responsibility for producing vital and health statistics for the Nation.
National Health and Nutrition Examination Survey (NHANES) - includes demographic, socioeconomic, dietary, and health-related questions. - The examination component consists of medical, dental, and physiological measurements, as well as laboratory tests - will be used to determine the prevalence of major diseases and risk factors for diseases. - will be used in epidemiological studies and health sciences research, which help develop sound public health policy, direct and design health programs and services, and expand the health knowledge for the Nation.
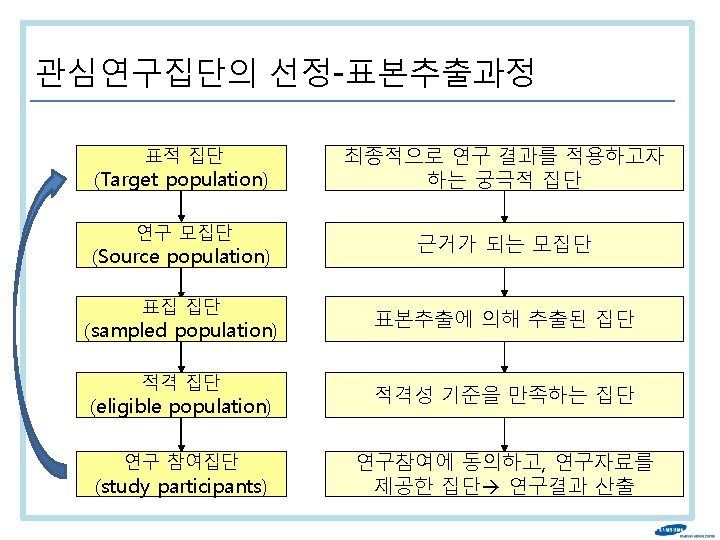
연구집단 선정의 필요성 It is often infeasible, very costly, and inefficient to select all individuals from a source population. § Census: survey of the entire population § Sample: subset of the population Goal: use a sample to represent some larger population of interest (source population)
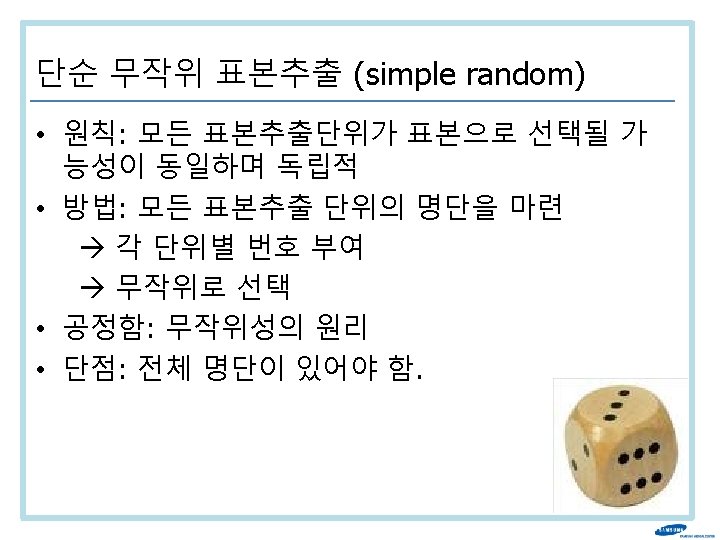
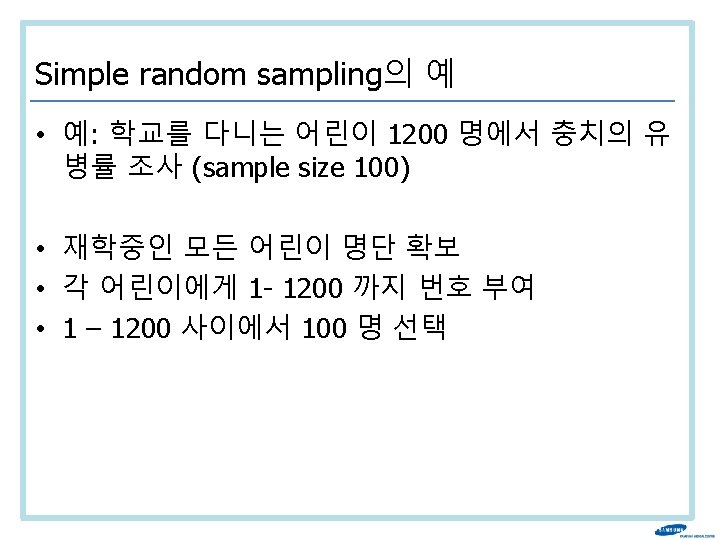
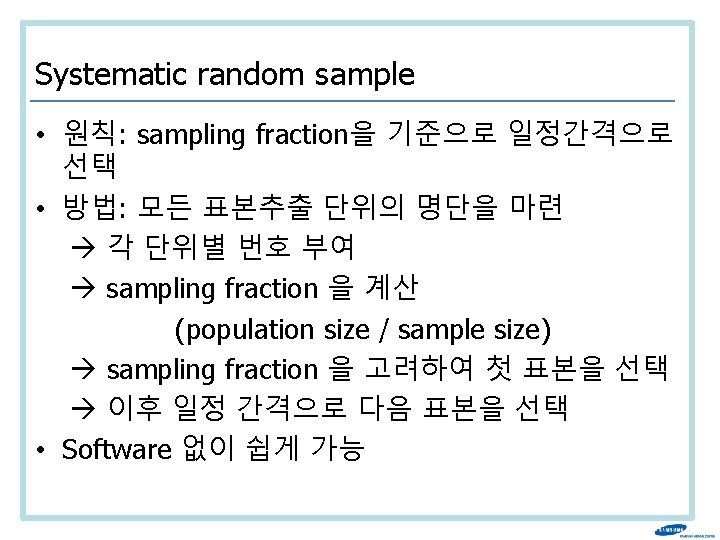
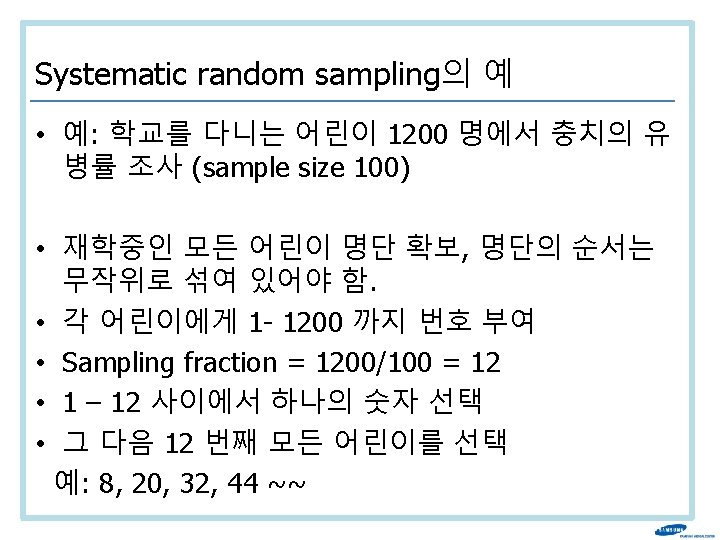
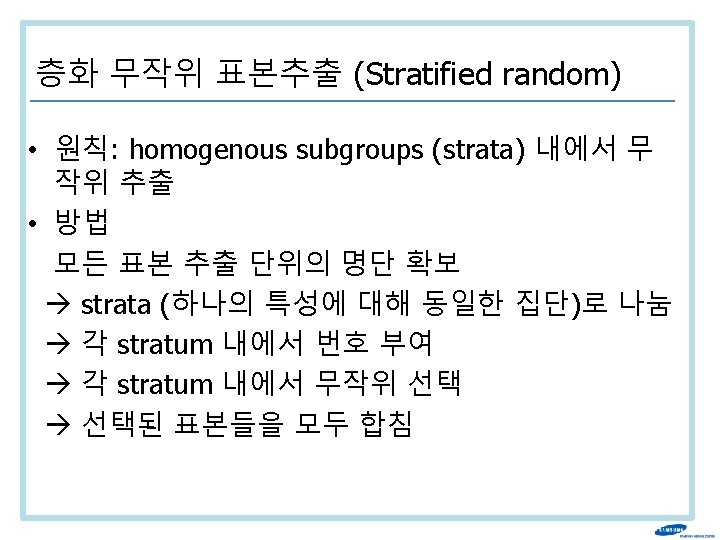
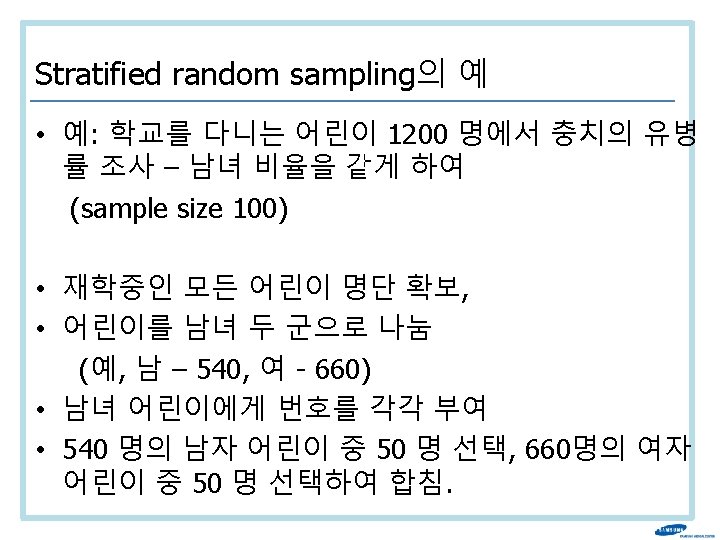
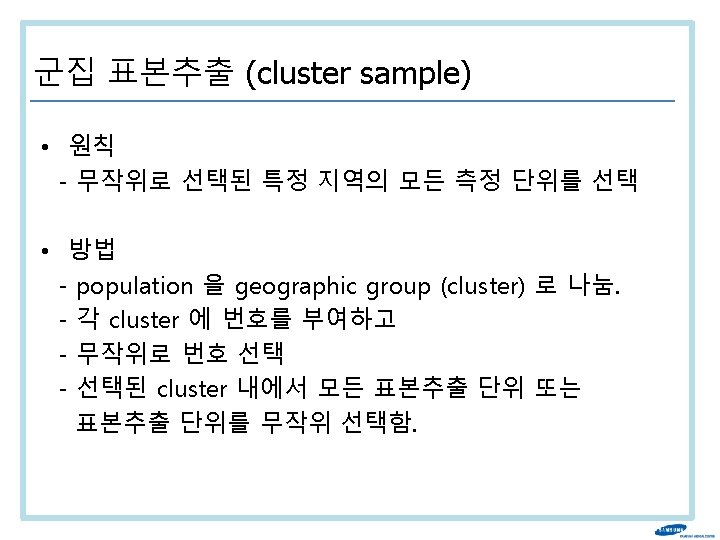
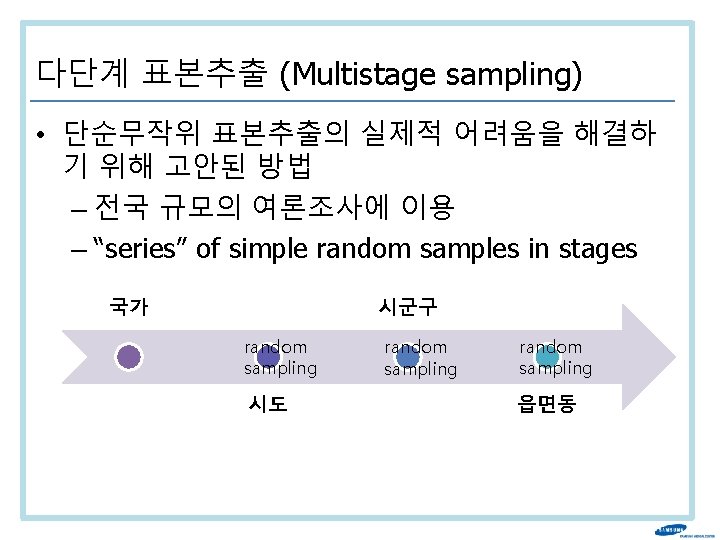
관심연구집단의 선정-표본추출 방법 (sampling) Sampling Probability (확률) 표본추출 • Simple random • Systematic random • Stratified random • Multistage random • Cluster Non-probability (비확률)표본추출
Non-probability sampling • Eligible criteria 에 속하는 사람들을 편의에 의해 선택 (unknown probability of sampling in each subject) - Convenience sampling - Snowball sampling - Voluntary sampling 단점 - Not representative - Results are not generalizable
관심연구집단의 선정-표본추출 방법 (sampling) Sampling Probability (확률) 표본추출 • Simple random • Systematic random • Stratified random • Multistage random • Cluster Non-probability (비확률)표본추출
국민건강영양조사 (Korean NHANES) Cluster sample Stratified random sample eligible criteria
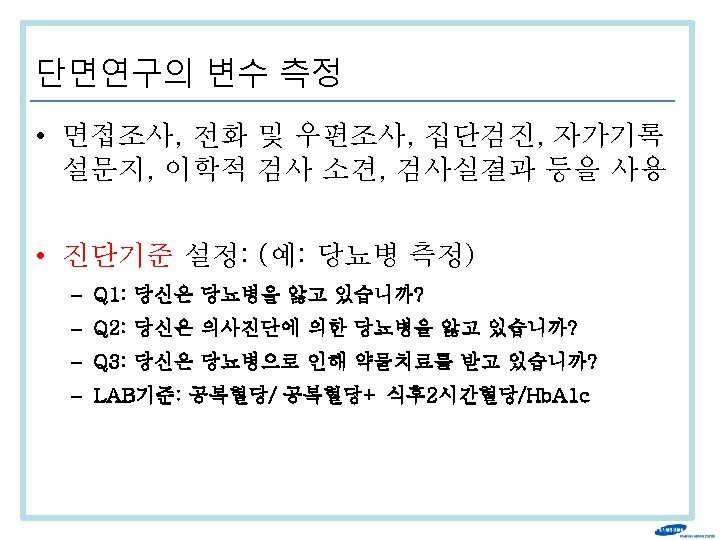
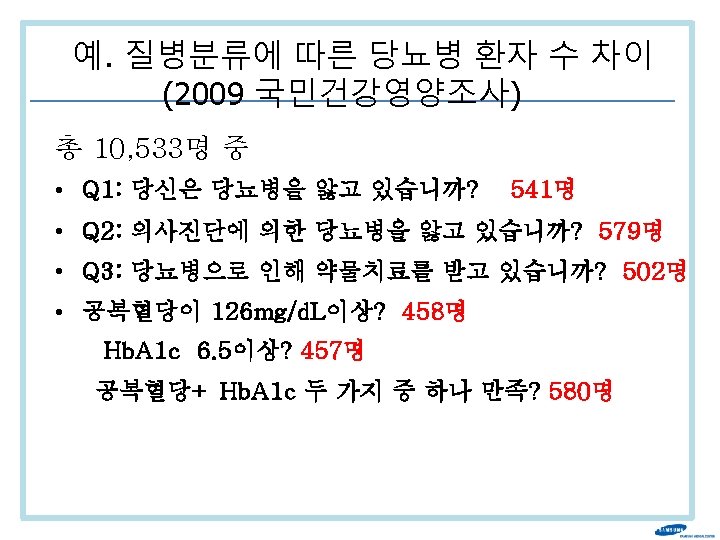
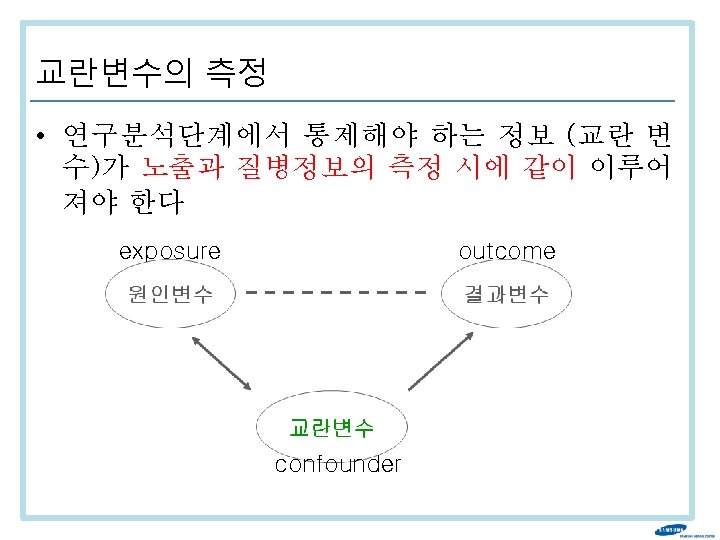
변수 측정 방법의 적절성 평가 • 높은 신뢰도 (reliability) – Intra-subject – Intra-observer – Inter-observer • 높은 타당도 (validity) – sensitivity, specificity
Validity 와 reliability
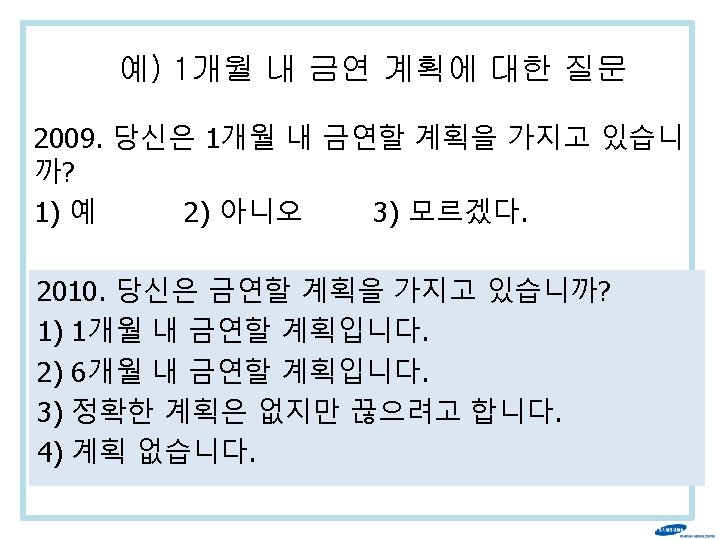
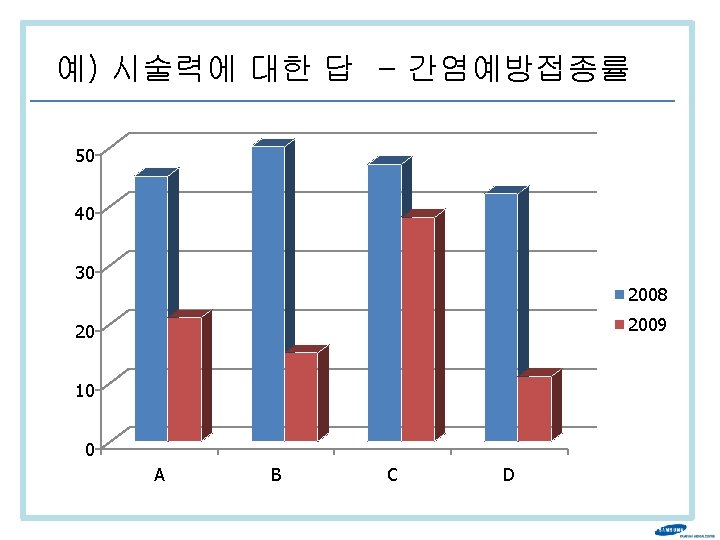
예) 1개월 내 금연 계획에 대한 답 2009 45. 0 2010 40. 0 35. 0 30. 0 25. 0 20. 0 15. 0 10. 0 5. 0 0. 0 A B C D E F G H I J
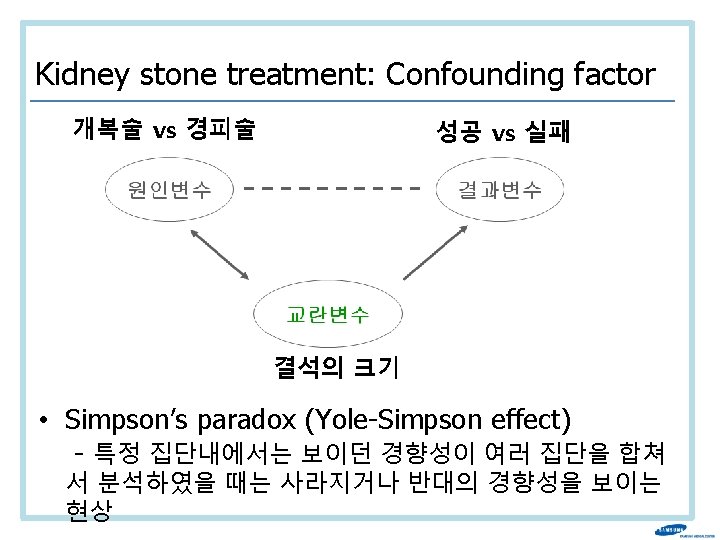
Kidney stone treatment: Confounding factor 치료 종류 합계 (n=700) 개복술 경피술 돌의 크기 < 2 cm 개복술 경피술 돌의 크기 ≥ 2 cm 개복술 경피술 환자 수 성 공 350 (n=357) 87 270 (n=343) 263 273 289 77 61 81 234 6 36 93 87 192 71 73 55 25 69 80 실 패 성공률(%) 78 83
Berkeley gender bias case
Outlines 1. 단면연구 (Cross-sectional study) 의 개념 2. Cross-sectional study 설계 및 수행 2 -1. 관심 연구집단의 선정 2 -2. 측정: 결과변수, 노출요인, 혼란변수 3. Cross-sectional study 자료분석 및 해석 3 -1. Prevalence 3 -2. 연관성 분석: Prevalence ratio 4. Cross-sectional study의 장단점 및 Bias
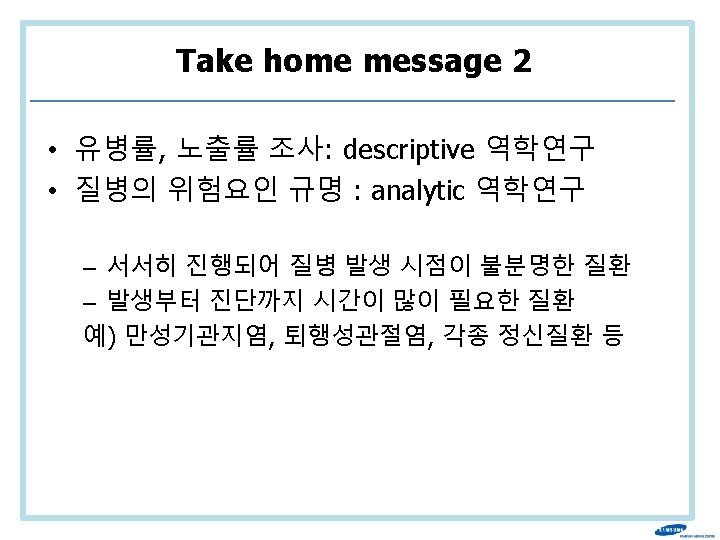
Prevalence (유병률) - descriptive approach • 정의: 인구 집단에서, 한 질환의 existing case 의 빈도 (frequency) 특정 시점 또는 특정 기간 - point prevalence (at a point in time) : 흔히 사용 - period prevalence (during a defined time period) • Useful index of the magnitude of current health problem plan for resource allocation • Prevalence is a proportion, not a rate or risk : range (0 ~ 1) or (0 ~ 100 %) but sometimes mistakenly referred to as prevalence rate
Point and period prevalence: example
Point prevalence at several time points
Period prevalence
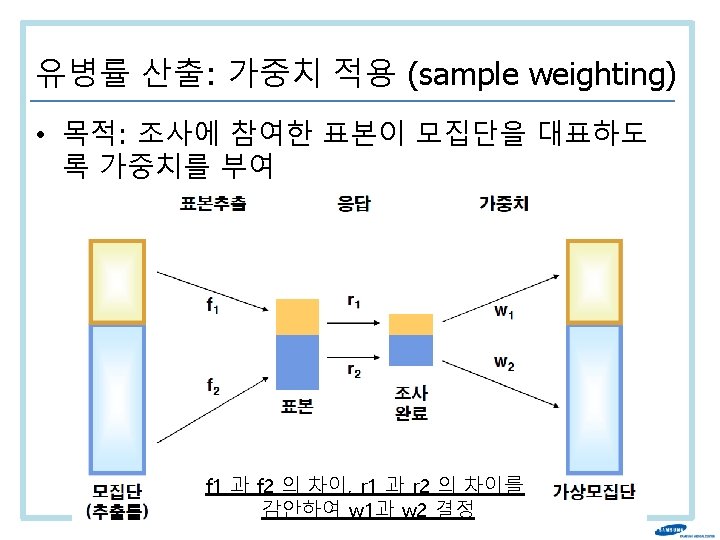
Example of weighting : 설계 가중치
Example of weighting : 무응답 조정가중치 • Imagine 100 male & 100 female in sample • But only 80 males & 75 females respond • Male respondent will get weight of – 100/80 ->1/(80/100)=1. 25 • Female respondent will get weight of – 100/75 ->1/(75/100)=1. 33
가중치를 이용한 율 (Yole)의 표준화 A B population No. of death 900, 000 862 Death rates per 100, 000 96 population No. of death 900, 000 1, 130 A Age group population No. of death All ages 900, 000 862 30 -49 500, 000 50 -69 70+ Death rates per 100, 000 126 B Death rates per 100, 000 population No. of death 96 900, 000 1, 130 126 60 12 300, 000 30 10 300, 000 396 132 400, 000 400 100, 000 406 200, 000 700 350
가중치를 이용한 율 (Yole)의 표준화 Age group All ages 30 -49 50 -69 70+ Standard population 1, 800, 000 700, 000 300, 000 Total Age-adjusted rates “A" age-specific mortality rates per 100, 000 Expected No. of deaths using “A" rates “B" age-specific mortality rates per 100, 000 Expected No. of deaths using “B" rates 12 132 406 96 924 1, 218 10 100 350 80 700 1, 050 2, 238 1, 830 124. 3 101. 7
Prevalence and incidence § Point prevalence = incidence × duration × (1 -point prevalence) N= population size, X = number of existing cases at a point, I = incidence, F = case fatality or cured case, D= duration If the disease is in steady state, I × (N-X) = F × X, F = 1/D X Prevalence I × D = = (N-X) (1 -Prevalence)
If, Prevalence is relatively low § Point prevalence (if < 0. 05) = incidence × duration × (1 -point prevalence) ≒ incidence × duration Incidence 가 시기에 관계 없이 일정하고 질병의 유병기간을 알고 있다면 (예. 3년) Point prevalence 가 0. 03 라면, incidence 는 연간 0. 01 (1%) 로 볼 수 있음.
Outlines 1. 단면연구 (Cross-sectional study) 의 개념 2. Cross-sectional study 설계 및 수행 2 -1. 관심 연구집단의 선정 2 -2. 측정: 결과변수, 노출요인, 혼란변수 3. Cross-sectional study 자료분석 및 해석 3 -1. Prevalence 3 -2. 연관성 분석: Prevalence ratio 4. Cross-sectional study의 장단점 및 Bias
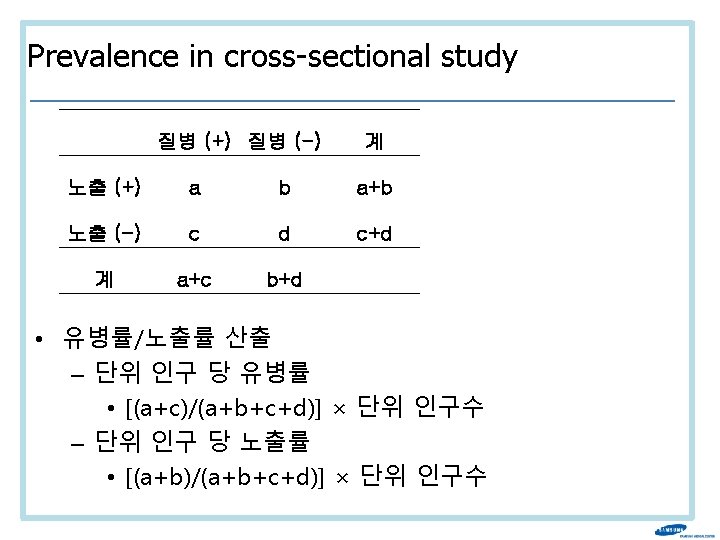
연관성 (association) 지표 – analytic approach • 노출군과 비노출군의 유병률을 비교 Disease (+) Disease () Exposure (+) a+b a b Exposure (-) c+d c d
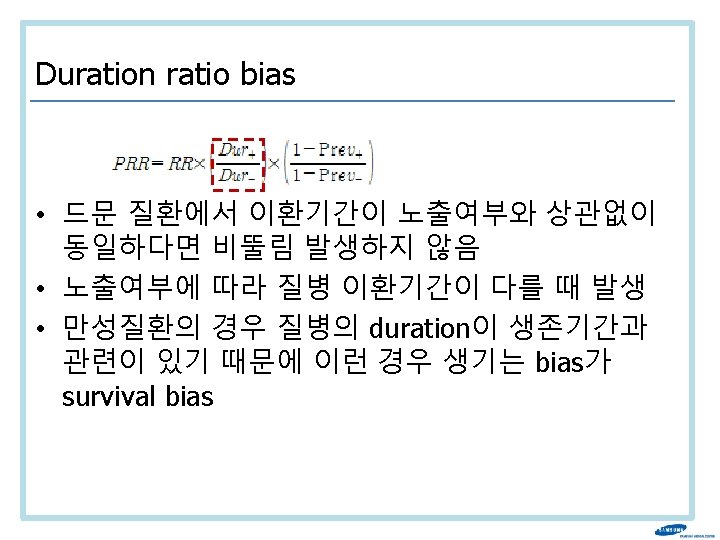
PRR: estimating relative risk § Point prevalence = incidence × duration × (1 -point prevalence) § 유병률비 (prevalence ratio: PRR) = 노출군의 유병률 / 비노출군의 유병률 Prev+ q+ × Dur+ × [1. 0 – Prev+] Prev- q- × Dur- × [1. 0 – Prev-] = Dur+ × [1. 0 – Prev+] = RR × Dur- × [1. 0 – Prev-] 이 두가지 bias 가 무시할 만한 수준이라면, PRR 로 RR 을 estimation 할 수 있음.
Outlines 1. 단면연구 (Cross-sectional study) 의 개념 2. Cross-sectional study 설계 및 수행 2 -1. 관심 연구집단의 선정 2 -2. 측정: 결과변수, 노출요인, 혼란변수 3. Cross-sectional study 자료분석 및 해석 3 -1. Prevalence 3 -2. 연관성 분석: Prevalence ratio 4. Cross-sectional study의 장단점 및 Bias
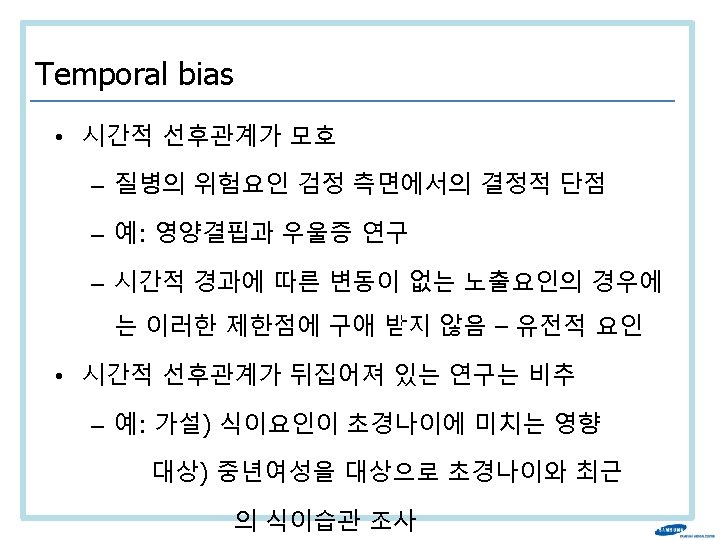
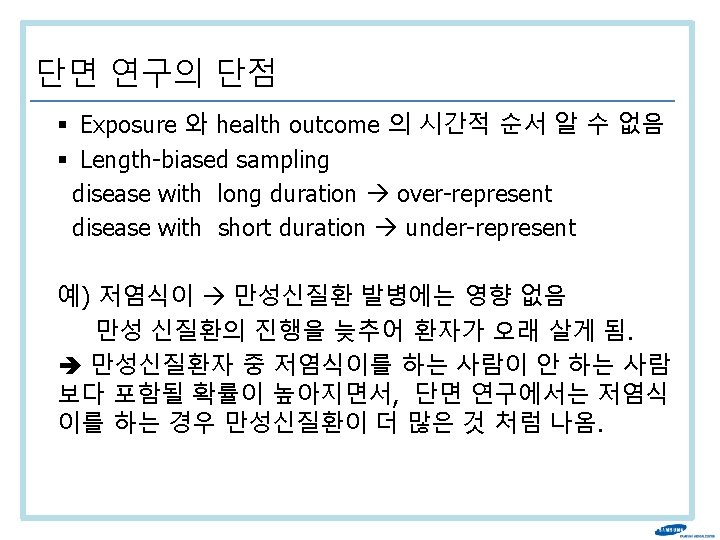
Cross-sectional Bias • Incidence-Prevalence bias – 인과관계를 설명하고자 할 때 Prevalent rate ratio를 incidence ratio 추정치로 사용함으로 인 해 발생하는 bias – Duration ratio bias – Point prevalence complement ratio bias • Temporal bias
Incidence-Prevalence bias § Prev= incidence X duration X (1 -prev) § 유병률비 (prevalence ratio: PRR) Prev+ q+ × Dur+ × [1. 0 – Prev+] Prev- q- × Dur- × [1. 0 – Prev-] = Dur+ × [1. 0 – Prev+] = RR × Dur- × [1. 0 – Prev-] * Duration ratio bias * Point prevalence complement ratio bias
Point prevalence complement ratio bias • 이환기간이 동일하다면, PRR이 Incidence ratio 를 과소측정하는 경향이 발생 • 노출그룹의 유병률: 0. 04, 비노출그룹 유병률: 0. 01 PRR : 4 Point prevalence complement ratio=0. 97 • 노출그룹의 유병률: 0. 4, 비노출그룹 유병률: 0. 1 PRR : 4 Point prevalence complement ratio=0. 67 • PRR, 유병률 크면 → bias 크기 커짐
Cross-sectional study – How to get high impacts • Novel association • Serial association • Contrasted association
Novel association in cross-sectional study - 1
Novel association in cross-sectional study - 1 CKD Microalbuminuria
Serial association in cross-sectional study
Serial association in cross-sectional study Interpretation If the same systematic improvement continues until 2022, 80% of patients with treated hypertension will have controlled BP with a potential annual saving of about 50 000 major cardiovascular events.
Contrasted association in cross-sectional study
Any questions? 감사합니다