Descriptive Analysis of Participation and Belonging Among People

Descriptive Analysis of Participation and Belonging Among People with Disabilities in the North American Division of Seventh-day Adventists AHSRA 2019 By Shannon Trecartin, Ph. D, Petr Cincala & Curt Vander. Waal, Ph. D

BACKGROUND ● Definitions of disability vary. ● Sense belonging is essential to overall wellbeing ● (Mannarini & Fedi, 2009; Roffey, 2013). Limited literature on the intersection of disability and spirituality/religion. ● Social exclusion linked to low sense of self-worth, feelings of ● powerlessness, a tendency towards further isolation, and early mortality People with disabilities (PWD) are less likely to attend church by a gap of 7% (Kessler Foundation/National Organization on Disability, 2010). (Holt-Lunstad et al. , 2015). ● Belonging research limited to small samples of Intellectual and developmental disabilities.
, 2019")
Centers for Disease Control (CDC), 2019
")
Statistics Canada (2019)
, 2019 Statistics Canada, 2019")
Centers for Disease Control (CDC), 2019 Statistics Canada, 2019
 Cared for Present Loved Invited Belonging Needed Known")
Supported DIMENSIONS OF BELONGING (CARTER 2016) Cared for Present Loved Invited Belonging Needed Known Befriended Accepted Welcomed
 will")
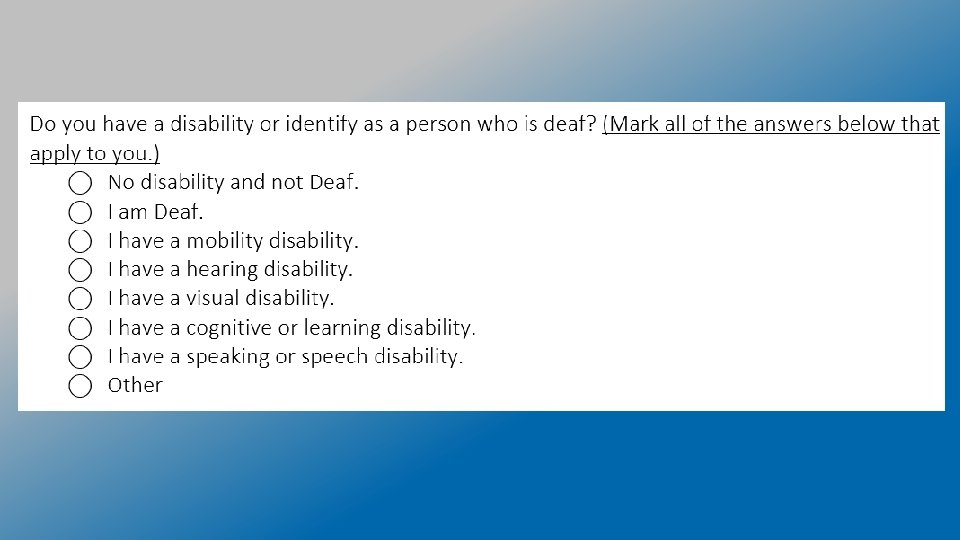
METHODOLOGY Dimensions of Belonging Framework • The Dimensions of Belonging Framework (Carter, 2016) will be extended to PWDs. Dataset and Sample • Seventh-day Adventist Global Church Survey, North American Division (n= 1, 923). Analytic Approach • Exploratory analysis of the role of disability in church participation and attendance and perception of care. • Descriptive and bivariate analysis.

CONCEPTUAL AND MEASUREMENT FRAMEWORK Comparison Concept Measures Lower Attendance Present Needed Lower Individuals with disability compared to those without Holding church office Cared for by pastor Cared for Lower Cared for by Sabbath School Teachers Cared for by other members

RESULTS

RESULTS NAD Adults with and Without Disabilities NAD Adults with Disabilities 4. 2 4. 5 88 4 90 80 3. 5 70 3 60 2. 5 50 2 40 3. 4 2. 6 1. 5 30 20 0. 4 10 0. 7 1 11. 6 0. 5 0 0 None N= 1663 Disability N= 205 Deaf Mobility Hearing Vision Cognitive Other

***AGE BY DISABILITY TYPE p<. 001

DISABILITY BY GENDER p>. 05 55. 2 44. 8 46. 4 53. 6

DISABILITY BY ATTENDANCE p>. 05

*DISABILITY BY HOLDING OFFICE p=. 05 61. 2 38. 8 55. 1 44. 9
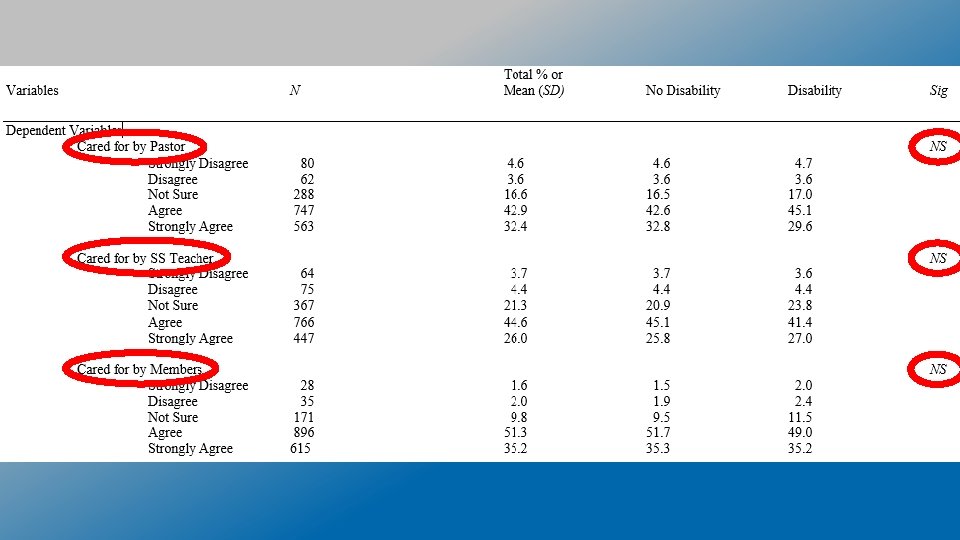

DISCUSSION • Good news! Present and feel cared for. • Gap between population and church representation (26% vs 11. 6%). • Gap in representation in church office (61. 2% vs 55. 1%). • Aging church will have increasingly higher needs. • Limited by who had access to respond and definitions.
 “Nothing about us without us. ” 2) Modify definitions and instructions in")
Research: 1) “Nothing about us without us. ” 2) Modify definitions and instructions in the next World Church Survey 3) Duplicate and compare across Divisions 4) Qualitative follow-up to understand what works as well as barriers to belonging Church: 1. Close the gap 2. Include members with disabilities in leadership 3. Work with existing resources Recommendations 4. 1) GC Special Needs Ministries 2) NAD Disability Ministries Conduct a physical, social, and spiritual accessibility audit (using Belonging Framework)
- Slides: 18