DESCRIBING RELATIONSHIPS 3 1 Correlation Which one is

DESCRIBING RELATIONSHIPS 3. 1 Correlation

Which one is stronger?

Measuring Linear Association: Correlation The correlation r measures the direction and strength of the linear relationship between two quantitative variables. • r is always a number between -1 and 1 • r > 0 indicates a positive association. • r < 0 indicates a negative association. • Values of r near 0 indicate a very weak linear relationship. • strength increases as r moves away from 0 towards 1 or 1. • r = -1 and r = 1 occur only in the case of a perfect linear relationship.
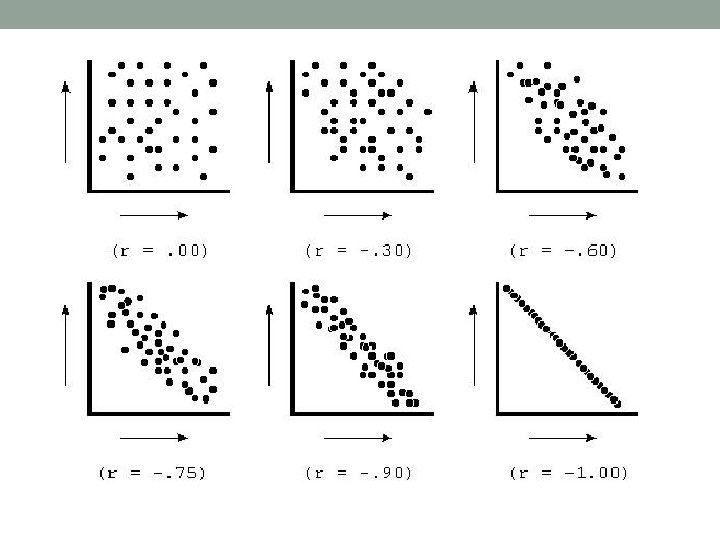
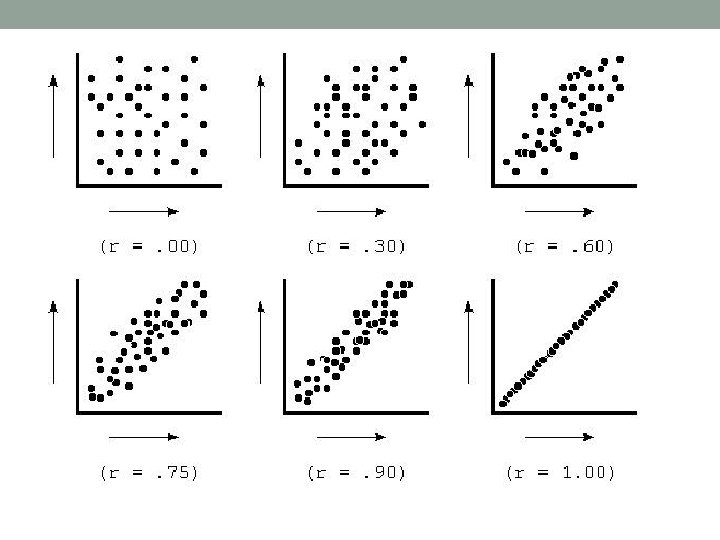

Strength Strong -1. 0 -0. 8 Weak -0. 5 Moderate 0 0. 5 Weak 0. 8 1. 0 Strong

Correlation Practice For each graph, estimate the correlation r and interpret it in context. Answer choices: 1. 2. 3. 4. 5. 6. r ≈ -- 0. 6 r ≈ -- 0. 1 r ≈ 0. 3 r ≈ 0. 9 r ≈ -- 0. 8 r ≈ 0. 5 4. r ≈ 0. 9

Correlation Practice For each graph, estimate the correlation r and interpret it in context. Answer choices: 1. 2. 3. 4. 5. 6. r ≈ -- 0. 6 r ≈ -- 0. 1 r ≈ 0. 3 r ≈ 0. 9 r ≈ -- 0. 8 r ≈ 0. 5 6. r ≈ 0. 5

Correlation Practice For each graph, estimate the correlation r and interpret it in context. Answer choices: 1. 2. 3. 4. 5. 6. r ≈ -- 0. 6 r ≈ -- 0. 1 r ≈ 0. 3 r ≈ 0. 9 r ≈ -- 0. 8 r ≈ 0. 5 3. r ≈ 0. 3

Correlation Practice For each graph, estimate the correlation r and interpret it in context. Answer choices: 1. 2. 3. 4. 5. 6. r ≈ -- 0. 6 r ≈ -- 0. 1 r ≈ 0. 3 r ≈ 0. 9 r ≈ -- 0. 8 r ≈ 0. 5 2. r ≈ - 0. 1

Example, p. 153 r = 0. 936 Interpret the value of r in context. The correlation of 0. 936 confirms what we see in the scatterplot; there is a strong, positive linear relationship between points per game and wins in the SEC.

Example, p. 153 r = 0. 936 The point highlighted in red on the scatterplot is Mississippi. What effect does Mississippi have on the correlation. Justify your answer. Mississippi makes the correlation closer to 1 (stronger). If Mississippi were not included, the remaining points wouldn’t be as tightly clustered in a linear pattern.

Calculating Correlation How to Calculate the Correlation r Suppose that we have data on variables x and y for n individuals. The values for the first individual are x 1 and y 1, the values for the second individual are x 2 and y 2, and so on. The means and standard deviations of the two variables are x-bar and sx for the x-values and y-bar and sy for the y-values. The correlation r between x and y is:

Facts About Correlation 1. Correlation makes no distinction between explanatory and response variables. 2. r does not change when we change the units of measurement of x, y, or both. 3. The correlation r itself has no unit of measurement.

Cautions • Correlation requires that both variables be quantitative • Correlation does not describe curved relationships between variables, no matter how strong the relationship is. Because of this, r = - 1 or 1 does not guarantee a linear relationship. • Correlation is not resistant. r is strongly affected by a few outlying observations. • Correlation is not a complete summary of two-variable data.

HW Due: Block Day • p. 161 #15 – 18, 21, 30
- Slides: 17