Describing Quantitative Data with numbers Measures of Center

Describing Quantitative Data with numbers: Measures of Center and Spread Section 1. 3 Reference Text: The Practice of Statistics, Fourth Edition. Starnes, Yates, Moore

Today’s Objectives • Define specific measures of center: Mean and Median. • Recognize the 5 -number summary of data. • Determine Interquartile Range (IQR) – outliers by the 1. 5 IQR rule. • Draw boxplots. – Break • Describe RESISTANCE as it applies to mean and median. • Standard Deviation

Some Humor…

Measures of Center • The MEAN of a data set is its arithmetic average. – Use the symbol for mean. – Calculate by adding all the numbers and divide by how many individual numbers there are. Example: 11+72+83+94+25 • The MEDIAN of a data set is its midpoint. – That is, half the data fall above the median and half fall below the median. – Use “med” for median (TI uses “med”). – Sort data from low to high, count to middle. • The MODE is the most frequently occurring value…We will rarely be interested in it.

Rainy Days! For the last 15 years, I have kept track of the number of rainy days we had in April. The results are below. Calculate the mean, median, and mode of these data. Here are the data: 16, 3, 16, 15, 13, 26, 15, 13, 14, 3, 10, 8, 9, 2, 9 Mean: _____ Median: _____ Mode: _____

Rainy Days! For the last 15 years, I have kept track of the number of rainy days we had in April. The results are below. Calculate the mean, median, and mode of these data. Here are the data: 16, 3, 16, 15, 13, 26, 15, 13, 14, 3, 10, 8, 9, 2, 9 Rearranged: 2, 3, 3, 8, 9, 9, 10, 13, 14, 15, 16, 26 Mean: ____11. 46_____ Median: ____13_____ Mode: _____3, 9, 13, 15, 16_____

5 Number Summary • Consisting of: Minimum, Q 1, Medium, Q 3, and Maximum – Minimum: Smallest value of the sample data – Q 1: first quartile, this is the median of the lower half of data [lower 25% of data falls in this range] – Median: technically Q 2, middle point of sample data – Q 3: third quartile, this is the median of the upper half of data [upper 25% of data falls in this range] – Maximum: largest value of the sample data – This 5 number summary can be used to create a boxplot. (aka box and whisker plot)

Rainy Days! For the last 15 years, I have kept track of the number of rainy days we had in April. The results are below. Find the 5 number summary, IQR, and Range Here are the data: 2, 3, 3, 8, 9, 9, 10, 13, 14, 15, 16, 26 Min: _______ Q 1: ____ Med: _______ Q 3: ____ Max: _______ Range: _______ IQR: ____

Rainy Days! For the last 15 years, I have kept track of the number of rainy days we had in April. The results are below. Find the 5 number summary, IQR, and Range Here are the data: 2, 3, 3, 8, 9, 9, 10, 13, 14, 15, 16, 26 Min: ___2____ Q 1: ____8____ Med: ___13____ Q 3: _____15___ Max: ___26____ Range: _______ IQR: ____

Measures of Spread: 5 number summary • RANGE = maximum value – minimum value • Inter-quartile range (IQR) = Q 3 – Q 1

Rainy Days! For the last 15 years, I have kept track of the number of rainy days we had in April. The results are below. Find the 5 number summary, IQR, and Range Here are the data: 2, 3, 3, 8, 9, 9, 10, 13, 14, 15, 16, 26 Min: ___2____ Q 1: ____8____ Med: ___13____ Q 3: _____15___ Max: ___26____ Range: _______ IQR: ____

Rainy Days! For the last 15 years, I have kept track of the number of rainy days we had in April. The results are below. Find the 5 number summary, IQR, and Range Here are the data: 2, 3, 3, 8, 9, 9, 10, 13, 14, 15, 16, 26 Min: ___2____ Q 1: ____8____ Med: ___13____ Q 3: _____15___ Max: ___26____ Range: ___24___ IQR: ____7____

Boxplots: Box and Whisker Plot

• Construct a Boxplot Example – Consider our NY travel times data. Construct a boxplot. 30 5 25 40 20 10 15 30 20 15 20 85 15 60 60 40 45 5 10 10 15 15 20 20 20 25 30 30 40 40 45 60 60 65 85 Min=5 Q 1 = 15 M = 22. 5 Q 3= 42. 5 Max=85 Recall, this is an outlier by the 1. 5 x IQR rule Describing Quantitative Data 10

Make a box plot! • Lets make a box plot using the same important information from the 5 number summary! Lets use the information from your 1. 2 homeworksheet, number 10 84, 76, 92, 88, 96, 68, 80, 92, 88, 76, 96

Answer • • The mean is 11. 5 Data: 2, 3, 3, 8, 9, 9, 10, 13, 14, 15, 16, 26 The median is 13 For the boxplot, we also need – Minimum = 2 and Maximum = 26 – First Quartile = 8 and Third Quartile = 15
 “too far” removed from the main body")
Outliers – Outliers are observations (data points) “too far” removed from the main body of data. – Outliers often skew our data. We can calculate how to find outliers with the “ 1. 5 Rule” for outliers. • Upper Outlier: Any observation above • Lower Outlier: Any observation below Q 3 + 1. 5 x IQR Q 1 – 1. 5 x IQR – How did this apply to the “Rainy Days”? The next slide has the data again….

Rainy Days! For the last 15 years, I have kept track of the number of rainy days we had in April. The results are below. Find the 5 number summary, IQR, and Range Here are the data: 2, 3, 3, 8, 9, 9, 10, 13, 14, 15, 16, 26 Min: ___2____ Q 1: ____8____ Med: ___13____ Q 3: _____15___ Max: ___26____ Range: ___24___ IQR: ____7____ Outliers? Upper: Q 3 + 1. 5(IQR) Lower: Q 1 – 1. 5(IQR)

Rainy Days! For the last 15 years, I have kept track of the number of rainy days we had in April. The results are below. Find the 5 number summary, IQR, and Range Here are the data: 2, 3, 3, 8, 9, 9, 10, 13, 14, 15, 16, 26 Min: ___2____ Q 1: ____8____ Med: ___13____ Q 3: _____15___ Max: ___26____ Range: ___24___ IQR: ____7____ Outliers? Upper: Q 3 + 1. 5(IQR)= 25. 5 Lower: Q 1 – 1. 5(IQR)= -2. 5

Outlier in our data! • 26 is an outlier for our data! • We must take this into account when constructing a boxplot • When constructing a box plot we now only extend the “whisker” to the point of the data that stays within our boundaries for outliers. • The way we represent an outlier on a box plot is just a single point (dot).

Answer • Data: 2, 3, 3, 8, 9, 9, 10, 13, 14, 15, 16, 26 • The median is 13 • For the boxplot, we also need – Minimum = 2 and Maximum = 26 – First Quartile = 8 and Third Quartile = 15

C. U. S. S put to use with rainy days example: • After we have crunched numbers and calculated all of this information that describes this quantitative data, we need to communicate it back into context! • My write up: The data recorded for the number of rainy days in April for the past 15 years appears to have a median number of 13 rainy days with one outlier of 26 rainy days. The data appears to have a slight skewness to the right with a spread of 24 rainy days; this includes the outlier found in our recorded data. Center: “…median number of 13 rainy days…” Unusual points: “…with one outlier of 26 rainy days. ” Spread: “…with a spread of 24 rainy days” Shape: “…the data appears to have a slight skewness to the right…”

Resistance • What does the word resistant mean? In statistics: – The median is resistant to outliers! • A really large/small number relatively will not affect the median. – Think of the median as Gandalf “you shall not pass!” – The mean is not resistant to outliers! • Really Large/small numbers can change the average, it gets “pulled” to the left or right. (so is Standard Deviation)

Bell Curve • Statistics is about representing data and analyzing it in order to report back the findings. • Part of representing data is through graphs. Pie charts, histograms, stem-and-leaf plot, and box plots. • All of these graphs can be transformed from one or the other. • One of the most useful visuals in statistics is the Standard Normal Curve. Or “bell curve” • Here is what a bell curve looks like, and also a matching box plot.

Notice how the median is centered in the middle of the bell curve. Could we break the box plot up into the percentages of data that falls between each quartile? ?

Empirical rule 68 -95 -99. 7% •

Empirical rule

Standard Deviation Since we will be sampling from different areas of interest, such Aircraft! as … Medical Records! Baseball! Insurance Records! Cars!

Standard Deviation Since we will be sampling from different areas of interest, such as … We need to make sure we are talking about standard deviation in context to the problem! Every set of sample data h baseball as its own unique sample standard deviation. Since we are touching the basis of statistics at this point we will not worry about distinguishing between what it means to calculate Sample Standard Deviation versus the Population Standard Deviation. At this point we want to get down the basics, then later down in our stats career we will make sure to distinguish between the differences!

Calculating the Standard Deviation •
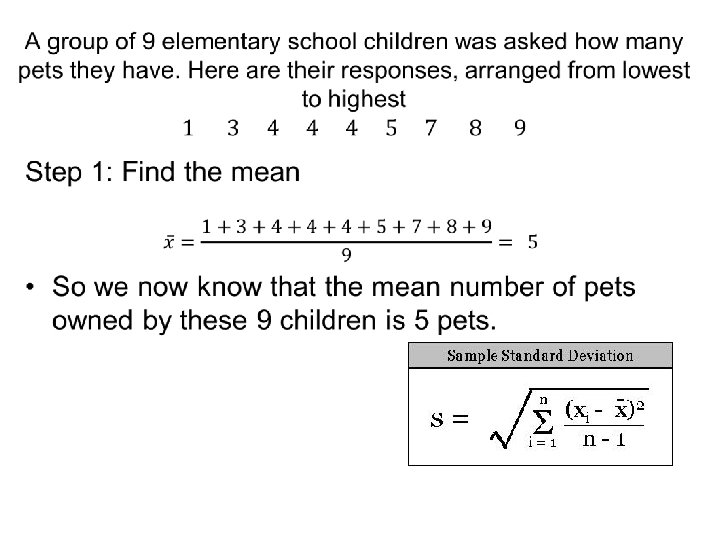

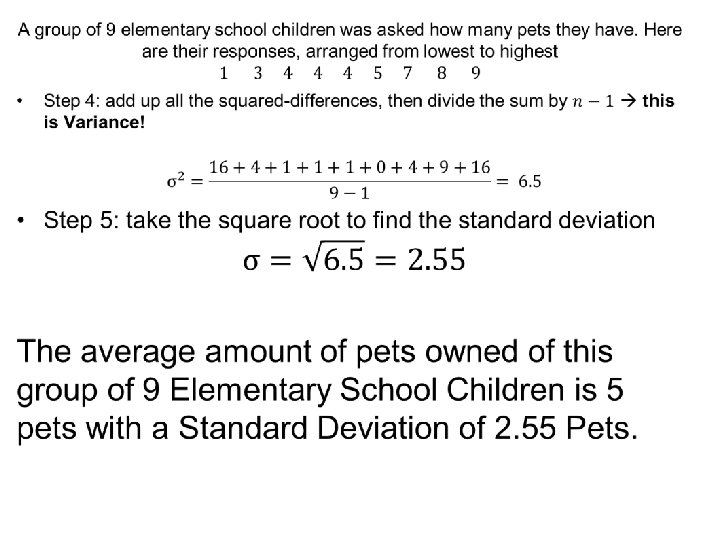
• Step 2: Subtract the mean from each and every data point we have. • Step 3: square the differences from each and every point we have.

68 -95 -99. 7 Rule With Pets •

Use 1 -Var Stats for s • Copy the list RAIN into L 1 • Tap STAT : CALC : 1 -Var Stats L 1 • Read the result as Sx – Note: There is also σx which is the standard deviation calculated by dividing by n rather than n-1. It is used for populations rather than samples, and we will deal with it later.

Today’s Objectives • Define specific measures of center: Mean and Median. • Recognize the 5 -number summary of data. • Determine Interquartile Range (IQR) – outliers by the 1. 5 IQR rule. • Draw boxplots. • Describe RESISTANCE as it applies to mean and median. • Standard Deviation

Homework 1. 3 Homework Worksheet Continue working on Chapter 1 Reading Guide
- Slides: 37