
Describing Factorial Effects Interaction as a nonadditive joint

Describing Factorial Effects • Interaction as a “non-additive joint effect” of the Ivs • Kinds of means & kinds of effects • Inspecting tables to describe factorial data patterns • Inspecting line graphs to describe factorial data patterns • Inspecting bar graphs to describe factorial data patterns • Choosing among tables & graphs
Interpreting Factorial Results based on “Inspection” Now that we have the basic language we will practice examining and describing main effects and interactions based on tables, line graphs and bar graphs portraying factorial results. Once you know how to describe the results based on “inspection” it will be a very simple task to learn how to apply NHST to the process. As in other designs we have looked at “an effect” as a numerical difference between two “things”, in factorial analyses… Main effects involve differences between marginal means. Simple effects involve differences between cell means. Interactions involve the differences between simple effects.
The importance of “conditional” & “non-additive” effects… Brownies – great things… worthy of serious theory & research!!! The usual brownie is made with 4 blocks of chocolate and 2 cups of sugar. Replicated research tells us that the average rating of brownies made with this recipe is about 3 on a 10 point scale. My theory? People don’t really like brownies! What they really like is fudge! So, goes my theory, making brownies more “fudge-like” will make them better liked. How to make them more fudge-like, you ask? Add more sugar & more chocolate!!!
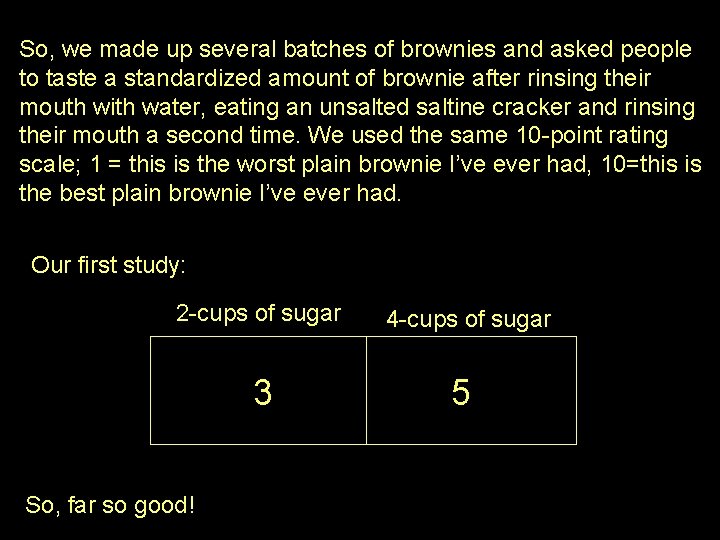
So, we made up several batches of brownies and asked people to taste a standardized amount of brownie after rinsing their mouth with water, eating an unsalted saltine cracker and rinsing their mouth a second time. We used the same 10 -point rating scale; 1 = this is the worst plain brownie I’ve ever had, 10=this is the best plain brownie I’ve ever had. Our first study: 2 -cups of sugar 3 So, far so good! 4 -cups of sugar 5
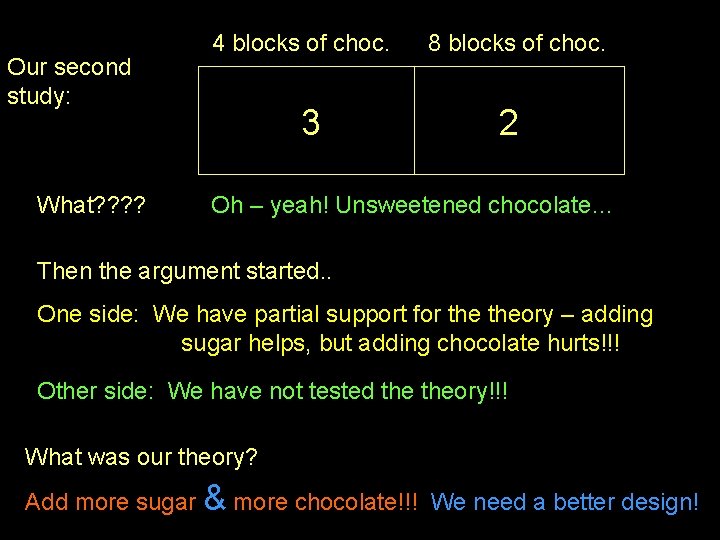
Our second study: What? ? 4 blocks of choc. 3 8 blocks of choc. 2 Oh – yeah! Unsweetened chocolate… Then the argument started. . One side: We have partial support for theory – adding sugar helps, but adding chocolate hurts!!! Other side: We have not tested theory!!! What was our theory? Add more sugar & more chocolate!!! We need a better design!
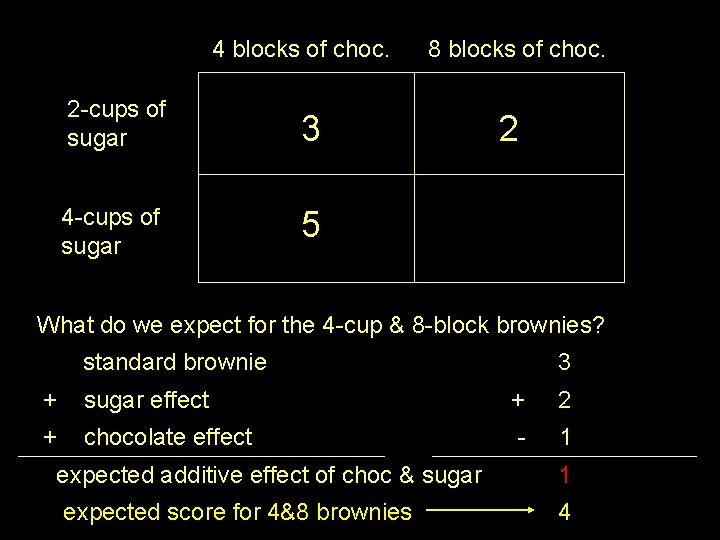
4 blocks of choc. 2 -cups of sugar 3 4 -cups of sugar 5 8 blocks of choc. 2 What do we expect for the 4 -cup & 8 -block brownies? standard brownie 3 + sugar effect + 2 + chocolate effect - 1 expected additive effect of choc & sugar 1 expected score for 4&8 brownies 4
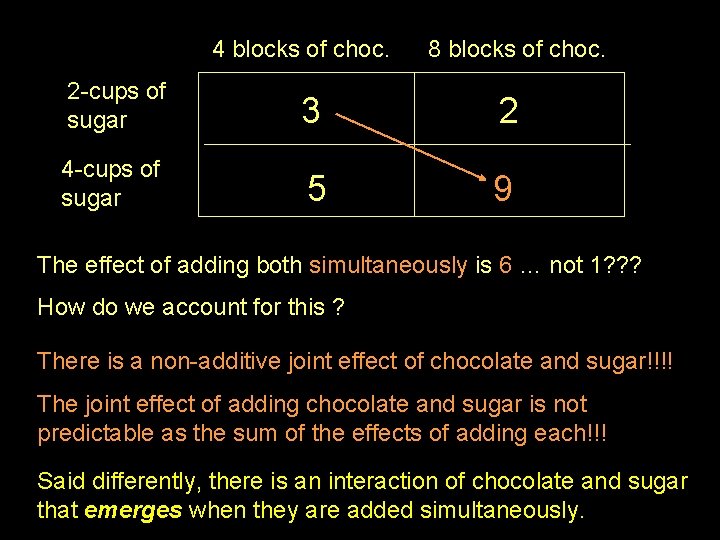
4 blocks of choc. 8 blocks of choc. 2 -cups of sugar 3 2 4 -cups of sugar 5 9 The effect of adding both simultaneously is 6 … not 1? ? ? How do we account for this ? There is a non-additive joint effect of chocolate and sugar!!!! The joint effect of adding chocolate and sugar is not predictable as the sum of the effects of adding each!!! Said differently, there is an interaction of chocolate and sugar that emerges when they are added simultaneously.
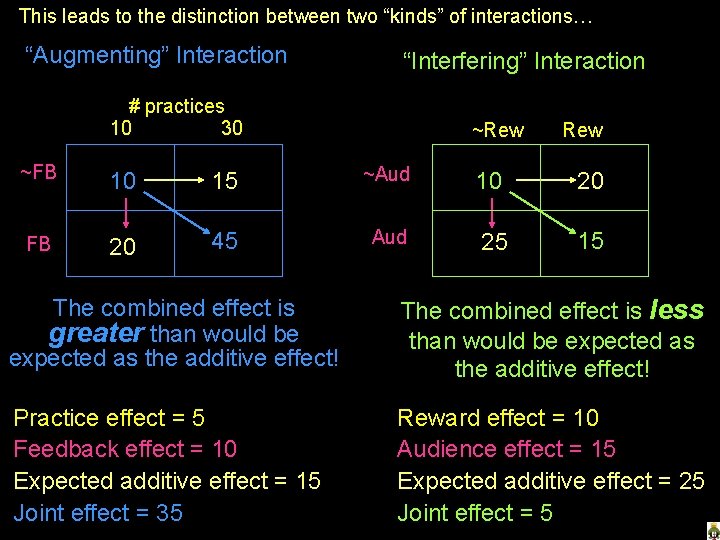
This leads to the distinction between two “kinds” of interactions… “Augmenting” Interaction “Interfering” Interaction # practices 10 30 ~Rew ~FB 10 15 ~Aud 10 20 FB 20 45 Aud 25 15 The combined effect is greater than would be expected as the additive effect! The combined effect is less than would be expected as the additive effect! Practice effect = 5 Feedback effect = 10 Expected additive effect = 15 Joint effect = 35 Reward effect = 10 Audience effect = 15 Expected additive effect = 25 Joint effect = 5
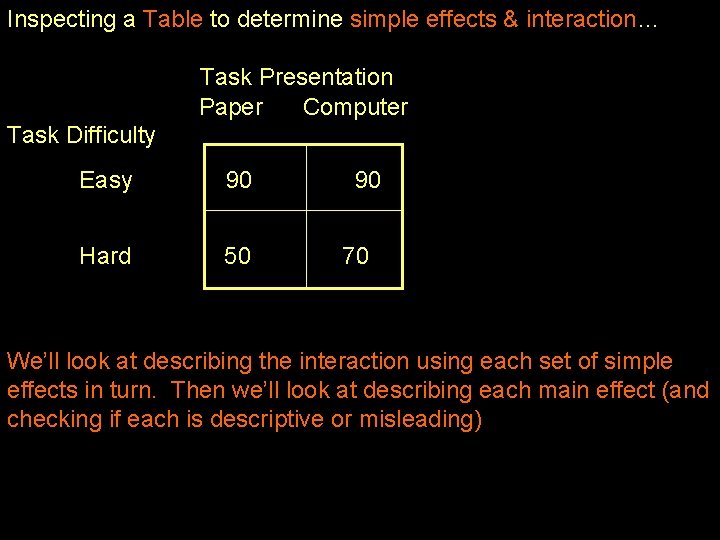
Inspecting a Table to determine simple effects & interaction… Task Presentation Paper Computer Task Difficulty Easy 90 Hard 50 90 70 We’ll look at describing the interaction using each set of simple effects in turn. Then we’ll look at describing each main effect (and checking if each is descriptive or misleading)
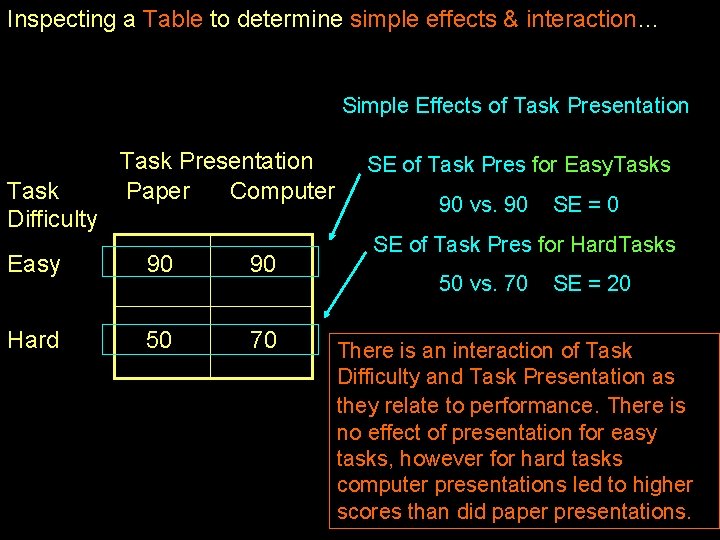
Inspecting a Table to determine simple effects & interaction… Simple Effects of Task Presentation Task Difficulty Task Presentation Paper Computer Easy 90 90 Hard 50 70 SE of Task Pres for Easy. Tasks 90 vs. 90 SE = 0 SE of Task Pres for Hard. Tasks 50 vs. 70 SE = 20 There is an interaction of Task Difficulty and Task Presentation as they relate to performance. There is no effect of presentation for easy tasks, however for hard tasks computer presentations led to higher scores than did paper presentations.
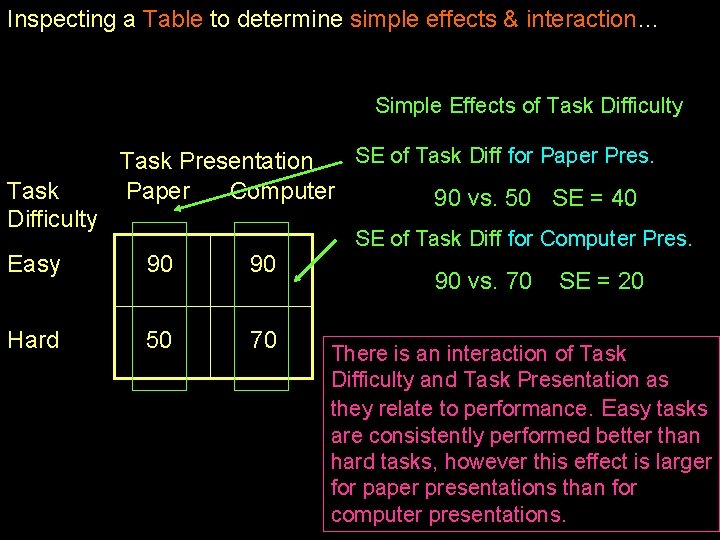
Inspecting a Table to determine simple effects & interaction… Simple Effects of Task Difficulty SE of Task Diff for Paper Pres. Task Presentation Paper Computer 90 vs. 50 SE = 40 Easy 90 90 Hard 50 70 SE of Task Diff for Computer Pres. 90 vs. 70 SE = 20 There is an interaction of Task Difficulty and Task Presentation as they relate to performance. Easy tasks are consistently performed better than hard tasks, however this effect is larger for paper presentations than for computer presentations.
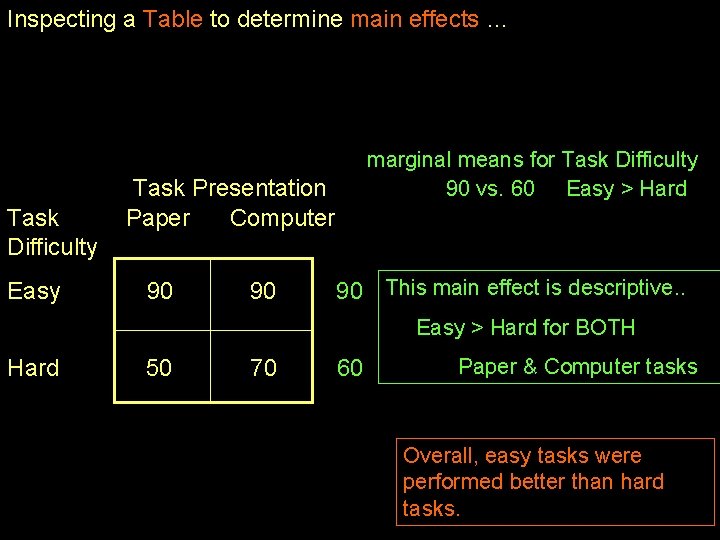
Inspecting a Table to determine main effects … Task Difficulty Easy marginal means for Task Difficulty 90 vs. 60 Easy > Hard Task Presentation Paper Computer 90 90 90 This main effect is descriptive. . Easy > Hard for BOTH Hard 50 70 60 Paper & Computer tasks Overall, easy tasks were performed better than hard tasks.
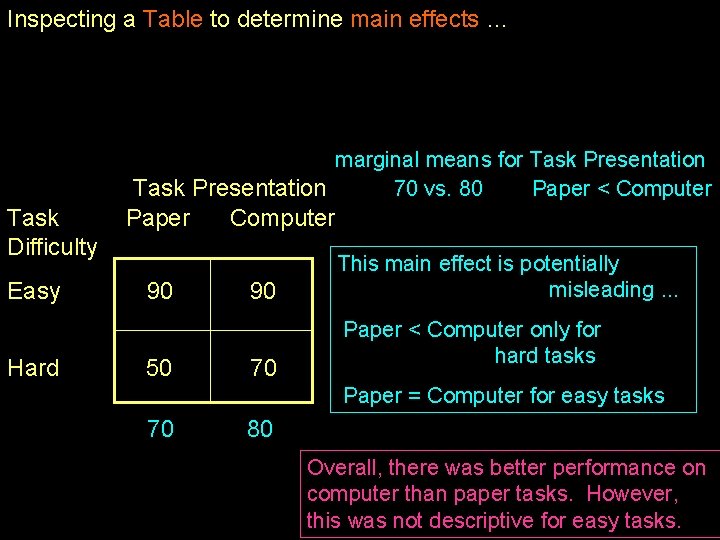
Inspecting a Table to determine main effects … marginal means for Task Presentation 70 vs. 80 Paper < Computer Task Difficulty Easy Hard Paper 90 50 Computer 90 70 This main effect is potentially misleading. . . Paper < Computer only for hard tasks Paper = Computer for easy tasks 70 80 Overall, there was better performance on computer than paper tasks. However, this was not descriptive for easy tasks.
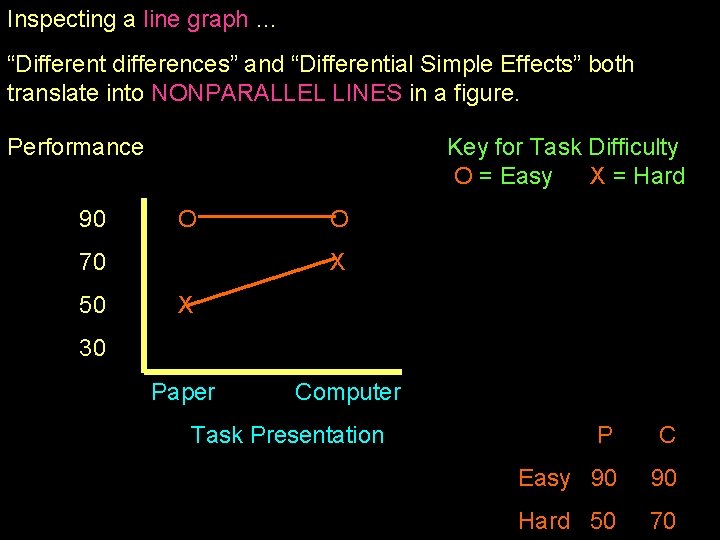
Inspecting a line graph … “Different differences” and “Differential Simple Effects” both translate into NONPARALLEL LINES in a figure. Performance 90 Key for Task Difficulty O = Easy X = Hard O 70 50 O X X 30 Paper Computer Task Presentation P C Easy 90 90 Hard 50 70
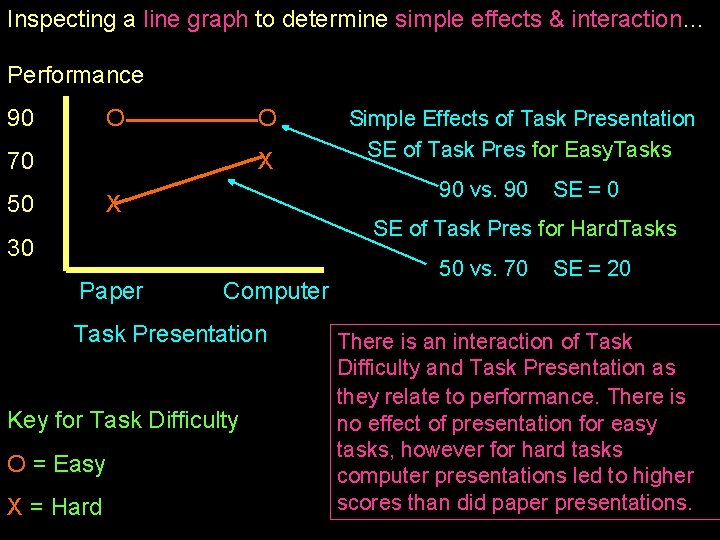
Inspecting a line graph to determine simple effects & interaction… Performance 90 O O 70 X 50 90 vs. 90 X Computer Task Presentation Key for Task Difficulty O = Easy X = Hard SE = 0 SE of Task Pres for Hard. Tasks 30 Paper Simple Effects of Task Presentation SE of Task Pres for Easy. Tasks 50 vs. 70 SE = 20 There is an interaction of Task Difficulty and Task Presentation as they relate to performance. There is no effect of presentation for easy tasks, however for hard tasks computer presentations led to higher scores than did paper presentations.

Inspecting a line graph to determine simple effects & interaction… Performance 90 Simple Effects of Task Difficulty O 70 50 O SE Task Diff for Paper Pres. X 90 vs. 50 SE = 40 SE Task Diff for Computer Pres. X 90 vs. 70 30 Paper Computer Task Presentation Key for Task Difficulty O = Easy X = Hard SE = 20 There is an interaction of Task Difficulty and Task Presentation as they relate to performance. Easy tasks are consistently performed better than hard tasks, however this effect is larger for paper presentations than for computer presentations.
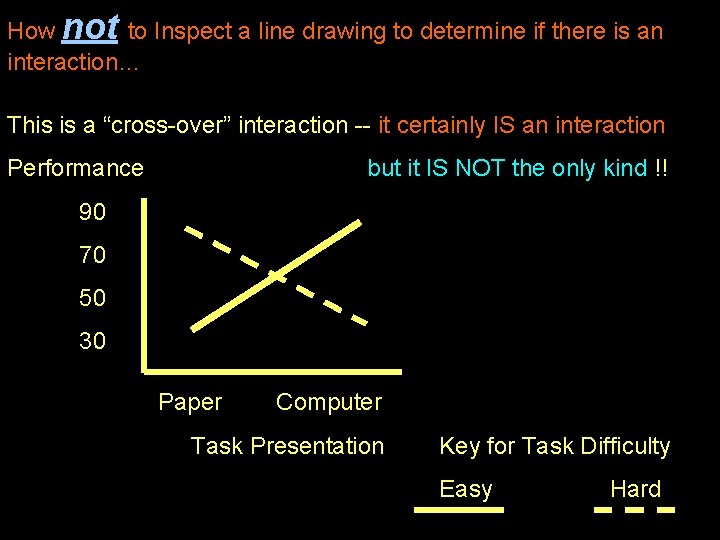
How not to Inspect a line drawing to determine if there is an interaction… This is a “cross-over” interaction -- it certainly IS an interaction Performance but it IS NOT the only kind !! 90 70 50 30 Paper Computer Task Presentation Key for Task Difficulty Easy Hard
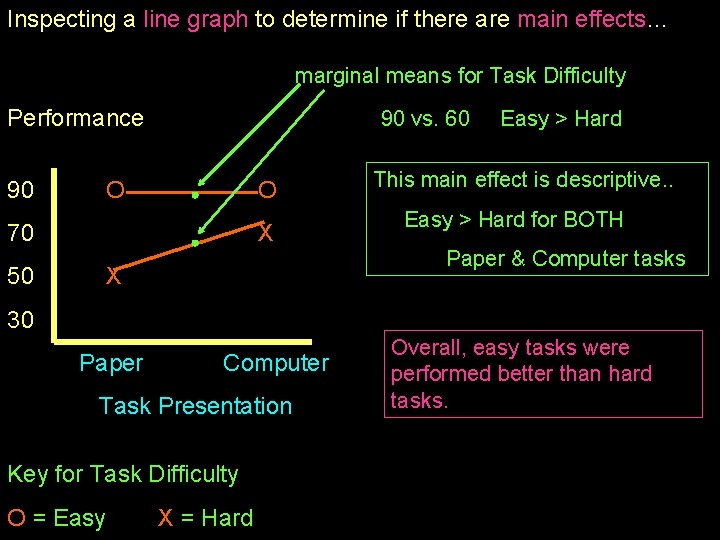
Inspecting a line graph to determine if there are main effects… marginal means for Task Difficulty Performance 90 90 vs. 60 O O 70 50 X Easy > Hard This main effect is descriptive. . Easy > Hard for BOTH Paper & Computer tasks X 30 Paper Computer Task Presentation Key for Task Difficulty O = Easy X = Hard Overall, easy tasks were performed better than hard tasks.
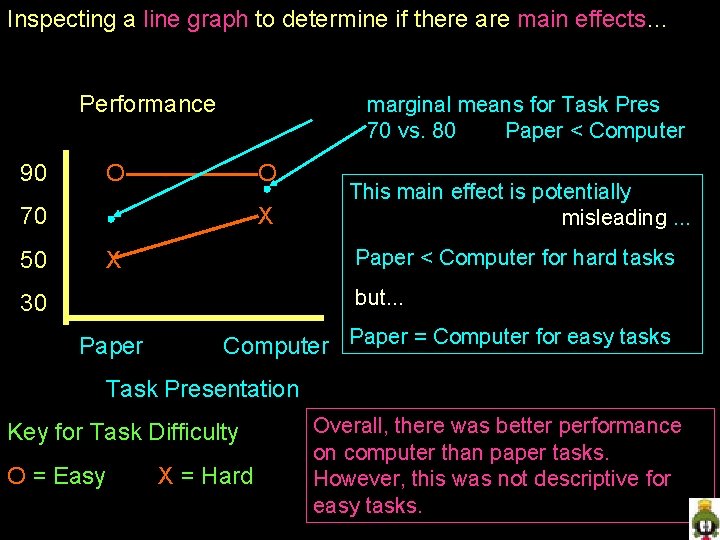
Inspecting a line graph to determine if there are main effects… Performance 90 marginal means for Task Pres 70 vs. 80 Paper < Computer O O 70 50 X This main effect is potentially misleading. . . Paper < Computer for hard tasks X but. . . 30 Paper Computer Paper = Computer for easy tasks Task Presentation Key for Task Difficulty O = Easy X = Hard Overall, there was better performance on computer than paper tasks. However, this was not descriptive for easy tasks.
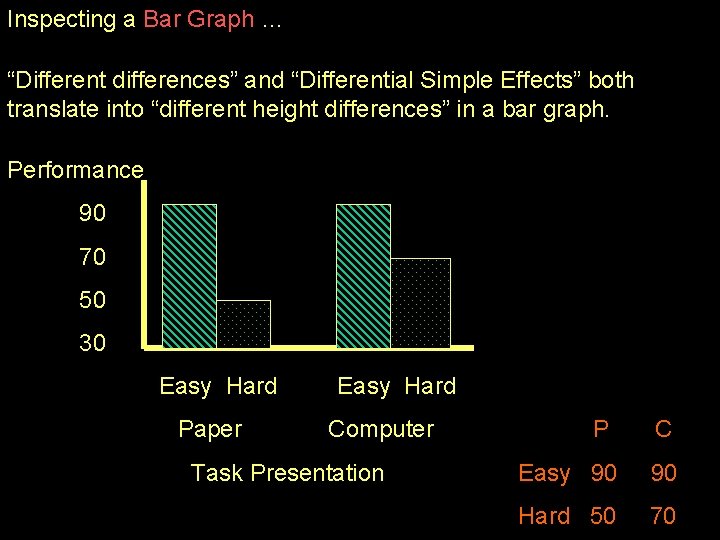
Inspecting a Bar Graph … “Different differences” and “Differential Simple Effects” both translate into “different height differences” in a bar graph. Performance 90 70 50 30 Easy Hard Paper Easy Hard Computer Task Presentation P C Easy 90 90 Hard 50 70
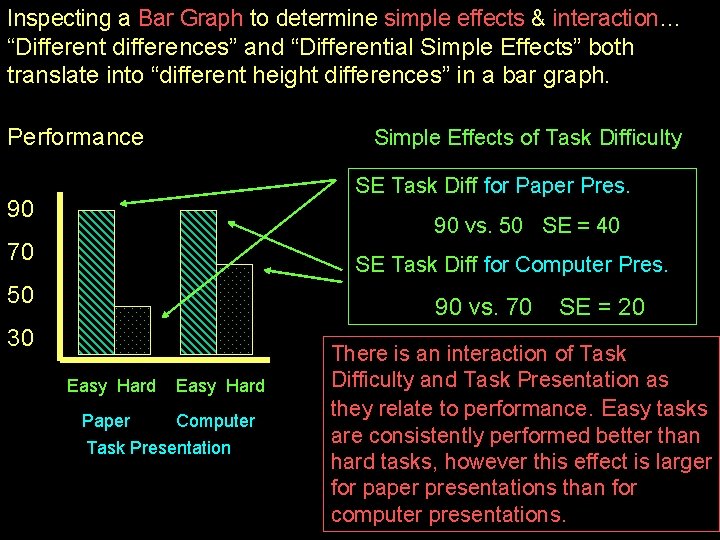
Inspecting a Bar Graph to determine simple effects & interaction… “Different differences” and “Differential Simple Effects” both translate into “different height differences” in a bar graph. Performance Simple Effects of Task Difficulty SE Task Diff for Paper Pres. 90 90 vs. 50 SE = 40 70 SE Task Diff for Computer Pres. 50 90 vs. 70 30 Easy Hard Paper Easy Hard Computer Task Presentation SE = 20 There is an interaction of Task Difficulty and Task Presentation as they relate to performance. Easy tasks are consistently performed better than hard tasks, however this effect is larger for paper presentations than for computer presentations.
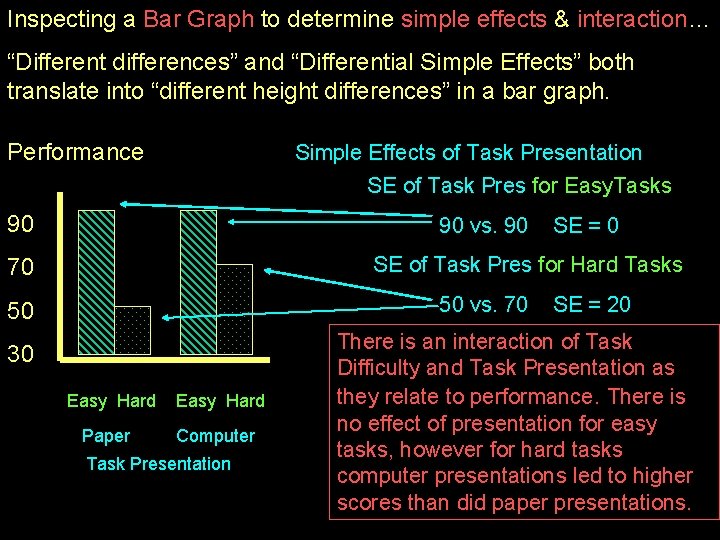
Inspecting a Bar Graph to determine simple effects & interaction… “Different differences” and “Differential Simple Effects” both translate into “different height differences” in a bar graph. Performance Simple Effects of Task Presentation SE of Task Pres for Easy. Tasks 90 90 vs. 90 SE = 0 SE of Task Pres for Hard Tasks 70 50 vs. 70 50 30 Easy Hard Paper Easy Hard Computer Task Presentation SE = 20 There is an interaction of Task Difficulty and Task Presentation as they relate to performance. There is no effect of presentation for easy tasks, however for hard tasks computer presentations led to higher scores than did paper presentations.
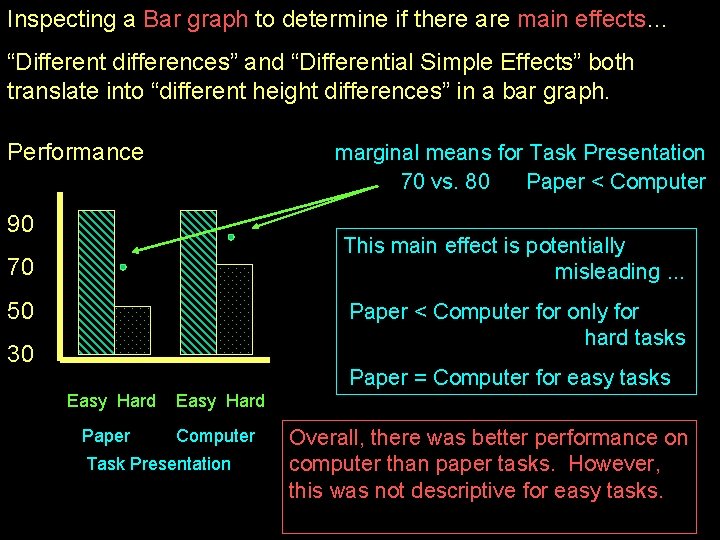
Inspecting a Bar graph to determine if there are main effects… “Different differences” and “Differential Simple Effects” both translate into “different height differences” in a bar graph. Performance marginal means for Task Presentation 70 vs. 80 Paper < Computer 90 This main effect is potentially misleading. . . 70 50 Paper < Computer for only for hard tasks 30 Paper = Computer for easy tasks Easy Hard Paper Easy Hard Computer Task Presentation Overall, there was better performance on computer than paper tasks. However, this was not descriptive for easy tasks.
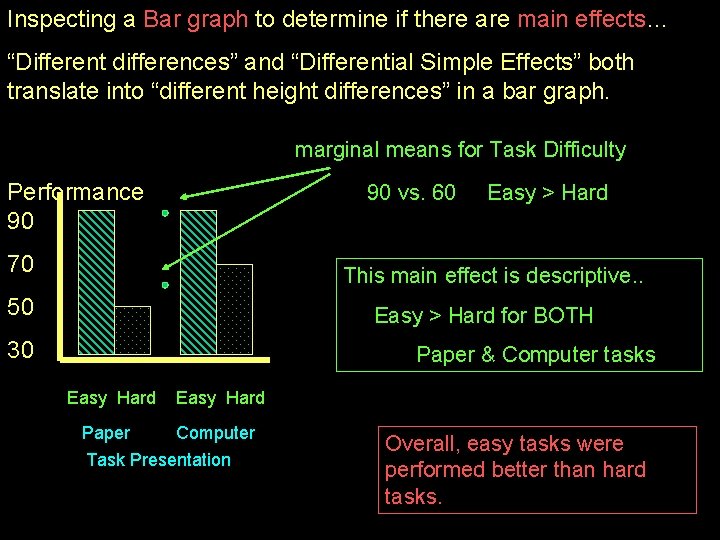
Inspecting a Bar graph to determine if there are main effects… “Different differences” and “Differential Simple Effects” both translate into “different height differences” in a bar graph. marginal means for Task Difficulty Performance 90 90 vs. 60 70 Easy > Hard This main effect is descriptive. . 50 Easy > Hard for BOTH 30 Paper & Computer tasks Easy Hard Paper Easy Hard Computer Task Presentation Overall, easy tasks were performed better than hard tasks.
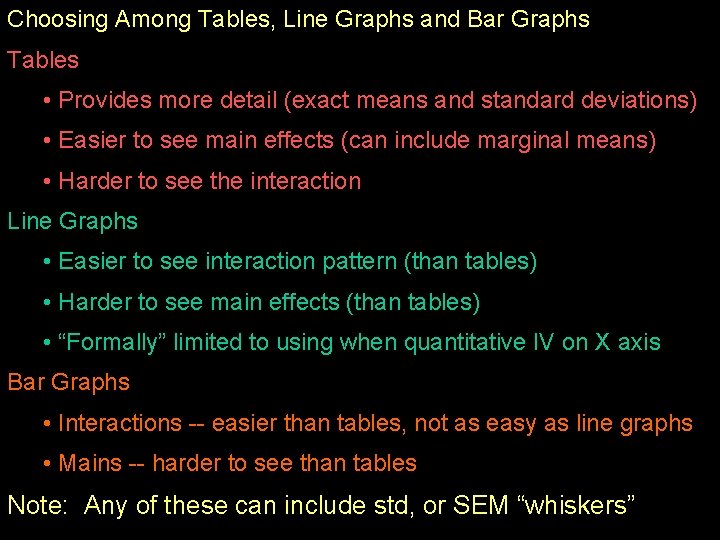
Choosing Among Tables, Line Graphs and Bar Graphs Tables • Provides more detail (exact means and standard deviations) • Easier to see main effects (can include marginal means) • Harder to see the interaction Line Graphs • Easier to see interaction pattern (than tables) • Harder to see main effects (than tables) • “Formally” limited to using when quantitative IV on X axis Bar Graphs • Interactions -- easier than tables, not as easy as line graphs • Mains -- harder to see than tables Note: Any of these can include std, or SEM “whiskers”
- Slides: 25