Describing Data Numerical Measures Copyright 2015 Mc GrawHill

Describing Data: Numerical Measures Copyright © 2015 Mc. Graw-Hill Education. All rights reserved. No reproduction or distribution without the prior written consent of Mc. Graw-Hill Education.
, the 中 位數")
Learning Objectives LO 3 -1 Compute and interpret the 平均數 (mean), the 中 位數 (median), and the 眾數 (mode). LO 3 -2 Compute a 加權平均數 (weighted mean). LO 3 -3 Compute and interpret the 幾何平均數 (geometric mean). LO 3 -4 Compute and interpret the 全距 (range), 變異數 (variance), and 標準差 (standard deviation). LO 3 -5 Explain and apply 柴比雪夫定理 (Chebyshev’s theorem) and the 經驗法則 (Empirical Rule). LO 3 -6 Compute the mean and standard deviation of 分組資料 (grouped data). 3 -*

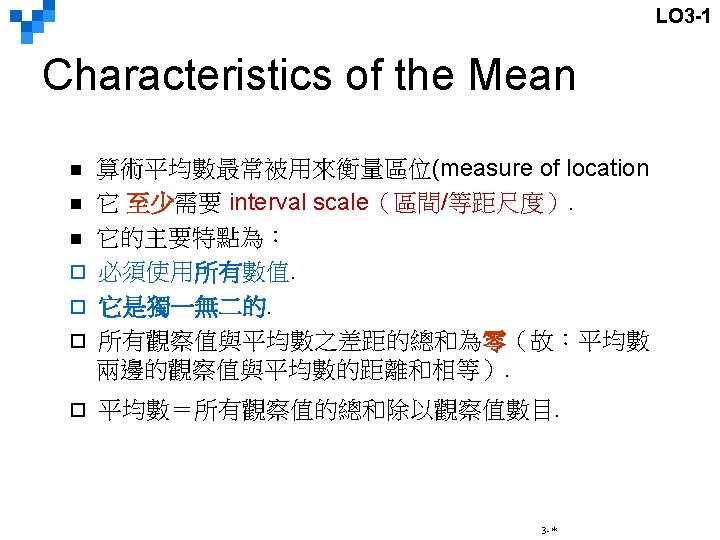
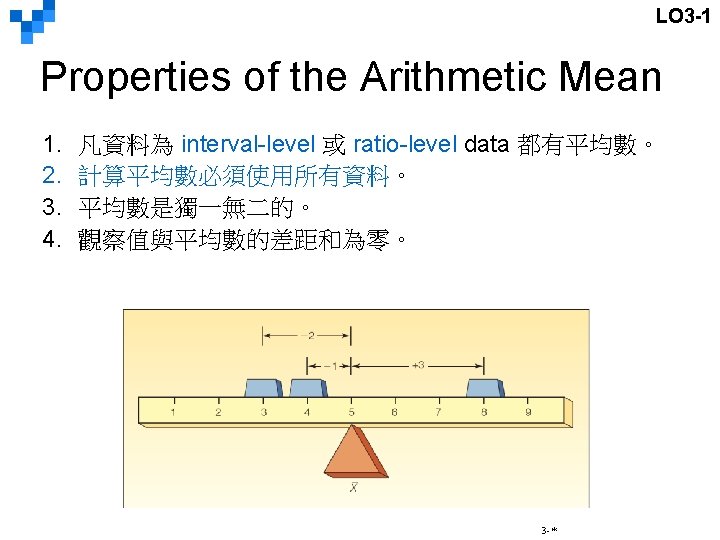
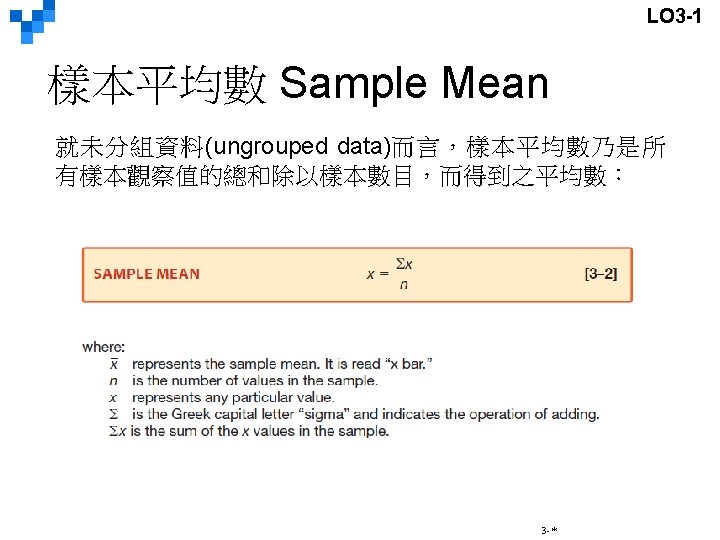
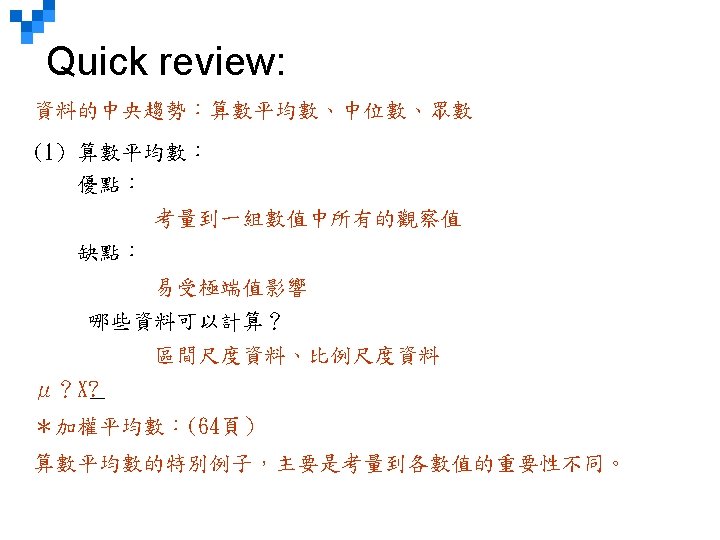
LO 3 -1 Compute and interpret the mean, the median, and the mode. Measures of Location n n The purpose of a measure of location is to pinpoint the center of a distribution of data. There are many measures of location. We will consider three: 1. The arithmetic mean (算數平均數) 2. The median (中位數) 3. The mode(眾數) 3 -*
 There are 42 exits on I-75")
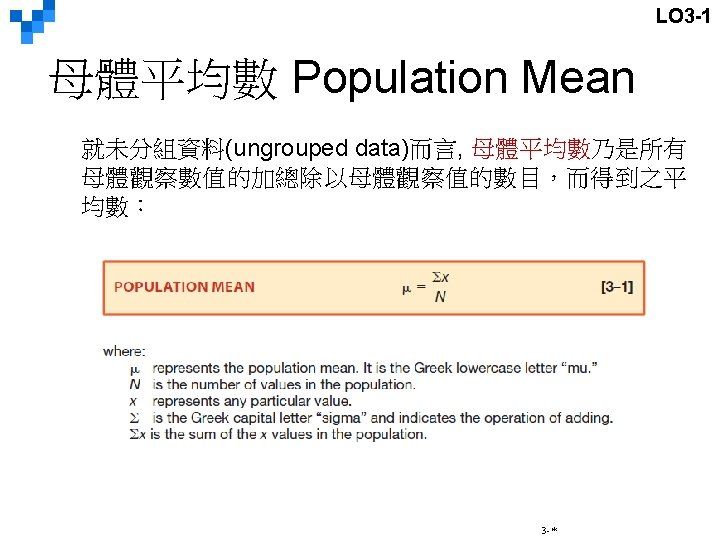
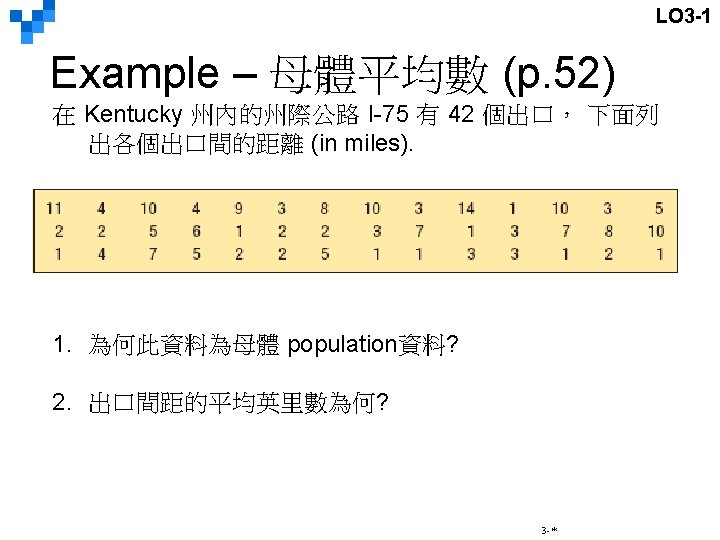
LO 3 -1 Example – 母體平均數 (p. 52) There are 42 exits on I-75 through the state of Kentucky. Listed below are the distances between exits (in miles). Why is this information a population? This is a population because we are considering all of the exits in Kentucky. What is the mean number of miles between exits? 3 -*
 versus 統計值(Statistic) PARAMETER A measurable characteristic of a population. (母體)參數")
LO 3 -1 參數(Parameter) versus 統計值(Statistic) PARAMETER A measurable characteristic of a population. (母體)參數 STATISTIC A measurable characteristic of a sample. (樣本)統計值 3 -*

 MODE The value of the observation")
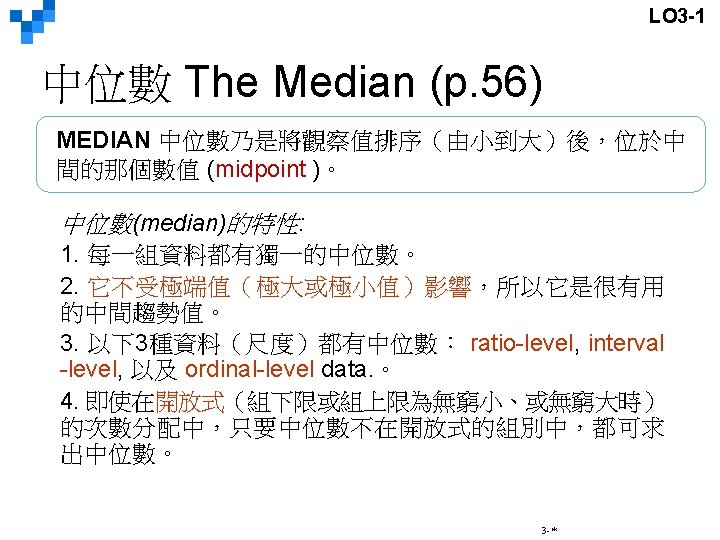
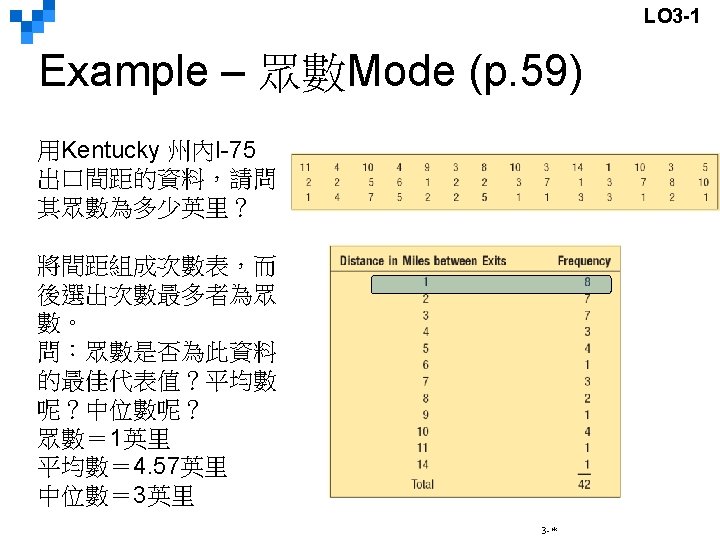
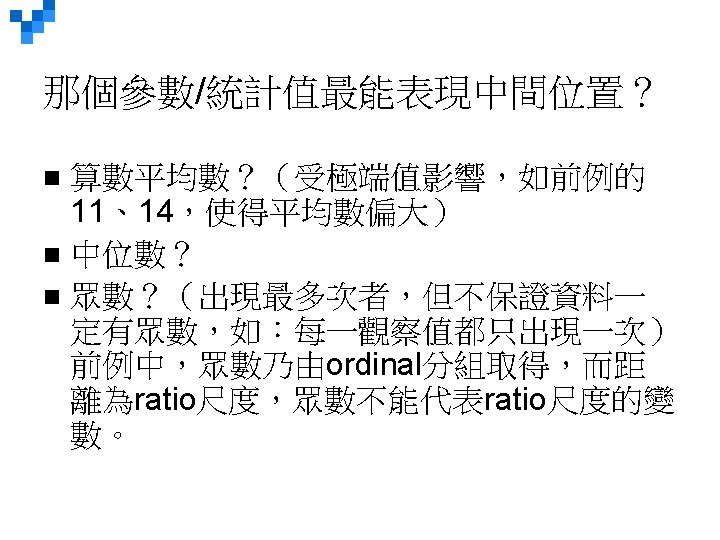
LO 3 -1 眾數 The Mode (p. 58) MODE The value of the observation that appears most frequently. 出現最多次的數值就是眾數 3 -*

LO 3 -1 Example - Mode Using the data measuring the distance in miles between exits on I-75 through Kentucky, what is the modal distance? Organize the distances into a frequency table and select the distance with the highest frequency. 3 -*

LO 3 -1 Mean, Median 以及 Mode 的相對位置
 The weighted")
LO 3 -2 Compute a weighted mean. 加權平均數 Weighted Mean (p. 64) The weighted mean of a set of numbers X 1, X 2, . . . , Xn, with corresponding weights w 1, w 2, . . . , wn, is computed with the following formula: 3 -*
 The Carter Construction Company支付其 26個按時計酬員 的時薪為:")
LO 3 -2 Example – Weighted Mean(p. 64) The Carter Construction Company支付其 26個按時計酬員 的時薪為: $16. 50, $19. 00, or $25. 00 per hour. 其中: 14 個為 $16. 50 、 10 個為 $19. 00 、而 2 個為 $25. 00 。 這 26個員 的平均時薪為多少? 3 -*
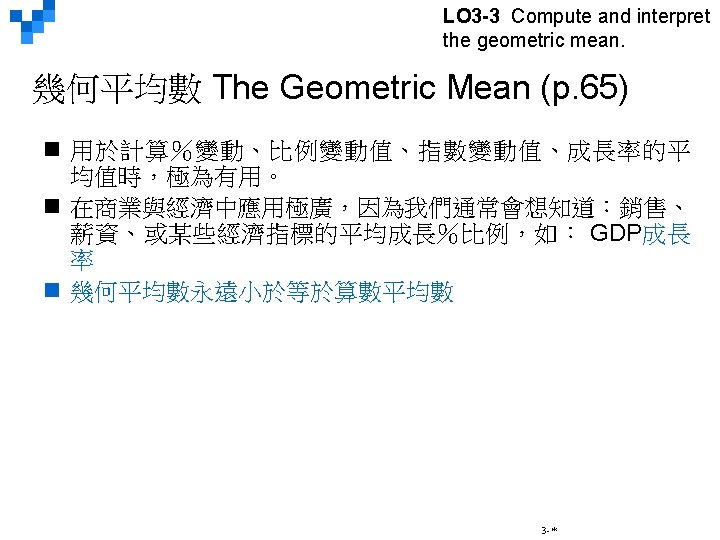

LO 3 -3 幾何平均數: Finding the Average Rate of Return over time EXAMPLE: (p. 66) The return on investment earned by Atkins Construction Company for four successive years was: 30 percent, 20 percent, -40 percent, and 200 percent. What is the geometric mean rate of return on investment? 3 -*

LO 3 -3 幾何平均數: Finding an Average Percent Change Over Time EXAMPLE: During the decade of the 1990 s, and into the 2000 s, Las Vegas, Nevada, was the fastest-growing city in the United States. The population increased from 258, 295 in 1990 to 584, 539 in 2011. This is an increase of 326, 244 people, or a 126. 3 percent increase over the period. What is the average annual increase? 3 -*
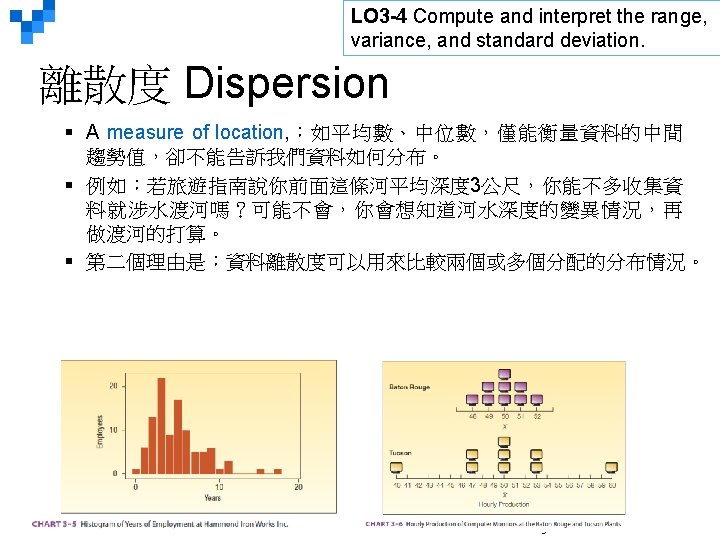

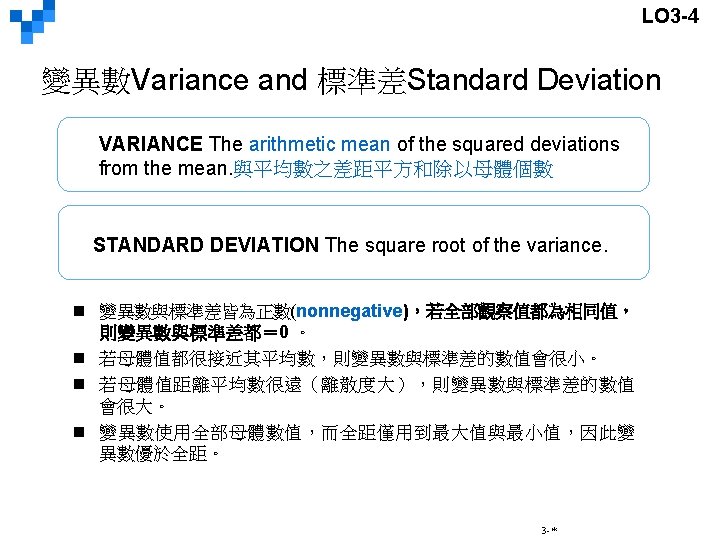
LO 3 -4 Measures of Dispersion n. Range 全距 n. Variance 變異數 n. Standard Deviation 標準差 3 -*
 The number of cappuccinos sold at the Starbucks")
LO 3 -4 Example – Range(全距) The number of cappuccinos sold at the Starbucks location in the Orange County Airport between 4 and 7 p. m. for a sample of 5 days last year were 20, 40, 50, 60, and 80. Determine the range for the number of cappuccinos sold. Range = Maximum value – Minimum value = 80 – 20 = 60 3 -*

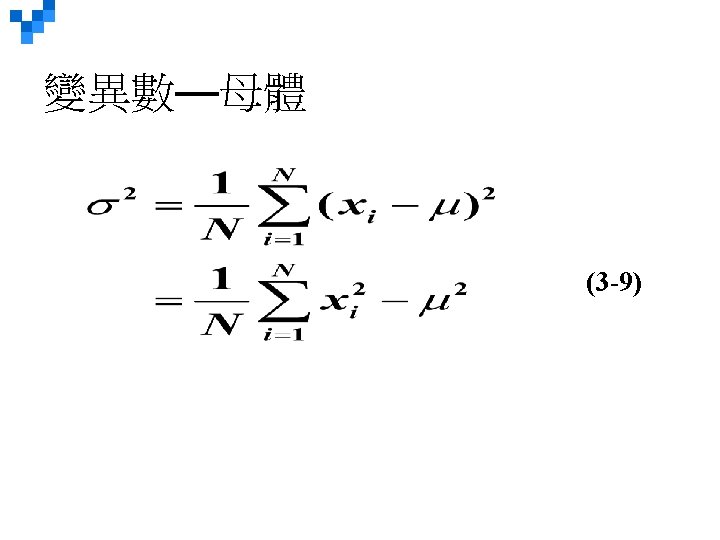
LO 3 -4 Computing the Variance Steps in computing the variance: Step 1: Find the mean. encethe Step 2: Find the mean, and square that difference. Step 3: Sum all the squared differences found in Step 2. Step number of items in the population. 3 -*
 issued during the")
LO 3 -4 Example – 變異數與標準差 The number of 罰單(traffic citations) issued during the last twelve months in Beaufort County, South Carolina, is reported below: What is the population variance? Step 1: Find the mean. 3 -*

LO 3 -4 Example –變異數與標準差 Continued What is the population variance? Step 2: Find the difference between each observation and the mean of 29, and square that difference. Step 3: Sum all the squared differences found in Step 2. Step 4: Divide the sum of the squared differences by the number of items in the population. 3 -*

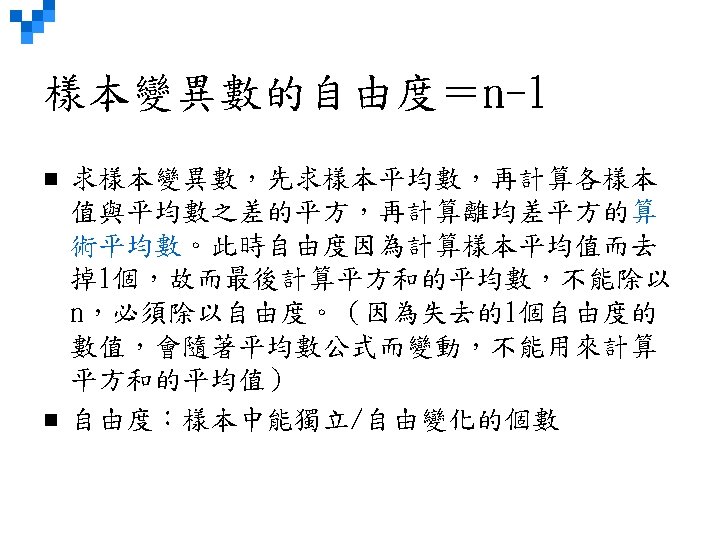
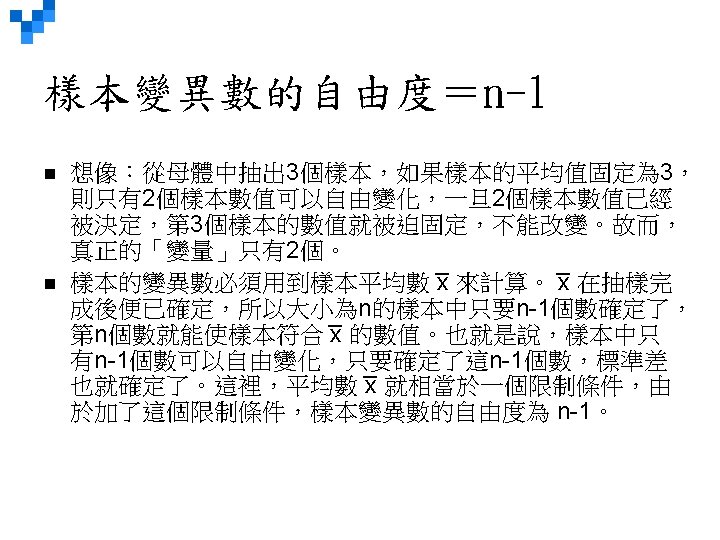
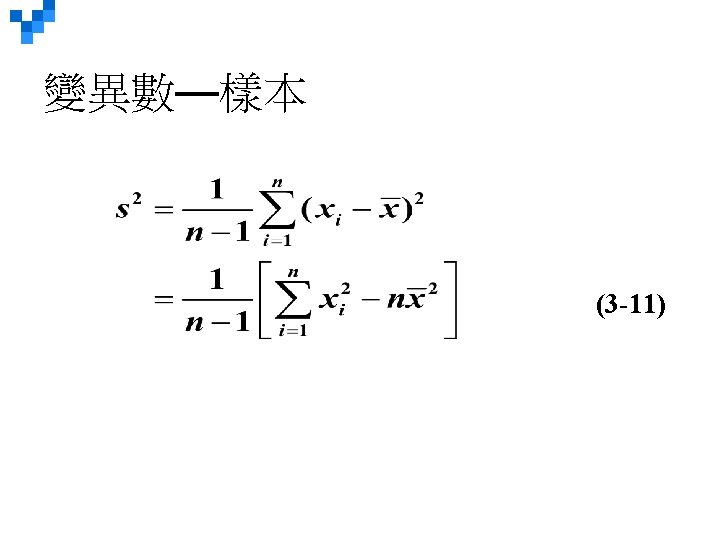
LO 3 -4 樣本變異數 Sample Variance 3 -*
 The hourly wages for a sample")
LO 3 -4 Example – 樣本變異數 (p. 76) The hourly wages for a sample of part-time employees at Home Depot are: $12, $20, $16, $18, and $19. The sample mean is $17. What is the sample variance? 3 -*

LO 3 -4 樣本標準差 Sample Standard Deviation 3 -*

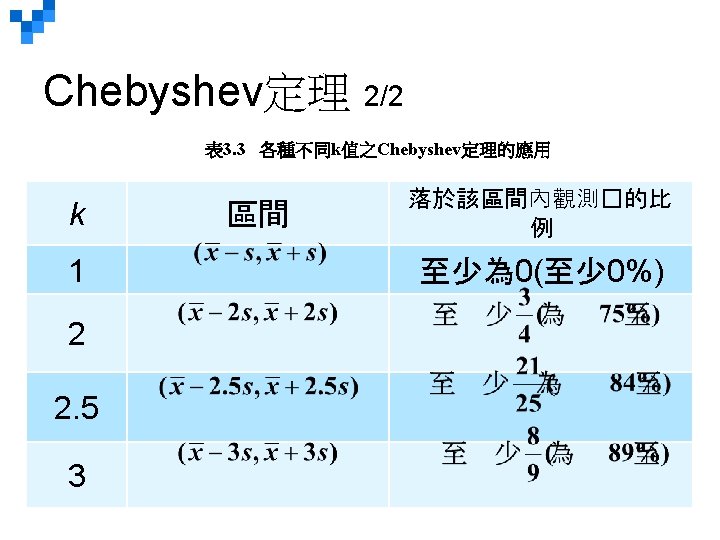
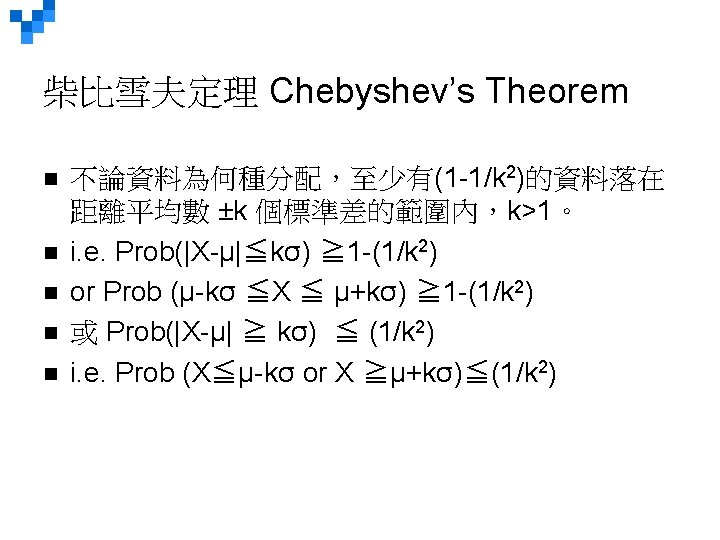
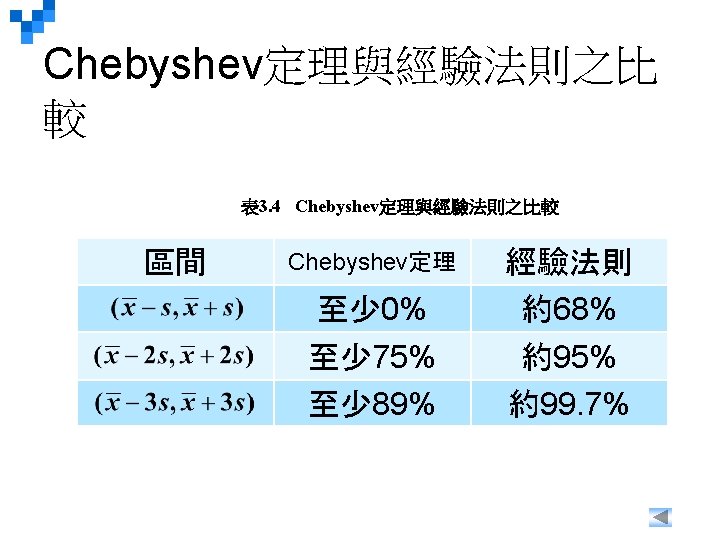
LO 3 -5 Explain and apply Chebyshev’s theorem and the Empirical Rule. 柴比雪夫定理 Chebyshev’s Theorem The arithmetic mean biweekly amount contributed by the Dupree Paint employees to the company’s profit-sharing plan is $51. 54, and the standard deviation is $7. 51. At least what percent of the contributions lie within plus 3. 5 standard deviations and minus 3. 5 standard deviations of the mean? 3 -*

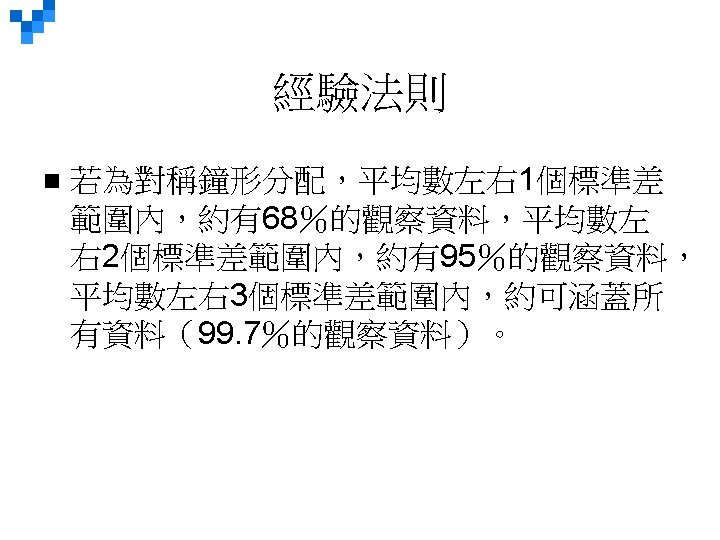
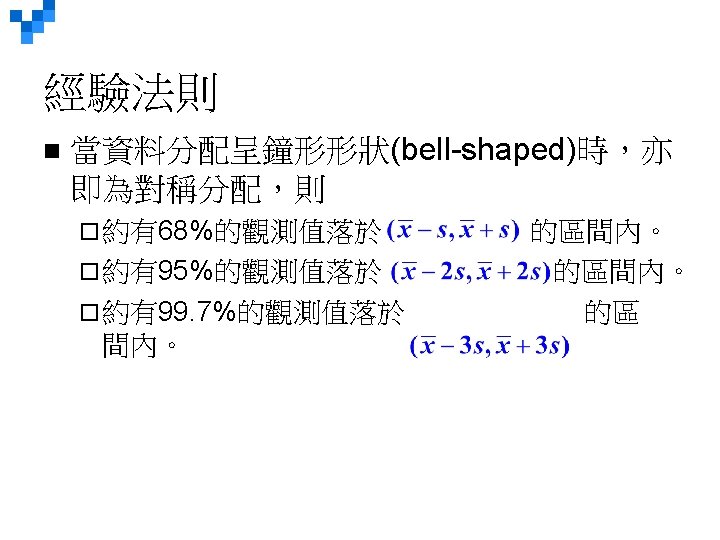
LO 3 -5 經驗法則 The Empirical Rule 3 -*
的算數平均數")
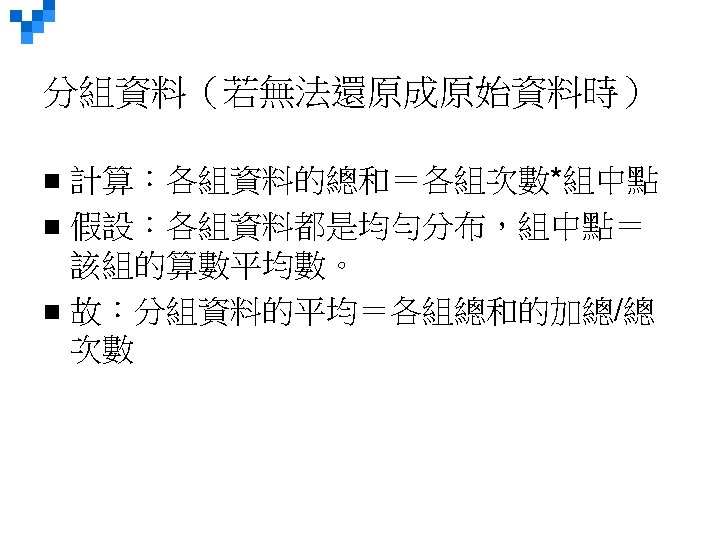
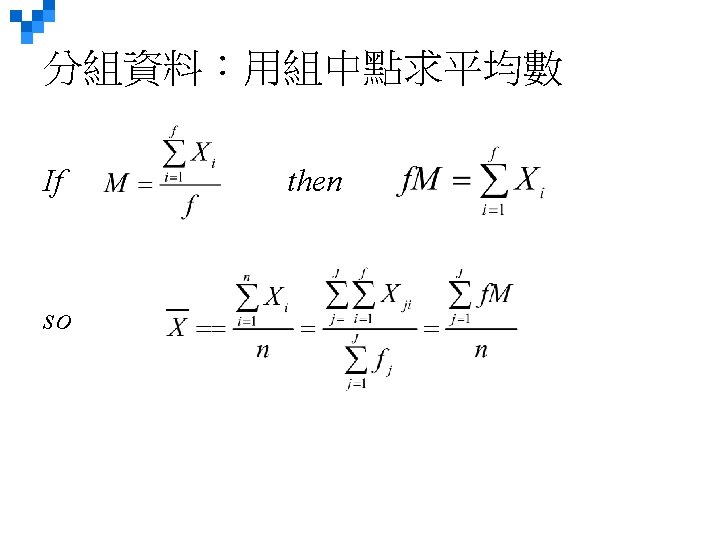
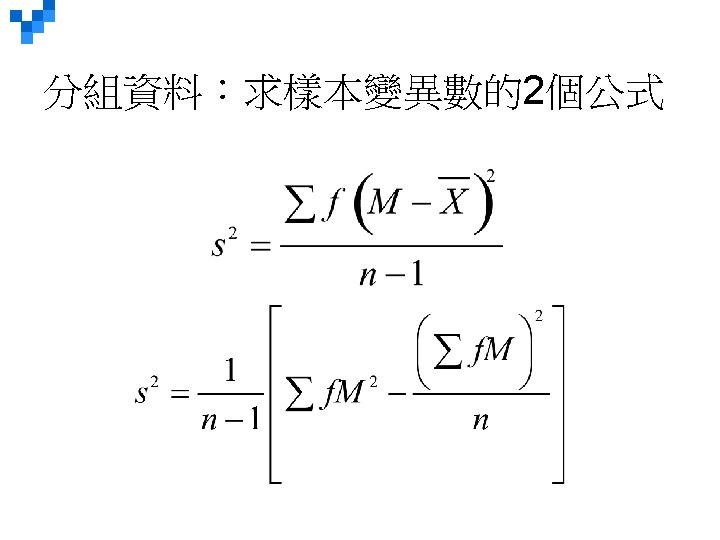
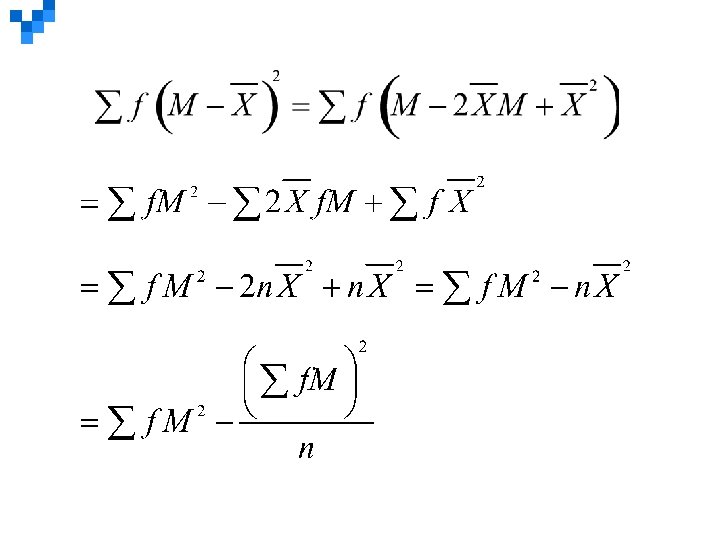
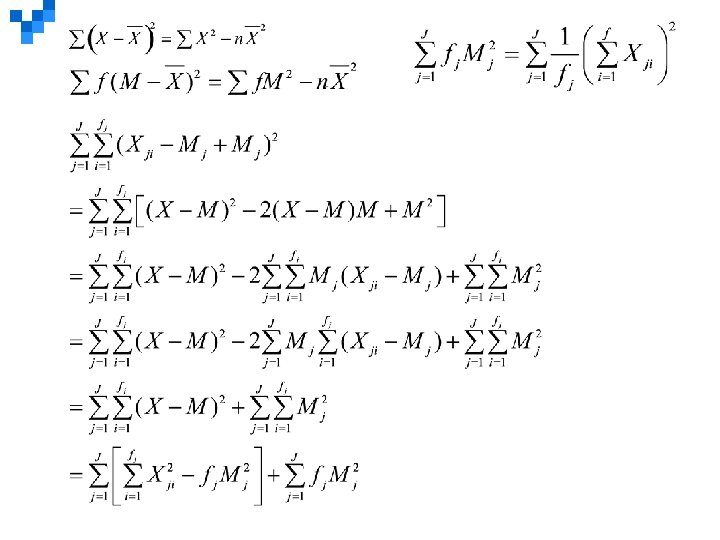
LO 3 -6 Compute the mean and standard deviation of grouped data. 分組資料(Grouped Data)的算數平均數 3 -*
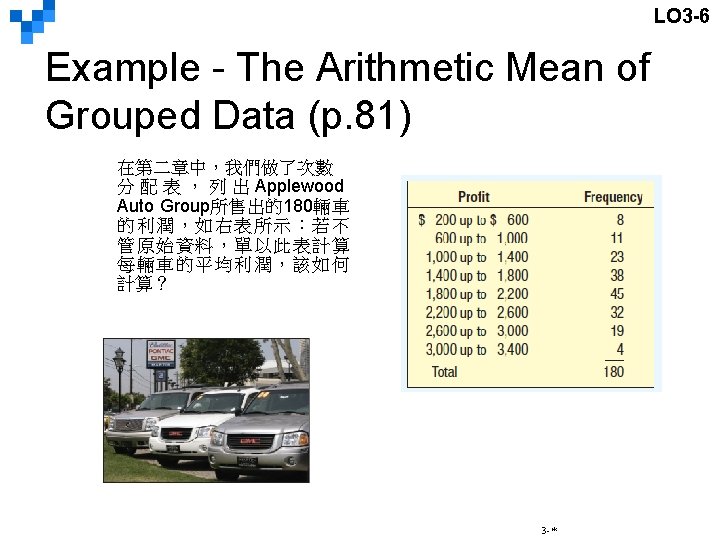
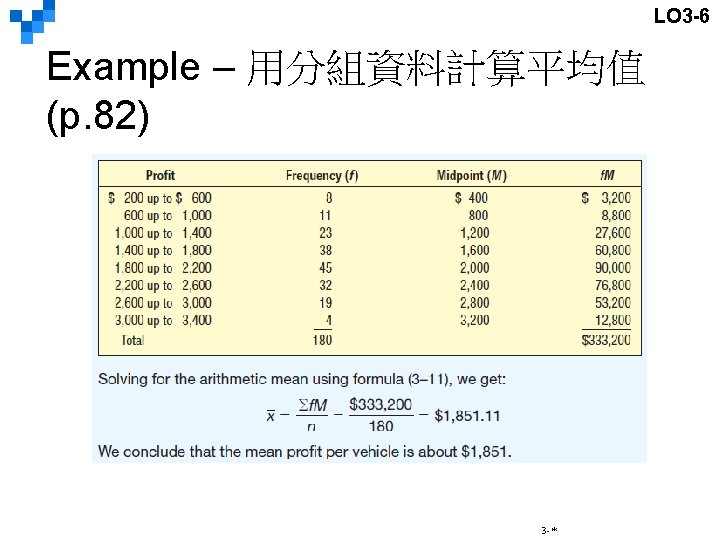

LO 3 -6 Example - Standard Deviation of Grouped Data Refer to the frequency distribution for the Applewood Auto Group data used earlier. Compute the standard deviation of the vehicle profits. 3 -*

- Slides: 61