DepthTime Graphs Worksheet A The worksheet is in


- Slides: 10
Depth-Time Graphs – Worksheet A The worksheet is in 2 sizes.
Printing To print handouts from slides Select the slide from the left. Then click: File > Print > ‘Print Current Slide’ To print multiple slides Click on a section title to highlight all those slides, or press ‘Ctrl’ at the same time as selecting slides to highlight more than one. Then click: File > Print > ‘Print Selection’ To print double-sided handouts Highlight both slides before using ‘Print Selection’. Choose ‘Print on Both Sides’ and ‘Flip on Short Edge’.
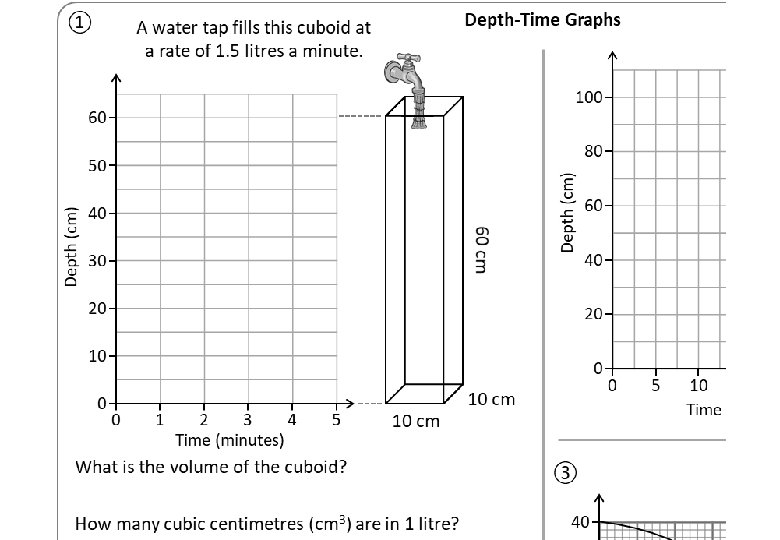
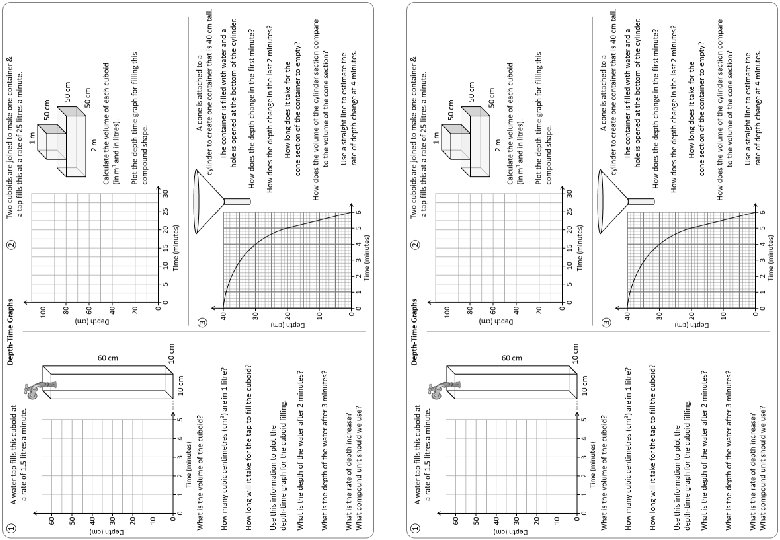
① Depth-Time Graphs A water tap fills this cuboid at a rate of 1. 5 litres a minute. 100 50 cm 40 60 cm 30 Depth (cm) 80 50 Depth (cm) Two cuboids are joined to make one container & a tap fills this at a rate of 25 litres a minute. 1 m 60 20 50 cm 60 2 m Plot the depth-time graph for filling this compound shape. 20 0 0 1 2 3 4 Time (minutes) 5 10 cm What is the volume of the cuboid? 10 cm What is the depth of the water after 3 minutes? What is the rate of depth increase? What compound unit should we use? 10 15 20 Time (minutes) 25 30 A cone is attached to a cylinder to create one container that is 40 cm tall. The container is filled with water and a hole is opened at the bottom of the cylinder. How does the depth change in the first minute? 30 Depth (cm) What is the depth of the water after 2 minutes? 5 40 How long will it take for the tap to fill the cuboid? Use this information to plot the depth-time graph for the cuboid filling. 0 ③ How many cubic centimetres (cm 3) are in 1 litre? 50 cm Calculate the volume of each cuboid (in m 3 and in litres). 40 10 0 ② How does the depth change in the last 2 minutes? How long does it take for the cone section of the container to empty? 20 10 How does the volume of the cylinder section compare to the volume of the cone section? 0 Use a straight line to estimate the rate of depth change at 4 minutes. 0 1 2 3 4 5 Time (minutes) 6
① Depth-Time Graphs A water tap fills this cuboid at a rate of 1. 5 litres a minute. 100 50 cm 40 60 cm 30 Depth (cm) 80 50 Depth (cm) Two cuboids are joined to make one container & a tap fills this at a rate of 25 litres a minute. 1 m 60 20 50 cm 60 2 m Plot the depth-time graph for filling this compound shape. 20 0 0 1 2 3 4 Time (minutes) 10 cm 5 What is the volume of the cuboid? 10 cm 10 × 60 = 6000 cm 3 How many cubic centimetres (cm 3) are in 1 litre? 5 10 15 20 Time (minutes) 25 What is the depth of the water after 2 minutes? 30 cm What is the depth of the water after 3 minutes? The container is filled with water and a hole is opened at the bottom of the cylinder. How does the depth change in the first minute? 30 Depth (cm) Use this information to plot the depth-time graph for the cuboid filling. How does the depth change in the last 2 minutes? How long does it take for the cone section of the container to empty? 20 10 How does the volume of the cylinder section compare to the volume of the cone section? 0 Use a straight line to estimate the rate of depth change at 4 minutes. 45 cm 15 cm/minute 30 A cone is attached to a cylinder to create one container that is 40 cm tall. 40 How long will it take for the tap to fill the cuboid? 6000 cm 3 ÷ 1500 cm 3 per minute = 4 minutes What is the rate of depth increase? What compound unit should we use? 0 ③ 1000 50 cm Calculate the volume of each cuboid (in m 3 and in litres). 40 10 0 ② 0 1 2 3 4 5 Time (minutes) 6
① Depth-Time Graphs A water tap fills this cuboid at a rate of 1. 5 litres a minute. 100 50 cm 40 60 cm 30 Depth (cm) 80 50 Depth (cm) Two cuboids are joined to make one container & a tap fills this at a rate of 25 litres a minute. 1 m 60 20 50 cm 60 2 m Plot the depth-time graph for filling this compound shape. 20 0 0 1 2 3 4 Time (minutes) 10 cm 5 What is the volume of the cuboid? 10 cm 10 × 60 = 6000 cm 3 How many cubic centimetres (cm 3) are in 1 litre? 5 10 15 20 Time (minutes) 25 What is the depth of the water after 2 minutes? 30 cm What is the depth of the water after 3 minutes? 250 litres ÷ 25 litres per minute = 10 minutes How does the depth change in the first minute? How does the depth change in the last 2 minutes? How long does it take for the cone section of the container to empty? 20 10 How does the volume of the cylinder section compare to the volume of the cone section? 0 Use a straight line to estimate the rate of depth change at 4 minutes. 45 cm 15 cm/minute 500 litres ÷ 25 litres per minute = 20 minutes The container is filled with water and a hole is opened at the bottom of the cylinder. 30 Depth (cm) Use this information to plot the depth-time graph for the cuboid filling. 30 A cone is attached to a cylinder to create one container that is 40 cm tall. 40 How long will it take for the tap to fill the cuboid? 6000 cm 3 ÷ 1500 cm 3 per minute = 4 minutes What is the rate of depth increase? What compound unit should we use? 0 ③ 1000 50 cm 1 × 0. 5 = 0. 25 m 3 = 250 litres Calculate the volume of each cuboid (in m 3 and in litres). 2 × 0. 5 = 0. 5 cm 3 = 500 litres 40 10 0 ② 0 1 2 3 4 5 Time (minutes) 6
① Depth-Time Graphs A water tap fills this cuboid at a rate of 1. 5 litres a minute. 100 50 cm 40 60 cm 30 Depth (cm) 80 50 Depth (cm) Two cuboids are joined to make one container & a tap fills this at a rate of 25 litres a minute. 1 m 60 20 50 cm 60 2 m Plot the depth-time graph for filling this compound shape. 20 0 0 1 2 3 4 Time (minutes) 10 cm 5 What is the volume of the cuboid? 10 cm 10 × 60 = 6000 cm 3 How many cubic centimetres (cm 3) are in 1 litre? 5 10 15 20 Time (minutes) 25 What is the depth of the water after 2 minutes? 30 cm What is the depth of the water after 3 minutes? 250 litres ÷ 25 litres per minute = 10 minutes How does the depth change in the first minute? − 1 cm 20 10 45 cm 15 cm/minute 500 litres ÷ 25 litres per minute = 20 minutes The container is filled with water and a hole is opened at the bottom of the cylinder. 30 Depth (cm) Use this information to plot the depth-time graph for the cuboid filling. 30 A cone is attached to a cylinder to create one container that is 40 cm tall. 40 How long will it take for the tap to fill the cuboid? 6000 cm 3 ÷ 1500 cm 3 per minute = 4 minutes What is the rate of depth increase? What compound unit should we use? 0 ③ 1000 50 cm 1 × 0. 5 = 0. 25 m 3 = 250 litres Calculate the volume of each cuboid (in m 3 and in litres). 2 × 0. 5 = 0. 5 cm 3 = 500 litres 40 10 0 ② 0 0 1 2 3 4 5 Time (minutes) 6 How does the depth change in the last 2 minutes? − 30 cm How long does it take for the cone section of the container to empty? 5 minutes How does the volume of the cylinder section compare to the volume of the cone section? One fifth Use a straight line to estimate the rate of depth change at 4 minutes. − 10 cm per minute
① Depth-Time Graphs A water tap fills this cuboid at a rate of 1. 5 litres a minute. 100 50 cm 40 60 cm 30 Depth (cm) 80 50 Depth (cm) Two cuboids are joined to make one container & a tap fills this at a rate of 25 litres a minute. 1 m 60 20 50 cm 60 2 m Plot the depth-time graph for filling this compound shape. 20 0 0 1 2 3 4 Time (minutes) 5 10 cm What is the volume of the cuboid? 10 cm What is the depth of the water after 3 minutes? What is the rate of depth increase? What compound unit should we use? 10 15 20 Time (minutes) 25 30 A cone is attached to a cylinder to create one container that is 40 cm tall. The container is filled with water and a hole is opened at the bottom of the cylinder. How does the depth change in the first minute? 30 Depth (cm) What is the depth of the water after 2 minutes? 5 40 How long will it take for the tap to fill the cuboid? Use this information to plot the depth-time graph for the cuboid filling. 0 ③ How many cubic centimetres (cm 3) are in 1 litre? 50 cm Calculate the volume of each cuboid (in m 3 and in litres). 40 10 0 ② How does the depth change in the last 2 minutes? How long does it take for the cone section of the container to empty? 20 10 How does the volume of the cylinder section compare to the volume of the cone section? 0 Use a straight line to estimate the rate of depth change at 4 minutes. 0 1 2 3 4 5 Time (minutes) 6
Questions? Comments? Suggestions? …or have you found a mistake!? Any feedback would be appreciated . Please feel free to email: tom@goteachmaths. co. uk