DependentSamples tTest Analyzing Twosample MatchedGroups and WithinSubjects Designs

Dependent-Samples t-Test Analyzing Two-sample Matched-Groups and Within-Subjects Designs

Comparison of Between-Subjects Designs: Independent and Matched Samples Independent Samples Design Matched Samples Design l Different groups of participants l Different groups of receive different levels of the participants receive different IV levels of the IV l Each participant serves in only l Each participant serves in one condition only one condition l Independent samples are l Dependent samples are used in each condition l Participants are selected l Participants are matched without regard to who is in to someone in the other condition on variable(s) correlated with the DV

Comparison of Between-Subjects and Within-Subjects Design Between-Subjects Design l Different groups of participants receive different levels of the IV Within-Subjects Design l One group of participants receives every level of the IV l Each participant serves in only one condition of the IV l Each participant serves in all conditions of the IV l Independent or matched samples are used in each condition l The sample is used in each condition

Appropriate Statistics? l l l Independent-Samples Design independent-samples t test Matched-Groups Design dependent-samples t test Within-Subjects Design dependent-samples t test

Dependent-Samples t Tests

Independent-Sample t-Test l l Randomly selected samples DV normally distributed DV measured using ratio or interval scale Homogeneity of variance Dependent-Samples t-Test l l l Randomly selected samples DV normally distributed DV measured using ratio or interval scale Homogeneity of variance Requires dependent samples (and equal n’s)

General Model for z-Test and Single-Sample t-Test H 0 Original Population Sample HA Treated Population

General Model for Independent-Samples t-Test Sample A H 0 Sample B H 0: 1 - 2 = 0 Population A (Control/ Original) Population B (Experimental/ Treated)
 Sample A HA Sample B")
General Model for Independent-Samples t-Test Population A (Control/ Original) Sample A HA Sample B H A: 1 - 2 0 Population B (Experimental/ Treated)

General Model for Dependent-Samples t-Test Independent-Samples t-Test: l compare the mean of Group 1 with the mean of Group 2 to determine if they are equal (H 0) or different (HA) Dependent-Samples t-Test: l 1. find the difference for each pair of scores (D = X 1 – X 2) l 2. calculate the mean of the difference l 3. determine if the mean difference differs from 0

General Model for Dependent-Samples t-Test H 0: μ D = 0 HA : μ D ≠ 0 Difference Scores of Population A (Control/ Original) Difference Scores of Population B (Experimental/ Treated)

Definitional Formulas Single-Sample t-Test Dependent-Samples t -Test

t-Tests Formulas Single-Sample t-Test Dependent-Samples t-Test

Definitional Formulas Single-Sample t-Test Independent-Samples t. Test

Single-Sample t-Test Step 1: Step 2: Step 3: Dependent-Samples t-Test

Dependent-Samples t-Test Step 1: Step 2: Step 3: Calculate the estimated variance of the population of difference scores Calculate the estimated standard error of the mean difference Calculate t-obtained

Hypothesis Testing 1. State the hypotheses. 2. Set the significance level =. 05. Determine tcrit. 3. Select and compute the appropriate statistic. 4. Make a decision. 5. Report the statistical results. 6. Write a conclusion.

Hypothesis Testing with Dependent Samples

An Example l l l Research Question: Which reinforcement schedule elicits more correct responses from pigeons? A total of 16 pigeons from 8 clutches (2 pigeons from each clutch) From each clutch, 1 pigeon is assigned to reinforcement schedule A and 1 is assigned to schedule B

Step 1. State the hypotheses. A. Is it a one-tailed or two-tailed test? l Two-tailed B. Research hypotheses l Alternative hypothesis: • Pigeons in Condition A will differ in the number of correct responses from pigeons in Condition B. l Null hypothesis: • Pigeons in Condition A will not differ in the number of correct responses from pigeons in Condition B. C. Statistical hypotheses: l H A: D ≠ 0 l H 0: D = 0

Step 2. Set the significance level =. 05. Determine tcrit. Factors That Must Be Known to Find tcrit 1. Is it a one-tailed or a two-tailed test? two-tailed 2. What is the alpha level? l. 05 3. What are the degrees of freedom? l df = ? l

Degrees of Freedom Single-Sample t-Test l l df = n – 1 n = # of scores Dependent-Samples t-Test l l df = n – 1 n = # of pairs

Degrees of Freedom Dependent-Samples t-Test Example: df = n – 1 =8– 1 =7

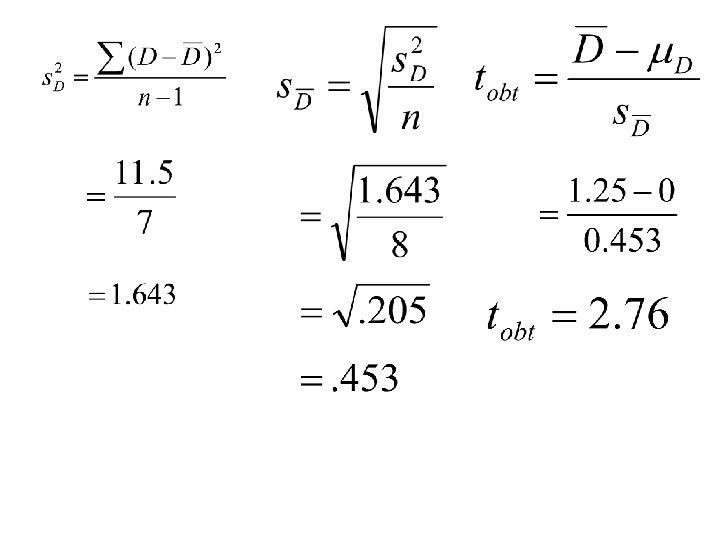
Step 3. Select and compute the appropriate statistic. Dependent-Samples t-Test Step 1: Step 2: Step 3: Calculate the estimated variance of the population. Calculate the estimated standard error of the mean difference Calculate t-obtained

Schedule A B 6 8 5 7 5 7 ΣX = = 4 6 2 6 3 6 6 7 ΣX = = D =

Schedule A B 6 4 8 6 5 2 7 6 5 3 7 6 5 6 7 7 ΣX = 50 ΣX = 40 = 6. 25 =5 D 2 2 3 1 2 1 -1 0 = 1. 25 . 75 1. 75 -. 25 -2. 25 -1. 25 . 5625 3. 0625. 5625. 0625 1. 5625

Step 4. Make a decision. l Determine whether the value of the test statistic is in the critical region. Draw a picture. tcrit = ? ? ?

Step 4. Make a decision. l Determine whether the value of the test statistic is in the critical region. Draw a picture. tcrit = -2. 365 tcrit = +2. 365 tobt = 2. 76 l Decision? +tobt > +tcrit Reject Ho
 = 2. 76, p <. 05 Does")
Step 5. Report the statistical results. t(7) = 2. 76, p <. 05 Does this indicate that you retain or reject the null hypothesis? What does it mean to say that p <. 05?

Step 6: Write a conclusion. l l State the relationship between the IV and the DV in words: Pigeons in Condition A (M = 6. 25) made significantly more correct responses than pigeons in Condition B (M = 5), t(7) = 2. 76, p <. 05.

Step 6: Write a conclusion. l l State the relationship between the IV and the DV in words: Schedule A resulted in an average of M = 1. 25 more correct responses than schedule B. There was a significant difference in performance between the two schedules, t(7) = 2. 76, p <. 05.

Step 7. Compute the estimated d.

Step 7. Compute the estimated d.

Effect Size d 0. 2 0. 5 0. 8 Effect Size Small effect Medium effect Large effect

Step 8. Compute r 2 and write a conclusion.

Step 8. Compute r 2 and write a conclusion.

Step 8. Compute r 2 and write a conclusion. The reinforcement schedule can account for 52. 11% of the variance in the difference in number of correct responses between the two conditions. Simpler: l The reinforcement schedule can account for 52. 11% of the variance in the difference scores. l
 r 2 Percentage of Variance Explained 0. 01")
Percentage of Variance Explained (r 2) r 2 Percentage of Variance Explained 0. 01 0. 09 0. 25 Small effect Medium effect Large effect
- Slides: 39