Denitrification in Delaware Bay Tidal Marshes and Creeks

Denitrification in Delaware Bay Tidal Marshes and Creeks February 2011 Mike Owens, Jeffrey Cornwell Chesapeake Biogeochemical Associates & UMCES Horn Point Laboratory Delaware Estuary Science and Environmental Summit

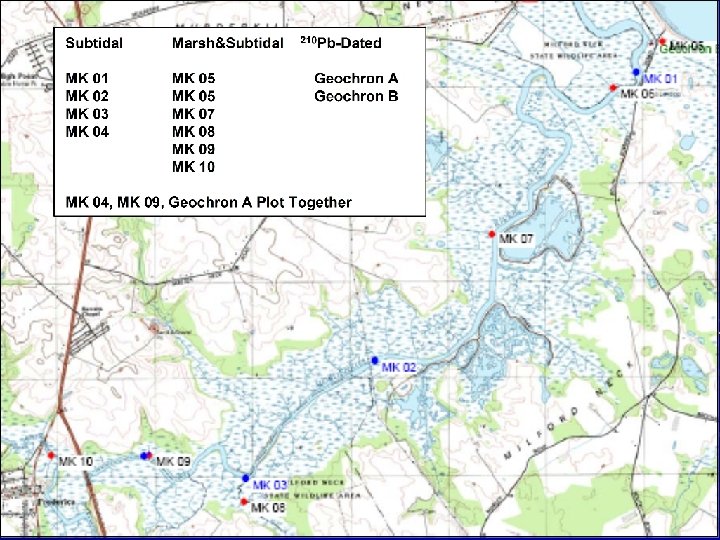
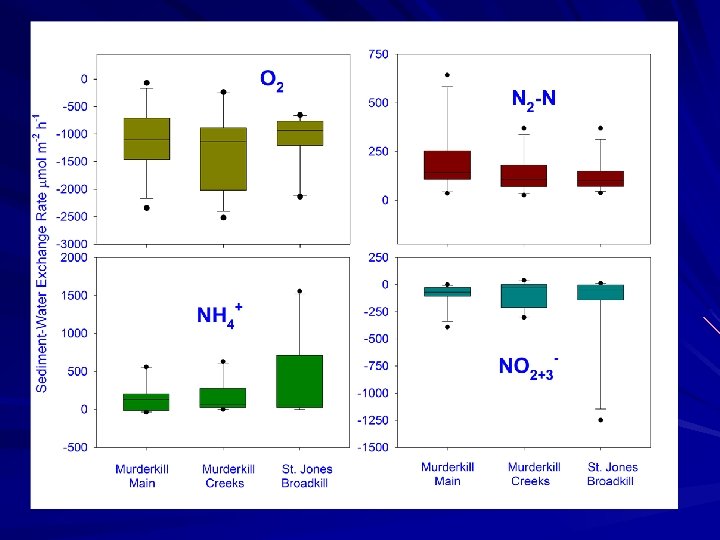
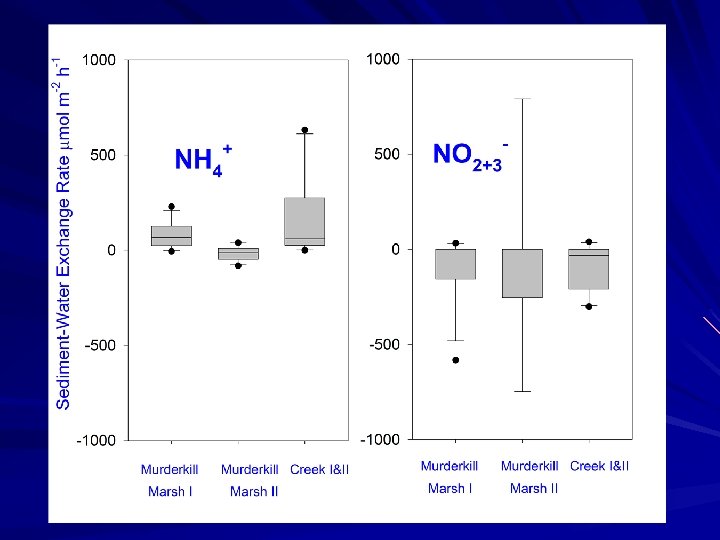
Sediment Fluxes July 19, 2007: Cores collected for subtidal fluxes at 4 stations (triplicate cores) July 23, 2007, April 27, 2008: Cores collected for marsh fluxes (2 marsh cores, 1 creek core). Standard fluxes carried out both time, plus two levels of NO 3 - addition in 2007 We utilized our “standard” core incubation procedures and measured fluxes of ammonium, nitrate, di-nitrogen, oxygen and soluble reactive phosphorus.

Study Goals Measure net nutrient fluxes at the sediment-water interface of Murderkill River, creek and marsh environments Utilize N 2: Ar approach to measure denitrification to examine denitrification in high and low nitrate seasons Compare denitrification rate estimates to other nitrogen sinks (i. e. burial) and to estimates of N input

Atmospheric DIN + PN Point/Non-Point N Inputs Surface Water Nitrogen 2 Wetland Plant Community DIN 3 DIN + PN Measured Parameters 1. 2. 3. 4. 5. NOx flux into soil NH 4+ efflux from soil Soil denitrification Nitrogen burial 1 Wetland Soil Groundwater DIN Exchange 5 “Permanent” Burial N 2 -N 4
 reducing conditions (no oxygen) and 2) a")
Putting Microbes to Work Denitrification requires 1) reducing conditions (no oxygen) and 2) a source of nitrate (NO 3 -) In many environments, nitrate come from the oxidation of ammonium (nitrification) This process represents a bona fide loss of nitrogen; burial, incorporation into fish and washout at the bay mouth are the other major sinks for nitrogen

Marshes

Nitrate Addition Experiment July 2007
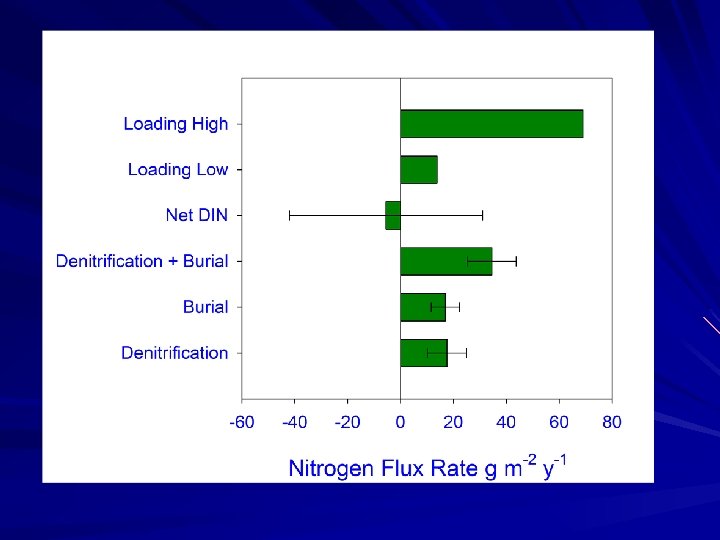

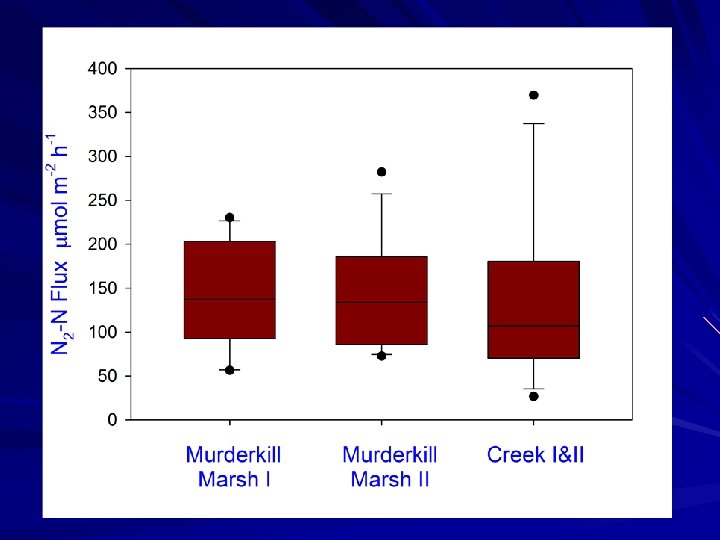
Conclusions Marsh nitrogen burial and denitrification rates are similar. Both could account for an important portion of watershed N inputs. Denitrification is similar in early spring to summer rates, despite different nitrate sources (summer nitrification, spring water column nitrate)
- Slides: 13