Demystifying Census Data Navigating the New American Fact


 B: Base")
 Decennial Census American Community Survey P: Population")
 B: Base")
 • 2000 SF 3")
 Central axis describes a nesting relationship")

- Slides: 12
Demystifying Census Data: Navigating the New American Fact. Finder Charlie Santo, Ph. D Associate Professor and Director, Graduate Program in City & Regional Planning
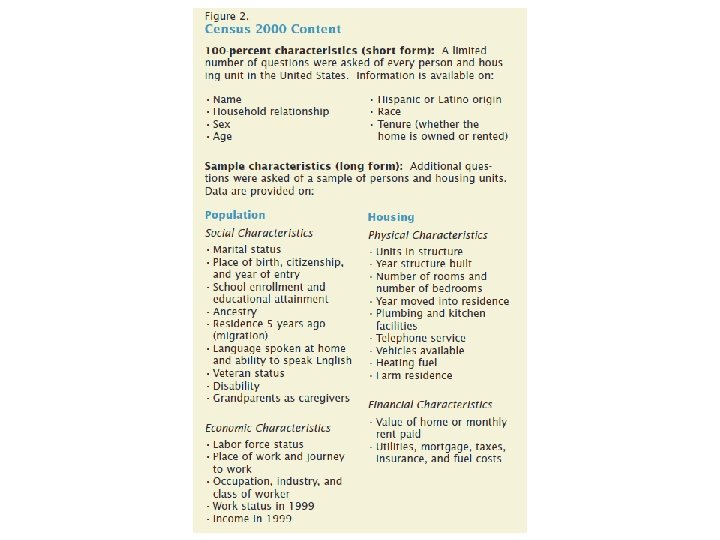
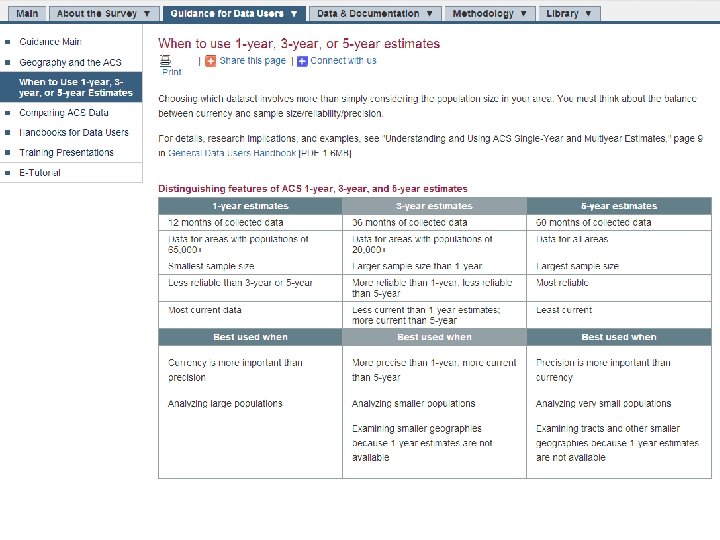
Where does the data come from? Old Model New Model Decennial Census Short Form (100%) Short form only (100%) Long Form (1 in 6 sample) NO LONG FORM Continuous American Community Survey
2000 short form 2000 long form
2010 Census form ACS Form
Table Naming Conventions Decennial Census American Community Survey P: Population Variables (People) B: Base (detailed) Table H: Housing Variable C: Collapsed (version of a base table) DP: Demographic Profile (includes more than one variable) GCT: Geographic Comparison Table R: Ranking Table QT: Quick table (includes some calculations) S: Select Population Profile
Table Naming Conventions BASIC tables (raw data) Decennial Census American Community Survey P: Population Variables (People) B: Base (detailed) Table H: Housing Variable C: Collapsed (version of a base table) DP: Demographic Profile (includes more than one variable) GCT: Geographic Comparison Table R: Ranking Table QT: Quick table (includes some calculations) S: Select Population Profile
Table Naming Conventions Decennial Census American Community Survey P: Population Variables (People) B: Base (detailed) Table H: Housing Variable C: Collapsed (version of a base table) DP: Demographic Profile (includes more than one variable) GCT: Geographic Comparison Table R: Ranking Table QT: Quick table (includes some calculations) “Manipulated” Data S: Select Population Profile NP: Narrative Profile
• 2000 SF 1 Technical Documentation (with table/variable names) • 2000 SF 3 Technical Documentation • 2010 SF 1 Technical Documentation • 2006 -2010 ACS 5 -year Summary Technical Documentation • ACS Table Codes
Census Geography Hierarchy (with 2010 Statistical Area Criteria) Central axis describes a nesting relationship • Cities and towns -- incorporated • Census Designated Places (CDPs) • 1, 200 to 8, 000 population (optimum 4, 000) • 480 to 3, 200 housing units Blocks are not defined by population and are the smallest geographic level at which data are ever released (Decennial Census, not the ACS) • 600 to 3, 000 population • 240 to 1, 200 housing units
http: //factfinder 2. census. gov/