Demography and demographic trends in India Dr Pavithra


- Slides: 31
Demography and demographic trends in India -Dr Pavithra H Department of Community Medicine
Specific Learning Objectives • At the end of the session, the student must be able to: 1. Enumerate and explain the various stages of demographic cycle 2. Explain the importance of birth, death and growth rates and age pyramids 3. Define sex ratio and dependency ratio 4. Define fertility and fertility related statistics
Demography • Scientific study of human population • Focuses attention on: 1. Changes in population size 2. Composition of population 3. Distribution of population in space • Demographic processes: marriage, migration, social mobility, fertility and mortality
Demography • Sources? • • Population censuses National sample surveys Registration of vital events Adhoc demographic studies
Demographic cycle Decreasing death rate, same birth rate High birth and death rate Birth rate lower than death rate Death rate declines further, birth rate tends to fall Low birth and low death rate
World population trends • 7 th billion - 2014 • 3/4 th of world’s population lives in developing countries • Annual growth rate of India is 1. 4%; population is estimated to reach 1. 53 billion by the year 2050
Birth and death rates • World’s birth rate – 19; death rate – 7 per thousand population • Factors in fertility decline – government attitudes, availability of contraception, change in marriage patterns • Improvement in maternal and child health services, immunization, diarrhoeal diseases and ARI programmes
Growth rates • Annual growth rate = crude birth rate – crude death rate • 95% of growth – developing countries • 1/3 rd of the population is < 15 yrs of age • Global total fertility rate: 2. 4
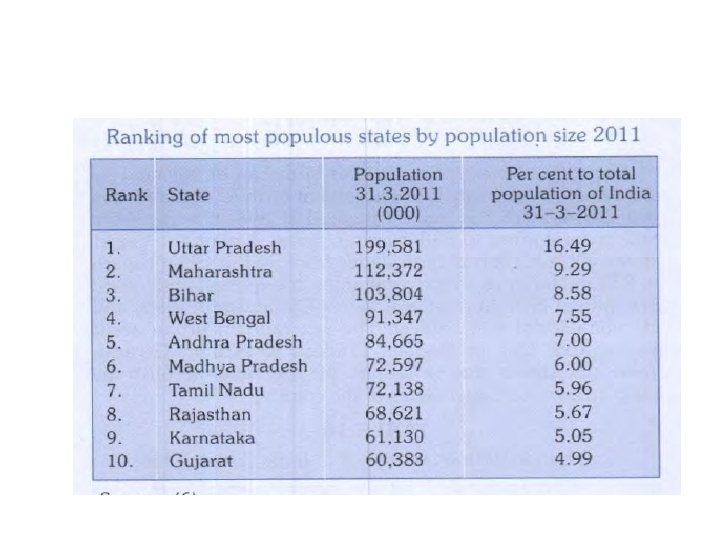
Demographic trends in India • Demographic indicators? Population statistics Vital statistics • 1921 – Big divide – currently increasing at a rate of 16 million each year
Demographic trends in India • Categorisation: 1. Very high focus: TFR ≥ 3. 0; Bihar, UP and Meghalaya 2. High focus: TFR = 2. 2 -3. 0; Assam, Mizoram, Dadra and Nagar Haveli, Chhattisghar, Jharkand, Manipur, Rajasthan, MP, Nagaland 3. Non high focus
Age and sex composition
Age Pyramid
Age pyramids What are your observations?
Any link between age pyramid and COVID-19 deaths?
Sex ratio • Number of females/ 1000 males: 940 • 898 at birth • Female deficit syndrome – adverse social implications • Indicates? • Male child preference, gender inequalities, neglect – high mortality, infanticide, foeticide, maternal mortality
Dependency ratio • Who are dependents? • Children 0 -14 years of age + population more than 65 years of age X 100 Population of 15 to 64 years
Dependency ratio • Significance of dependency ratio? • Demographic bonus: Period when the dependency ratio in population declines because of decline in fertility, until it starts to rise again because of increasing longevity • Demographic burden: Increase in the dependency ratio at any point of time
Population Density • Ratio between total population and surface area • In India it is number of persons living per square kilometre • 1901: 77/sq km • 2001: 325/sq km • 2011: 382/sq km
Urbanization • What is an Urban area? • Towns; also places having > 5, 000 inhabitants, a density of not less than 1, 000 persons per square mile or 390 per square, pronounced urban characteristics and at least 3/4 th of the adult male population employed in pursuits other than agriculture
Urbanization • 2017 – 33. 5% of the population was urban and annual urbanization increase was 2. 8% • Increase – natural growth and migration from villages
Literacy and education • Who is called literate? • Crude literate: Number of literate persons X 100 Total population in a given year • 2011 – 74. 04% • Effective literacy rate: Number of literate persons aged 7 and above X 100 Population aged 7 and above in a given year
Life Expectancy • The average number of years which a person of that age may expect to live, according to the mortality pattern prevalent in that country • Its is considered as one of the best indicators of the country’s level of development and of the overall health status of its population
Family size • Means total number of children • Completed family size – total number of children borne by a woman during her child bearing age • Factors: duration of marriage, education of the couple, number of live births and living children, preference of male children
Fertility • Fertility – actual bearing of children • • • Factors associated: Age at marriage Duration of married life Spacing of children Education Economic status Caste and religion Nutrition Family planning
Fertility-related Statistics • • • • Birth rate General fertility rate General marital fertility rate Age-specific marital fertility rate Total marital fertility rate Gross reproduction rate Net reproduction rate Child-woman ratio Pregnancy rate Abortion rate and ratio Marriage rate
Assessment 1. _____ is the first stage of a demographic cycle 2. a. b. c. d. Annual growth rate is: Crude birth rate - crude death rate Crude death rate – crude birth rate Age specific birth rate – age specific death rate None of the above
Assessment 3. _____ is the sex ratio in India 4. Period when the dependency ratio in population declines because of decline in fertility, until it starts to rise again because of increasing longevity is ___ a. Population burden b. Demographic burden c. Demographic bonus d. Population bonus
Assessment 5. At least ____ of the adult male population employed in pursuits other than agriculture to call the area as urban: a. 1/4 th b. 1/3 rd c. ½ d. 3/4 th
Summary 1. Enumerate and describe the components of demographic process. 2. Describe demographic cycle. 3. What are the birth and death rates of world and India? What is the relevance of the same? 4. Define sex ratio 5. Define dependency ratio, demographic burden and demographic bonus. 6. Define an urban area. 7. Define family size. What are the factors associated with fertility?