DEMOGRAPHICS HUMAN POPULATION GROWTH WORLD POPULATION HAS RISEN


 has a much slower growing population than")


 = average number")


 reduced TFRs")


- Slides: 37
DEMOGRAPHICS HUMAN POPULATION GROWTH
WORLD POPULATION HAS RISEN SHARPLY • Global human population was <1 billion in 1800. • Population has doubled just since 1963. • We add 2. 5 people every second (79 million/year).
BIRTH AND DEATH RATES, WORLDWIDE Rates of birth, death, and natural increase per 1, 000 population Natural Increase Source: United Nations, World Population Prospects: The 2004 Revision, 2005.
DEATH RATES HAVE GONE DOWN • World population growth in past 100 years is due to a decline in death rates • Better medicine • Reliable food • Good nutrition • Better sanitation • Safer water
INCREASING OUR CARRYING CAPACITY • Technology has allowed us to raise Earth’s carrying capacity for our species time and again. • Tool-making, agriculture, and industrialization each enabled humans to sustain greater populations.
AGE STRUCTURE CAN INFLUENCE POPULATION GROWTH RATES.
AGE STRUCTURE: AGE PYRAMIDS • Canada (left) has a much slower growing population than does Madagascar (right).
AGE STRUCTURE: “GRAYING POPULATIONS” • Demographers project that China’s population will become older over the next two decades.
AGE STRUCTURE: “BABY BOOMS” • The United States’ “baby boom” is evident in age bracket 40– 50. U. S. age structure will change as baby boomers grow older.
DEMOGRAPHY Demography is the study of human populations. • Human populations exhibit the same fundamental characteristics as do populations of all other organisms.
DEMOGRAPHIC TRANSITION THEORY • Demographic transition = model of economic and cultural change to explain declining death rates, declining birth rates, and rising life expectancies in Western nations as they became industrialized • Proposed by F. Notestein in the 1940 s-1950 s
DEMOGRAPHIC TRANSITION: STAGES
DEMOGRAPHIC TRANSITION: STAGES • Pre-industrial stage: high death rates and high birth rates • Transitional stage: death rates fall due to rising food production and better medical care. Birth rates remain high, so population surges. • Industrial stage: birth rates fall, as women are employed and as children become less economically useful in an urban setting. Population growth rate declines. • Post-industrial stage: birth and death rates remain low and stable; society enjoys fruits of industrialization without threat of runaway population growth.
POPULATION SIZE: FUTURE PROJECTIONS • Demographers project population growth trends to estimate future population sizes. • Different fertility rate scenarios predict global population sizes in 2050 of 7. 4 billion, 8. 9 billion, or 10. 6 billion. • All these projections assume fertility rates below today’s; at today’s rate, the population would reach 12. 8 billion.
POPULATION DENSITY AND DISTRIBUTION • Humans are unevenly distributed, living at different densities from region to region.
95% OF ALL POPULATION GROWTH IS TAKING PLACE IN DEVELOPING COUNTRIES Billions Less Developed Regions More Developed Regions Source: United Nations, World Population Prospects: The 2004 Revision (medium scenario), 2005.
FACTORS AFFECTING POPULATION GROWTH RATES • Population growth depends on rates of • Birth • Death • Immigration • Emigration POPULATION GROWTH RATE = (birth rate + immigration rate) – (death rate + emigration rate) DOUBLING TIME = 70/Population Growth Rate NATURAL RATE OF POPULATION CHANGE = • Change due to birth and death rates alone • excluding migration • Is often expressed in % per year
MIGRATION CAN HAVE ENVIRONMENTAL EFFECTS • Immigration and emigration play large roles today. • Refugees from the 1994 Rwandan genocide endured great hardship, and deforested large areas near refugee camps.
GLOBAL GROWTH RATES HAVE FALLEN • The annual growth rate of the world population has declined since the 1960 s. • (But the population size is still rising!)
FERTILITY RATES AFFECT POPULATION GROWTH RATES • Total fertility rate (TFR) = average number of children born per woman during her lifetime • Replacement fertility = the TFR that keeps population size stable • For humans, replacement fertility is about 2. 1
TOTAL FERTILITY RATES BY REGION African nations have the highest TFRs. European nations have the lowest TFRs.
SINGLE MOST IMPORTANT FACTOR THE SOCIAL AND ECONOMIC STATUS OF WOMEN
EDUCATIONAL OPPORTUNITY & FERTILITY • Women with more education marry later and have fewer children
FEMALE EDUCATION AND TFR • Female literacy and school enrollment are correlated with total fertility rate: • More-educated women have fewer children.
FAMILY PLANNING SERVICES • Reduced Fertility Rate does not happen without access to services – Does not force limited family sizes – Promotes small family as acceptable & desirable – provides info and access to contraceptives
FAMILY PLANNING AND TFR • Nations that invested in family planning (green) reduced TFRs more than similar nations that did not (red). Figure 7. 17 a
KEY FACTORS THAT REDUCE POPULATION GROWTH: INVESTMENTS IN EDUCATION AND HEALTH • Status of women • General education • Employment opportunities, economic security • Health and nutritional status (including pre- and post-natal care) • Urbanization • Family planning methods • Access to family planning options • Affordability of family planning • Comfort with family planning methods • Age at first birth • Spacing between children • Decrease consumption
AFFLUENCE AND THE ENVIRONMENT • Poverty can lead to environmental degradation… BUT • Wealth and resource consumption can produce even more severe and farreaching environmental impacts. • ONE American causes greater impact & more resource depletion than 12 people from developing countries
BORN CONSUMERS • Highly Developed Nations = 20% of world’s population but use: – – – 86% of aluminum 76% of timber harvested 68% of energy produced 61% of meat eaten 42% of fresh water consumed • Make make 75% of world’s pollution
THE WEALTH GAP • Residents of developed nations have larger houses, more possessions, and more money than residents of developing nations. • The richest 20% of the world’s people consumes 86% of its resources, and has >80 times the income of the poorest 20%.
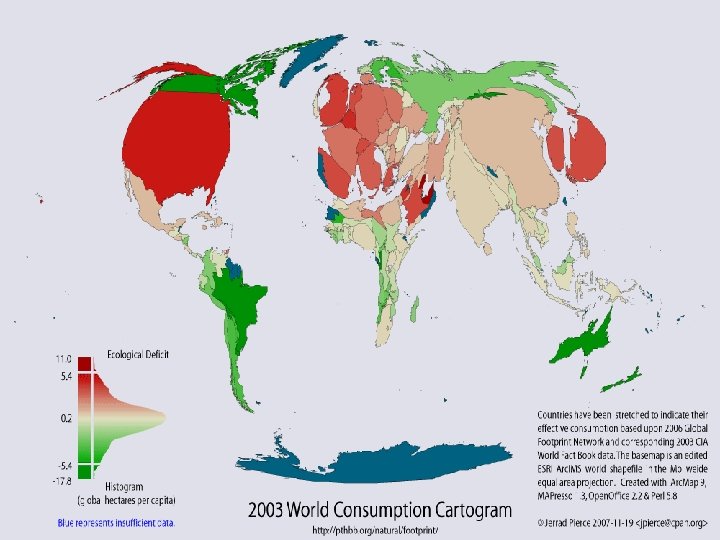
ECOLOGICAL FOOTPRINT • Ecological Footprint • cumulative amount of Earth’s surface area required to provide the raw materials a person or a population consumes and to dispose of or recycle the waste that is produced • shows the area of the earth that is needed to supply all the resources to support a standard of living • can be shown for individuals or for entire countries
ECOLOGICAL FOOTPRINTS • Residents of some countries consume more resources—and thus use more land—than residents of others. • Shown are ecological footprints of an average citizen from various nations.
ECOLOGICAL FOOTPRINT 1/5/2022 33
CONCLUSIONS: CHALLENGES • Human population is rising by 79 million people annually. • Many more people are born into poverty than into wealth. • Rich and poor nations are divided by a “wealth gap. ” • HIV/AIDS is taking a heavy toll. • Population growth has severe environmental effects.
CONCLUSIONS: SOLUTIONS • Expanding women’s rights is crucial to encourage the demographic transition. • Health and reproductive education and counseling can reduce fertility rates. • Education, medicine, and policies can lessen the toll of HIV/AIDS. • New “green” technologies can help reduce population growth’s environmental impacts.