
Demographics Children and Young People September 2020 Contents
Demographics Children and Young People September 2020
Contents Introduction Bexley Population II Life Expectancy in Bexley Vulnerable Groups in Bexley Wider Determinants of Health in Bexley 0 -5 Year Olds in Bexley School-Age Children in Bexley Families in Bexley Summary & Key Findings 2
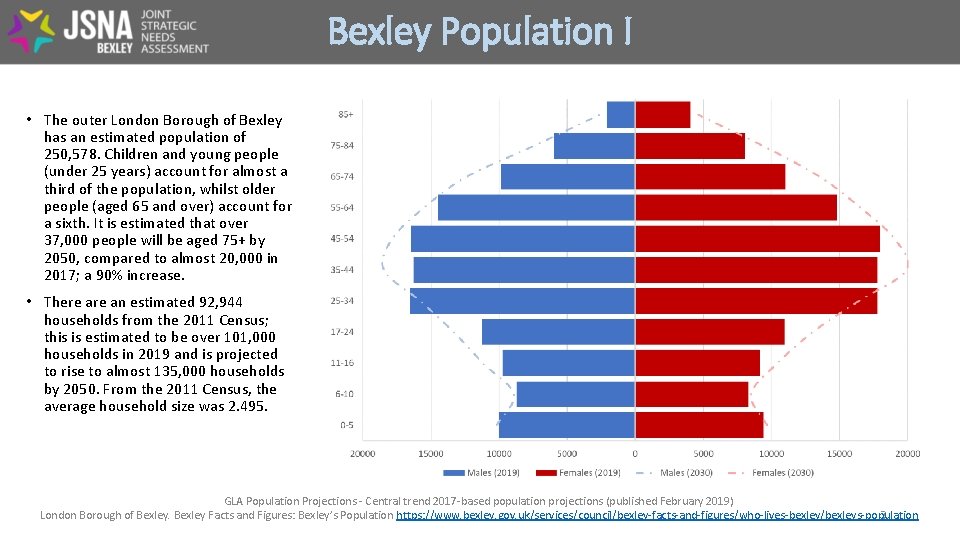
Bexley Population I • The outer London Borough of Bexley has an estimated population of 250, 578. Children and young people (under 25 years) account for almost a third of the population, whilst older people (aged 65 and over) account for a sixth. It is estimated that over 37, 000 people will be aged 75+ by 2050, compared to almost 20, 000 in 2017; a 90% increase. • There an estimated 92, 944 households from the 2011 Census; this is estimated to be over 101, 000 households in 2019 and is projected to rise to almost 135, 000 households by 2050. From the 2011 Census, the average household size was 2. 495. GLA Population Projections - Central trend 2017 -based population projections (published February 2019) 3 London Borough of Bexley Facts and Figures: Bexley’s Population https: //www. bexley. gov. uk/services/council/bexley-facts-and-figures/who-lives-bexley/bexleys-population
Bexley Population II Ethnicity and migration • • The majority of Bexley residents (77%) are White, while 23% are from Black and Minority Ethnic (BME) groups. Bexley is becoming more diverse. BME groups will account for an estimated 30% of the population by 2045, compared to 18% at the 2011 Census. Populations of some ethnic groups (Black, Asian and Mixed) are projected to more than double from the Census to 2050. The 2011 Census shows the top three countries of birth for those born outside of the United Kingdom as Nigeria, India and Ireland. Natural change (births – deaths) accounts for the largest rise in population (over 1, 000 people each year). International migration accounts for over 500 people each year. Internal (domestic) migration has risen over time; recent years have seen more moves out than in. Those aged 25 -44 and children aged 0 -17 years show net migration into Bexley while 18 -24 -year olds and those aged 45+ show net migration out of Bexley. Language • In the 2011 Census, 94% of Bexley residents reported English as their main language, compared to the national average of 91%. Religion • The 2011 Census recorded the predominant religion among residents of Bexley who reported that they have a religion, as Christian (62. 1%). Muslim was the next most commonly reported religion at 2. 5%. Almost a quarter (24. 1%) reported that they had no religion. Marital status • • From the 2011 Census, the largest proportion (47. 8%) of Bexley residents by marital status were married. Of the remaining 52%: 33. 8% single (never married); 8. 1% divorced; 7. 2% widowed; 2. 9% separated; 0. 1% same-sex civil partnership Employment • The London Borough of Bexley is considered a commuter area that feeds the City of London. The employment rate of those living within Bexley has traditionally been higher than that of London, and often higher than Great Britain as a whole. • In 2016/17, 75% of Bexley residents were employed. The employment rate of Ethnic Minority groups is equivalent to that of the White population. Over 40% of working residents are employed in jobs requiring high skills. Office for National Statistics (ONS), Census 2011. Marital and civil partnership status. London Borough of Bexley Facts and Figures: Economic development 4 Office for National Statistics, Annual Population Survey and Labour Force Survey
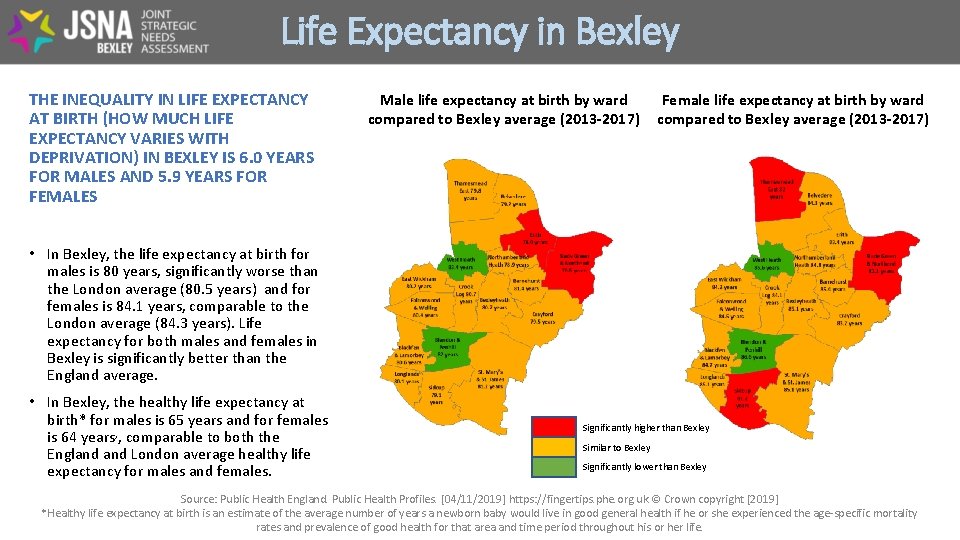
Life Expectancy in Bexley THE INEQUALITY IN LIFE EXPECTANCY AT BIRTH (HOW MUCH LIFE EXPECTANCY VARIES WITH DEPRIVATION) IN BEXLEY IS 6. 0 YEARS FOR MALES AND 5. 9 YEARS FOR FEMALES Male life expectancy at birth by ward compared to Bexley average (2013 -2017) Female life expectancy at birth by ward compared to Bexley average (2013 -2017) • In Bexley, the life expectancy at birth for males is 80 years, significantly worse than the London average (80. 5 years) and for females is 84. 1 years, comparable to the London average (84. 3 years). Life expectancy for both males and females in Bexley is significantly better than the England average. • In Bexley, the healthy life expectancy at birth* for males is 65 years and for females is 64 years, , comparable to both the England London average healthy life expectancy for males and females. Significantly higher than Bexley Similar to Bexley Significantly lower than Bexley Source: Public Health England. Public Health Profiles. [04/11/2019] https: //fingertips. phe. org. uk © Crown copyright [2019] *Healthy life expectancy at birth is an estimate of the average number of years a newborn baby would live in good general health if he or she experienced the age-specific mortality 5 rates and prevalence of good health for that area and time period throughout his or her life.
Vulnerable Groups in Bexley BEXLEY HAS A RELATIVELY LARGE POPULATION OF GYPSY AND TRAVELLER COMMUNITIES • Following the 2011 census, it was identified that the largest number of Gypsies and Travellers were in the South East of England that Bexley had the highest concentration of Gypsies and Travellers in London, followed by Bromley and Hackney. The 2011 census estimated that there were 624 Gypsies and Travellers in Bexley, of which approximately 67% were in the north of the borough. North End and Erith Wards had the highest estimated number of Gypsies and Travellers, with 99 and 89 individuals respectively. • In 2015/16, there were 152 school children in state Primary and Secondary schools in Bexley who were of Gypsy/Roma ethnicity, 0. 41% of school children in Bexley (Of children whose ethnic group is classified). This was significantly higher than the England average, the London average and the average of Bexley’s statistical neighbours. Bexley had the highest proportion of Gypsy/Roma school children in London. • Almost all the Gypsy and Traveller community in Bexley will be in settled accommodation; a total of 204 households are assumed in the borough with 198 in ‘bricks and mortar’ accommodation. Source: Government Housing Committee; https: //www. london. gov. uk/moderngov/documents/s 37668/Appendix%201%20 -%20 Gypsy%20 and%20 Traveller%20 report. pdf; based on Office for National Statistics, 2011 census; Office for National Statistics, 2011 Census, detailed ethnic groups for London Wards; Public Health England. Public Health Profiles. [Accessed 28/11/19] https: //fingertips. phe. org. uk © Crown copyright [2019]; London Borough of Bexley Gypsy, Traveller and Travelling Showperson Accommodation Assessment, 2019; House of Commons Briefing 6 Paper, Gypsies and Travellers, 9 May 2019 ; House of Commons Briefing Paper Gypsies and Travellers, based on Office for National Statistics, 2011 census
Vulnerable Groups in Bexley BEXLEY HAS A RELATIVELY LARGE POPULATION OF GYPSY AND TRAVELLER COMMUNITIES • Nationally there has been an historic lack of robust data on Gypsy and Traveller communities. The 2011 census included, for the first time, an ethnic category to collect data on Gypsy, Traveller and Irish Traveller communities and approximately 63, 000 people in the UK identified themselves as members of these groups. Studies have shown that the health of Gypsy and Traveller groups is poor in comparison with the general population, including shorter life expectancy, higher rates of mortality, morbidity and long-term conditions, low child immunisation levels and higher prevalence of anxiety and depression. Reasons for poorer health outcomes are thought to relate to barriers accessing healthcare a lack of cultural awareness and understanding by health professionals of Gypsy and Traveller health and social needs, as well as poor accommodation, discrimination and poor health literacy. • Children from Gypsy and Traveller communities attain and progress significantly below the national average throughout compulsory education and Gypsy and Irish Travellers have the lowest employment rates and highest levels of economic inactivity. Source: Government Housing Committee; https: //www. london. gov. uk/moderngov/documents/s 37668/Appendix%201%20 -%20 Gypsy%20 and%20 Traveller%20 report. pdf; based on Office for National Statistics, 2011 census; Office for National Statistics, 2011 Census, detailed ethnic groups for London Wards; Public Health England. Public Health Profiles. [Accessed 28/11/19] https: //fingertips. phe. org. uk © Crown copyright [2019]; London Borough of Bexley Gypsy, Traveller and Travelling Showperson Accommodation Assessment, 2019; House of Commons Briefing 7 Paper, Gypsies and Travellers, 9 May 2019 ; House of Commons Briefing Paper Gypsies and Travellers, based on Office for National Statistics, 2011 census
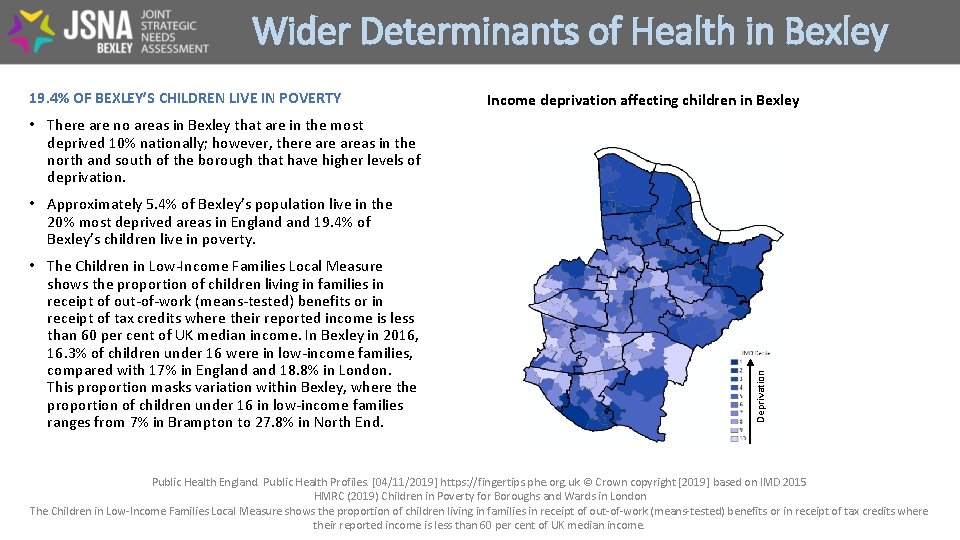
Wider Determinants of Health in Bexley 19. 4% OF BEXLEY’S CHILDREN LIVE IN POVERTY Income deprivation affecting children in Bexley • There are no areas in Bexley that are in the most deprived 10% nationally; however, there areas in the north and south of the borough that have higher levels of deprivation. • The Children in Low-Income Families Local Measure shows the proportion of children living in families in receipt of out-of-work (means-tested) benefits or in receipt of tax credits where their reported income is less than 60 per cent of UK median income. In Bexley in 2016, 16. 3% of children under 16 were in low-income families, compared with 17% in England 18. 8% in London. This proportion masks variation within Bexley, where the proportion of children under 16 in low-income families ranges from 7% in Brampton to 27. 8% in North End. Deprivation • Approximately 5. 4% of Bexley’s population live in the 20% most deprived areas in England 19. 4% of Bexley’s children live in poverty. Public Health England. Public Health Profiles. [04/11/2019] https: //fingertips. phe. org. uk © Crown copyright [2019] based on IMD 2015 HMRC (2019) Children in Poverty for Boroughs and Wards in London The Children in Low-Income Families Local Measure shows the proportion of children living in families in receipt of out-of-work (means-tested) benefits or in receipt of tax credits where 8 their reported income is less than 60 per cent of UK median income.
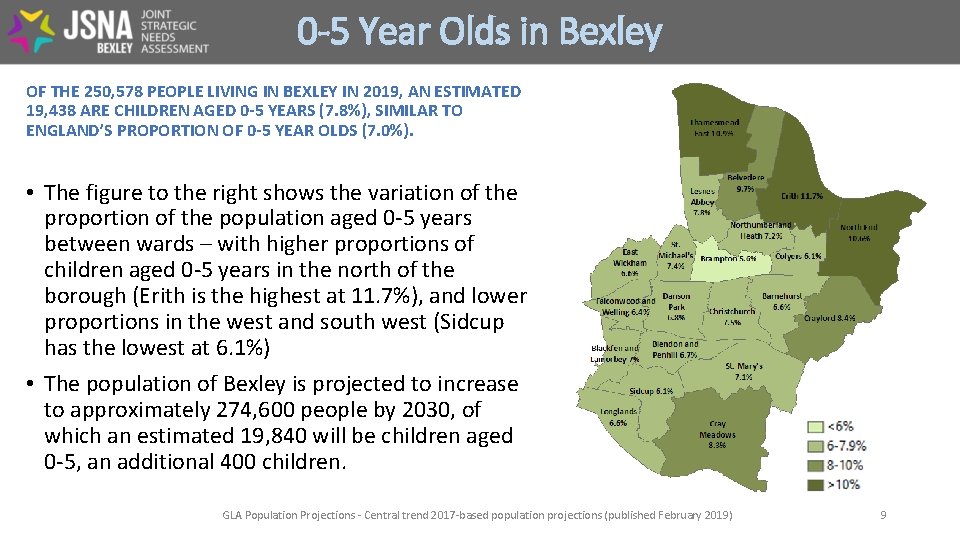
0 -5 Year Olds in Bexley OF THE 250, 578 PEOPLE LIVING IN BEXLEY IN 2019, AN ESTIMATED 19, 438 ARE CHILDREN AGED 0 -5 YEARS (7. 8%), SIMILAR TO ENGLAND’S PROPORTION OF 0 -5 YEAR OLDS (7. 0%). • The figure to the right shows the variation of the proportion of the population aged 0 -5 years between wards – with higher proportions of children aged 0 -5 years in the north of the borough (Erith is the highest at 11. 7%), and lower proportions in the west and south west (Sidcup has the lowest at 6. 1%) • The population of Bexley is projected to increase to approximately 274, 600 people by 2030, of which an estimated 19, 840 will be children aged 0 -5, an additional 400 children. GLA Population Projections - Central trend 2017 -based population projections (published February 2019) 9
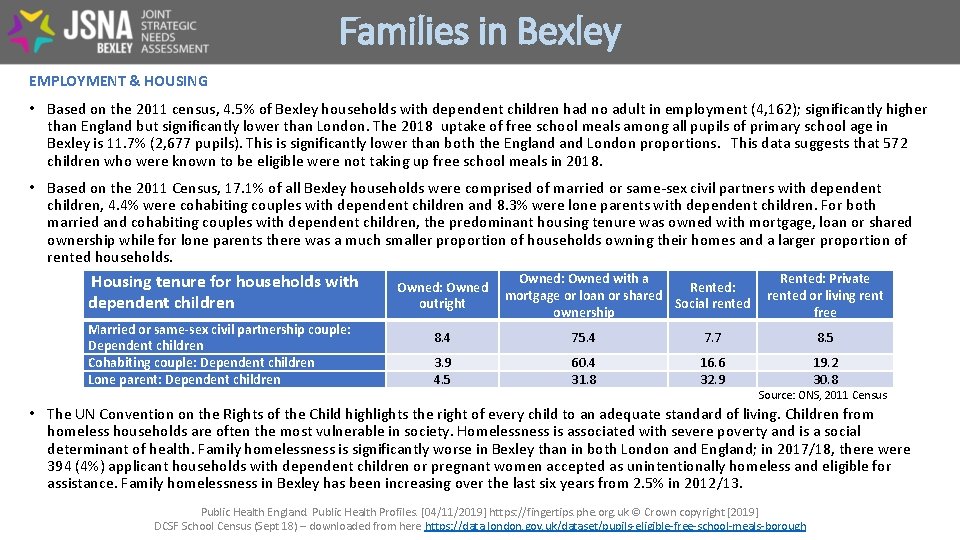
Families in Bexley EMPLOYMENT & HOUSING • Based on the 2011 census, 4. 5% of Bexley households with dependent children had no adult in employment (4, 162); significantly higher than England but significantly lower than London. The 2018 uptake of free school meals among all pupils of primary school age in Bexley is 11. 7% (2, 677 pupils). This is significantly lower than both the England London proportions. This data suggests that 572 children who were known to be eligible were not taking up free school meals in 2018. • Based on the 2011 Census, 17. 1% of all Bexley households were comprised of married or same-sex civil partners with dependent children, 4. 4% were cohabiting couples with dependent children and 8. 3% were lone parents with dependent children. For both married and cohabiting couples with dependent children, the predominant housing tenure was owned with mortgage, loan or shared ownership while for lone parents there was a much smaller proportion of households owning their homes and a larger proportion of rented households. Housing tenure for households with dependent children Married or same-sex civil partnership couple: Dependent children Cohabiting couple: Dependent children Lone parent: Dependent children Owned: Owned with a Owned: Owned Rented: mortgage or loan or shared outright Social rented ownership Rented: Private rented or living rent free 8. 4 75. 4 7. 7 8. 5 3. 9 4. 5 60. 4 31. 8 16. 6 32. 9 19. 2 30. 8 Source: ONS, 2011 Census • The UN Convention on the Rights of the Child highlights the right of every child to an adequate standard of living. Children from homeless households are often the most vulnerable in society. Homelessness is associated with severe poverty and is a social determinant of health. Family homelessness is significantly worse in Bexley than in both London and England; in 2017/18, there were 394 (4%) applicant households with dependent children or pregnant women accepted as unintentionally homeless and eligible for assistance. Family homelessness in Bexley has been increasing over the last six years from 2. 5% in 2012/13. Public Health England. Public Health Profiles. [04/11/2019] https: //fingertips. phe. org. uk © Crown copyright [2019] DCSF School Census (Sept 18) – downloaded from here https: //data. london. gov. uk/dataset/pupils-eligible-free-school-meals-borough 10
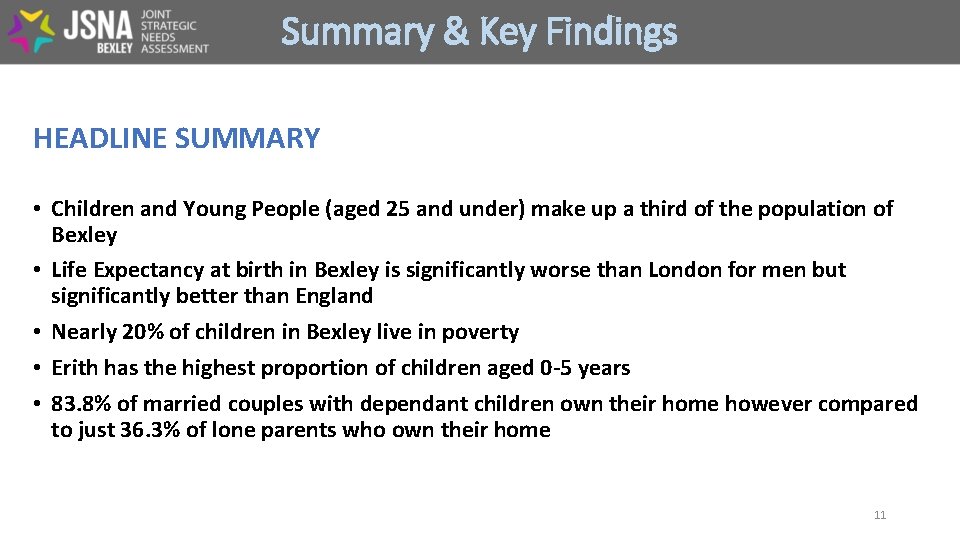
Summary & Key Findings HEADLINE SUMMARY • Children and Young People (aged 25 and under) make up a third of the population of Bexley • Life Expectancy at birth in Bexley is significantly worse than London for men but significantly better than England • Nearly 20% of children in Bexley live in poverty • Erith has the highest proportion of children aged 0 -5 years • 83. 8% of married couples with dependant children own their home however compared to just 36. 3% of lone parents who own their home 11
- Slides: 11