Demographics Boston Population Distribution by RaceEthnicity Boston 2010

Demographics Boston

Population Distribution by Race/Ethnicity Boston, 2010 60% N=54, 357 Asian Residents Percent of Population 46. 8 45% 30% 22. 5 17. 6 15% 8. 9 4. 3 0% Asian Black Latino White Other* * Includes American Indians/Alaskan Natives, Native Hawaiians/Other Pacific Islanders, Two or More Races, and Some Other Races. DATA SOURCE: Decennial Census 2010, U. S. Census Bureau DATA ANALYSIS: Boston Public Health Commission Research and Evaluation Office

Asian Percentage of Boston Population 1980, 1990, 2000, 2010 10% Percent of Population 8. 9% 8% 7. 5% 6% 5. 2% 4% 2. 7% 2% 0% 1980 1990 2000 DATA SOURCE: Decennial Census 1980, 1990, 2000, 2010, U. S. Census Bureau DATA ANALYSIS: Boston Public Health Commission Research and Evaluation Office 2010

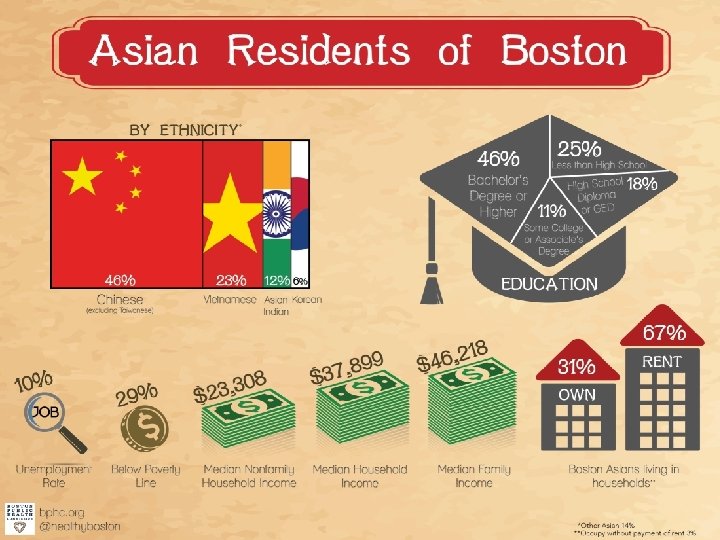
Ethnic Distribution Among Asian Residents Boston, 2008 -2012 Combined 45. 7 40. 0% 30. 0% 22. 5 20. 0% 12. 0 10. 0% 2. 7 1. 0 5. 9 2. 7 1. 3 0. 8 4. 3 0. 9 *Does not include those who identify as Taiwanese NOTE: Data permitted the identification of a single ethnicity. DATA SOURCE: American Community Survey, 2008 -2012, U. S. Census Bureau DATA ANALYSIS: Boston Public Health Commission Research and Evaluation Office sia n r. A Ot na et Vi he m es e ai Th se an e Ta iw an i Pa ki st an re Ko e ne s pa o Ja in lip Fi e* es in Ch di an m bo Ca ia n In di an 0. 0% As Percent of Asian Population 50. 0%

Gender Distribution by Race/Ethnicity Boston, 2010 60% 54. 3 52. 5 Percent of Population 47. 5 51. 4 45. 7 48. 6 51. 0 53. 3 49. 0 46. 7 40% 20% 0% Asian Black Latino Female White Other* Male * Includes American Indians/Alaskan Natives, Native Hawaiians/Other Pacific Islanders, Two or More Races, and Some Other Races. DATA SOURCE: Decennial Census 2010, U. S. Census Bureau DATA ANALYSIS: Boston Public Health Commission Research and Evaluation Office

Population Living Below Poverty by Race/Ethnicity, Boston, 5 -Year Estimates Percent of Population 40. 0% 30. 0% 20. 0% 10. 0% Boston 2005 -2009 Asian 2006 -2010 Black 2007 -2011 Latino 2008 -2012 DATA SOURCE: American Community Survey, 2008 -2012, U. S. Census Bureau DATA ANALYSIS: Boston Public Health Commission Research and Evaluation Office White

Health Indicators Among Adults Boston

Health Status & Insurance Status Among Adults Ages 1849, Boston, 2006, 2008 and 2010 Combined Percent of Adults Ages 18 -49 100. 0% 90. 0% 80. 0% 70. 0% 60. 0% Health Status (% with excellent/very good/good health) Asian Black Latino Insurance Status* (% insured) White Asian Health Status (% with excellent/very good/good health) 95. 7% (92. 5 -98. 9) Insurance Status * (% insured) 96. 7% (93. 8 -99. 6) Black 85. 3% (81. 6 -88. 9) 95. 3% (93. 5 -97. 2) Latino 84. 4% (79. 8 -89. 0) 95. 5% (93. 3 -97. 7) White 96. 0% (94. 7 -97. 3) 97. 7% (96. 8 -98. 6) *Years 2005, 2006, 2008 and 2010 combined DATA SOURCE: Boston Behavioral Risk Factor Survey (2005, 2006, 2008, 2010), Boston Public Health Commission DATA ANALYSIS: Boston Public Health Commission Research and Evaluation Office

Percent of Adults Ages 18 -49 Health Related Behaviors Among Adults Ages 18 -49, Boston, 2006, 2008 and 2010 Combined 100. 0% 75. 0% 50. 0% 25. 0% 0. 0% Regular Physical Activity Asian Fruit & Vegetable Intake (<5 servings per day) Black Latino Pap Smear Within Past 3 Years White Asian 41. 7% (29. 6 -53. 9) Fruit & Vegetable Intake (<5 servings per day) 61. 6% (49. 8 -73. 4) Black 49. 6% (44. 2 -55. 0) 73. 6% (69. 3 -78. 0) 86. 9% (81. 7 -92. 0) Latino 46. 6% (40. 4 -52. 9) 78. 3% (73. 2 -83. 4) 85. 8% (79. 5 -92. 0) White 69. 8% (66. 7 -73. 0) 67. 6% (64. 4 -70. 9) 93. 9% (91. 6 -96. 1) Regular Physical Activity Pap Smear within the Past 3 Years 51. 5% (35. 2 -67. 9) DATA SOURCE: Boston Behavioral Risk Factor Survey (2005, 2006, 2008, 2010), Boston Public Health Commission DATA ANALYSIS: Boston Public Health Commission Research and Evaluation Office

Smoking and Binge Drinking Among Asian Adults Ages 1849, Boston, 2006, 2008, and 2010 Combined Percent of Adults Ages 18 -49 20. 0% 15. 0% 10. 0% 5. 0% 0. 0% Smoking* Binge Drinking Asian Women Asian Men Smoking (%)* Binge Drinking (%) Asian Women (ages 18 -49) 2. 1% (0. 3 -4. 0) 9. 8% (1. 0 -18. 6) Asian Men (ages 18 -49) 9. 5% (3. 4 -15. 5) 17. 4% (6. 7 -28. 2) *Years 2005, 2006, 2008 and 2010 combined DATA SOURCE: Boston Behavioral Risk Factor Survey (2005, 2006, 2008, 2010), Boston Public Health Commission DATA ANALYSIS: Boston Public Health Commission Research and Evaluation Office

Birth Outcomes Boston

Low Birthweight Births by Race/Ethnicity Boston, 2010 15. 0% Percent of Births 12. 4 10. 0% 8. 9 8. 6 7. 9 5. 0% 0. 0% Asian Black Latino DATA SOURCE: Boston resident live births, Massachusetts Department of Public Health DATA ANALYSIS: Boston Public Health Commission Research and Evaluation Office White

Low Birthweight Births by Race/Ethnicity Boston, 2001 -2010 16. 0% Percent of Births 12. 0% 8. 0% 4. 0% 0. 0% 2001 2002 2003 Asian 2004 Black 2005 2006 Latino 2007 White DATA SOURCE: Boston resident live births, Massachusetts Department of Public Health DATA ANALYSIS: Boston Public Health Commission Research and Evaluation Office 2008 2009 2010

Low Birthweight by Asian Ethnicity Boston, 2002 -2004, 2005 -2007 and 2008 -2010 20. 0% 10. 0% 5. 0% 2005 -2007 2008 -2010 NOTE: Data permitted the identification of a single ethnicity. DATA SOURCE: Boston resident live births, Massachusetts Department of Public Health DATA ANALYSIS: Boston Public Health Commission Research and Evaluation Office er Ot h ne s pa Ja o in Fi lip an Ko re di an ia As Vi et n na In m es e e in es Ch al l er ia n Ov 2002 -2004 e n<5 0. 0% As Percent of Births 15. 0%
 2001 -2005 2002 -2006 2003 -2007 2004 -2008")
Infant Deaths (5 -Year Rolling Averages) 2001 -2005 2002 -2006 2003 -2007 2004 -2008 2005 -2009 2006 -2010 Boston Infant Deaths (per 1, 000 live births) 6. 4 6. 0 5. 9 6. 1 6. 2 5. 9 Asian Infant Deaths (per 1, 000 live births) 1. 7 n<5 2. 0 2. 7 4. 4 3. 0 Black Infant Deaths (per 1, 000 live births) 12. 3 12. 2 11. 9 12. 0 11. 1 10. 9 Latino Infant Deaths (per 1, 000 live births) 5. 7 5. 2 6. 0 5. 8 6. 1 White Infant Deaths (per 1, 000 live births) 3. 6 3. 3 3. 1 3. 2 3. 9 3. 4 DATA SOURCE: Boston resident live births and deaths, Massachusetts Department of Public Health DATA ANALYSIS: Boston Public Health Commission Research and Evaluation Office

Chronic Disease Boston

Asthma Hospitalizations* Among Females by Race/Ethnicity, Boston, 2009 -2010 and 2011 -2012 8. 0 Hospitalizations per 1, 000 Female Residents 6. 8 6. 0 5. 4 4. 8 3. 9 4. 0 1. 7 2. 0 1. 1 1. 2 1. 5 0. 0 Asian Black 2009 -2010 Latino White 2011 -2012 *Age-adjusted rates DATA SOURCE: Inpatient Hospital Discharge Database, Massachusetts Center for Health Information and Analysis DATA ANALYSIS: Boston Public Health Commission Research and Evaluation Office

Ethnic Distribution of Asthma Hospitalizations Among Asian Women, Boston, 2008 -2012 N=113 Hospitalizations 19% 24% 14% 43% Asian* Chinese Vietnamese Other • Asian includes: Bangladeshi, Bhutanese, Burmese, Hmong, Iwo Jiman, Indonesian, Madagascar, Malaysian, Maldivian, Nepalese, Okinawan, Pakistani, Singaporean, Sri Lankan, Taiwanese, Thai NOTE: Other includes other Asian ethnicities and those who identified as multiple Asian ethnicities DATA SOURCE: Inpatient Hospital Discharge Database, Massachusetts Center for Health Information and Analysis DATA ANALYSIS: Boston Public Health Commission Research and Evaluation Office

Diabetes Hospitalizations* Among Females by Race/Ethnicity, Boston, 2009 -2010 and 2011 -2012 5. 0 Hospitalizations per 1, 000 Female Residents 4. 2 4. 0 3. 5 3. 0 2. 2 2. 1 2. 0 1. 1 0. 70000000 1. 0 1 0. 4 1. 1 0. 0 Asian Black 2009 -2010 Latino White 2011 -2012 *Age-adjusted rates DATA SOURCE: Inpatient Hospital Discharge Database, Massachusetts Center for Health Information and Analysis DATA ANALYSIS: Boston Public Health Commission Research and Evaluation Office

Ethnic Distribution of Diabetes Hospitalizations Among Asian Women, Boston, 2008 -2012 N=68 Hospitalizations 36. 8% 42. 6% 20. 6% Chinese Vietnamese Other NOTE: Other includes other Asian ethnicities and those who identified as multiple Asian ethnicities DATA SOURCE: Inpatient Hospital Discharge Database, Massachusetts Center for Health Information and Analysis DATA ANALYSIS: Boston Public Health Commission Research and Evaluation Office

Heart Disease Hospitalizations* Among Females by Race/Ethnicity, Boston, 2009 -2010 and 2011 -2012 15. 0 Hospitalizations per 1, 000 Female Residents 12. 6 11. 8 10. 0 5. 0 8. 9 3. 7 8. 6 8. 0 7. 4 3. 4 0. 0 Asian Black 2009 -2010 Latino White 2011 -2012 *Age-adjusted rates DATA SOURCE: Inpatient Hospital Discharge Database, Massachusetts Center for Health Information and Analysis DATA ANALYSIS: Boston Public Health Commission Research and Evaluation Office

Ethnic Distribution of Heart Disease Hospitalizations Among Asian Women, Boston, 2008 -2012 N=439 Hospitalizations 8. 0% 10. 5% 3. 4% 20. 5% 57. 6% Asian* Asian Indian Chinese Vietnamese Other • Asian includes: Bangladeshi, Bhutanese, Burmese, Hmong, Iwo Jiman, Indonesian, Madagascar, Malaysian, Maldivian, Nepalese, Okinawan, Pakistani, Singaporean, Sri Lankan, Taiwanese, Thai NOTE: Other includes other Asian ethnicities and those who identified as multiple Asian ethnicities DATA SOURCE: Inpatient Hospital Discharge Database, Massachusetts Center for Health Information and Analysis DATA ANALYSIS: Boston Public Health Commission Research and Evaluation Office

Mental Health Boston

Mental Health Hospitalizations* Among Females by Race/Ethnicity, Boston, 2012 Hospitalizations per 1, 000 Female Residents 10. 0 7. 9 8. 0 7. 1 7. 5 6. 0 4. 0 3. 7 2. 4 2. 0 1. 8 0. 0 Asian Black 2009 -2010 Latino White 2011 -2012 *Age-adjusted rates DATA SOURCE: Inpatient Hospital Discharge Database, Massachusetts Center for Health Information and Analysis DATA ANALYSIS: Boston Public Health Commission Research and Evaluation Office

Ethnic Distribution of Mental Health Hospitalizations Among Asian Women, Boston, 2008 -2012 N=279 Hospitalizations 13. 3% 25. 1% 22. 2% 6. 8% Asian* Chinese 32. 6% Korean Vietnamese Other • Asian includes: Bangladeshi, Bhutanese, Burmese, Hmong, Iwo Jiman, Indonesian, Madagascar, Malaysian, Maldivian, Nepalese, Okinawan, Pakistani, Singaporean, Sri Lankan, Taiwanese, Thai NOTE: Other includes other Asian ethnicities and those who identified as multiple Asian ethnicities DATA SOURCE: Inpatient Hospital Discharge Database, Massachusetts Center for Health Information and Analysis DATA ANALYSIS: Boston Public Health Commission Research and Evaluation Office

Infectious Disease Boston

Hepatitis B Among Female Residents by Race/Ethnicity, Boston, 2011 and 2012 291. 4 New Cases per 100, 000 Female Residents 300. 0 255. 0 250. 0 200. 0 150. 0 100. 0 50. 0 42. 1 41. 3 28. 1 37. 6 17. 7 13. 9 7. 5 8. 9 0. 0 Boston Asian Black 2011 Latino White 2012 DATA SOURCE: Communicable Disease Control Division, Boston Public Health Commission (o 5/07/2014) DATA ANALYSIS: Boston Public Health Commission Research and Evaluation Office

Salmonella Among Female Residents by Race/Ethnicity, Boston, 2011, 2012, and 2013 New Cases per 100, 000 Female Residents 40. 0 30. 1 29. 6 30. 0 28. 2 23. 5 20. 0 16. 2 15. 5 20. 1 18. 8 16. 8 18. 7 16. 4 16. 5 12. 1 8. 7 10. 0 n<5 0. 0 Boston Asian Black 2011 2012 Latino 2013 DATA SOURCE: Communicable Disease Control Division, Boston Public Health Commission (05/07/2014) DATA ANALYSIS: Boston Public Health Commission Research and Evaluation Office White

Tuberculosis Among Female Residents by Race/Ethnicity, Boston, 2011 -2013 Combined 40. 0 36. 9 New Cases per 100, 000 Female Residents 30. 8 30. 0 20. 0 14. 0 13. 9 10. 0 n<5 0. 0 Boston Asian Black Latino DATA SOURCE: Communicable Disease Control Division, Boston Public Health Commission (05/07/2014) DATA ANALYSIS: Boston Public Health Commission Research and Evaluation Office White

Death Boston

Heart Disease Deaths* Among Females by Race/Ethnicity, Boston, 2002 -2006 and 2007 -2011 156. 4 160. 0 149. 8 132. 5 Deaths per 100, 000 Female Residents 121. 9 120. 0 83. 8 80. 0 62. 3 59. 3 40. 0 40. 2 0. 0 Asian Black 2002 -2006 Latino 2007 -2011 *Age-adjusted rates DATA SOURCE: Boston resident deaths, Massachusetts Department of Public Health DATA ANALYSIS: Boston Public Health Commission Research and Evaluation Office White

Ethnic Distribution of Heart Disease Deaths Among Asian Women by Ethnicity, Boston, 2002 -2011 N=109 Deaths 11. 9% 9. 2% 78. 9% Chinese Vietnamese Other NOTE: Data permitted the identification of a single ethnicity within race. DATA SOURCE: Boston resident deaths, Massachusetts Department of Public Health DATA ANALYSIS: Boston Public Health Commission Research and Evaluation Office

Diabetes Deaths* Among Females by Race/Ethnicity Boston, 2002 -2006 and 2007 -2011 Deaths per 100, 000 Female Residents 40. 0 36. 7 28. 1 30. 0 20. 0 17. 6 14. 4 13. 3 8. 3 10. 0 10. 8 5. 1 0. 0 Asian Black 2002 -2006 Latino 2007 -2011 *Age-adjusted rates DATA SOURCE: Boston resident deaths, Massachusetts Department of Public Health DATA ANALYSIS: Boston Public Health Commission Research and Evaluation Office White

Ethnic Distribution of Diabetes Deaths Among Asian Women, Boston, 2002 -2011 N=19 Deaths 10. 5% 89. 5% Chinese Other NOTE: Data permitted the identification of a single ethnicity within race. DATA SOURCE: Boston resident deaths, Massachusetts Department of Public Health DATA ANALYSIS: Boston Public Health Commission Research and Evaluation Office

Cancer Deaths* Among Females by Race/Ethnicity Boston, 2002 -2006 and 2007 -2011 200. 0 192. 3 187. 4 175. 0 Deaths per 100, 000 Female Residents 159. 3 150. 0 100. 0 91. 9 90. 3 81. 3 80. 7 50. 0 Asian Black 2002 -2006 Latino 2007 -2011 *Age-adjusted rates DATA SOURCE: Boston resident deaths, Massachusetts Department of Public Health DATA ANALYSIS: Boston Public Health Commission Research and Evaluation Office White

Ethnic Distribution of Cancer Deaths Among Asian Women, Boston, 2002 -2011 N=191 Deaths 11. 5% 13. 1% 2. 6% 72. 8% Chinese Filipino Vietnamese Other NOTE: Data permitted the identification of a single ethnicity within race. DATA SOURCE: Boston resident deaths, Massachusetts Department of Public Health DATA ANALYSIS: Boston Public Health Commission Research and Evaluation Office

Leading Types of Cancer Deaths* Among Females by Race/Ethnicity, Boston, 2007 -2011 Combined Asian Black Latino White 1 Lung 22 (18. 8) Breast 113 (30. 1) Lung 17 (10. 9) Lung 345 (42. 6) 2 Liver 14 (11. 6) Lung 107 (29. 2) Colorectal 14 (10. 1) Breast 169 (20. 6) 3 Colorectal 11 (9. 3) Colorectal 70 (19. 2) Breast 14 (6. 2) Colorectal 135 (14. 9) 4 Pancreas 8 (6. 7) Pancreas 67 (17. 8) Leukemia 11 (7. 4) Pancreas 82 (9. 0) 5 Breast 8 (6. 5) Corpus Uteri & Uterus 34 (9. 4) Ovary 7 (5. 0) Ovary 67 (8. 0) *Age-adjusted rates DATA SOURCE: Boston resident deaths, Massachusetts Department of Public Health DATA ANALYSIS: Boston Public Health Commission Research and Evaluation Office

CHALLENGES � Thirty percent of Asian residents in Boston live below federal poverty level � Although overall health outcomes for Asian women are positive, the health status of Asian women varies by ethnicity � Asian women have high rates of health insurance, but the lowest rates of participation in cervical cancer screenings � Asian women have higher rates of TB, Hepatitis B, and Salmonella when compared to all other women � Overall cancer mortality rates are increasing for Asian women (rates are decreasing for all other race categories); cancer of the liver is second leading type of cancer deaths for Asian women although not a leading type for women of other races
- Slides: 41