Demographic Transition Model DTM A MEASURE OF GROWTH
 A MEASURE OF GROWTH AT DIFFERENT STAGES")


- total number of live births in a year")


- Slides: 12
Demographic Transition Model (DTM) A MEASURE OF GROWTH AT DIFFERENT STAGES
Objectives �We will be able to use the Demographic Transition Model to identify the nature of population increase or decrease based on the development level of a particular country.
Demographic Transition �Process of change in a society’s population �From high CBR and CDR and low rate of Natural Increase (NIR) to a condition of low CBR and CDR, low NIR, and higher total population
Necessary Data… �Crude Birth Rate (CBR)- total number of live births in a year for every 1, 000 people alive �Crude Death Rate (CDR)- total number of deaths in a year for every 1, 000 people alive �Natural Increase Rate (NIR)- percentage a population grows in a year. CBR-CDR=NIR � Calculate the NIR if the CBR is 20 and the CDR is 5
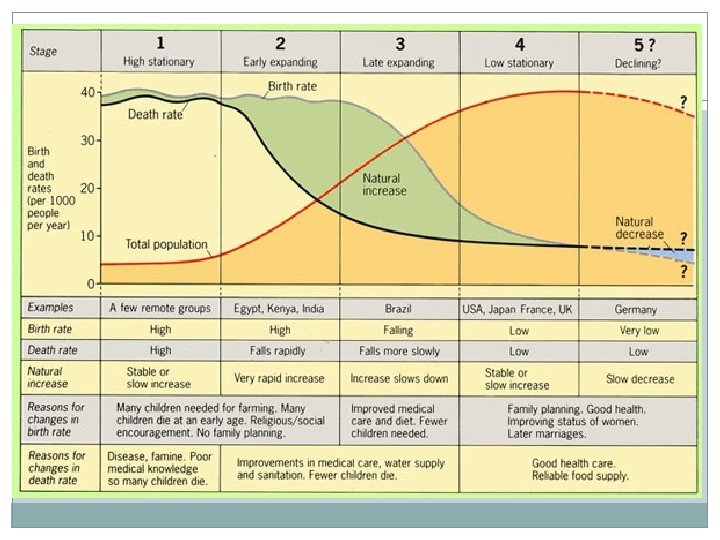
Stages of the Demographic Transition Model � 4 stages to the DTM (a 5 th is debated) Stage 1 - Low Growth Stage 2 - High Growth Stage 3 - Decreasing Growth Stage 4 - Low Growth
Stage 1 - Low Growth �Very High CBR and CDR- virtually no NIR �Most of human history spent in stage 1 �Depends on the availability of food What stage of human history/development do you believe best characterizes stage 1?
Stage 2 - High Growth �Rapidly declining CDR, very high CBR= very high NIR �Europe and North America entered stage 2 after ~1750. WHY? � Industrial Revolution �Africa, Asia, and Latin America entered around 1950. WHY? � Medical Revolution
Stage 3 - Decreasing Growth �CBR rapidly declines, CDR declines, NIR moderates �Population continues to grow because CBR is greater than CDR �People decide to have less children at this stage. Why?
Stage 4 - Low Growth �Very low CBR, CDR, NIR creates low growth or a possible decrease �Zero population growth (ZPG) can be achieved at this level �More opportunities for woman Education Enter labor force �Access to Birth Control �Which countries that we have discussed may fall in this stage? �How does the DTM create a cycle? What are the similarities between stage 1 and 4?
Connecting our concepts �What might the population pyramids for a country at different stages look like (1, 2, 3, and 4 Jigsaw)? Roughly sketch them in your notes
DTM Practice �Create a Demographic Transition Model based off of the data from England.