Democratic Transitions David Epstein Robert Bates Jack Goldstone

Democratic Transitions David Epstein, Robert Bates, Jack Goldstone, Ida Kristensen, Sharyn O’Halloran

In the News… n Building democracy is getting new levels of scrutiny in the popular press n Afghanistan n Built off existing institutions (loya jirga) Still, no real national government (“warlords”) Iraq n n One justification for was to establish a democratic government in the Middle East But a long interim gov’t may be needed first

Big Questions n n How do you establish democracy? What keeps democratic governments from sliding into autocracy/chaos? n n n “Home-grown” vs. Imported democracy How do you get non-violent transitions? If democracy=elections, is this even a good thing for developing polities? n Zakaria – “Illiberal Democracies”

Institutions vs. institutions n We have certain outcomes that we want a political system to deliver n Policy that reflects public opinion n n Public officials responsive to their constituents Protection for minorities, esp. ethnic Rule of Law via a fair, efficient court system Uncorrupt bureaucracy These are Institutions n Really, objectives of the system

Institutions vs. institutions n We know little about what institutions can provide these in different settings n n n Parliamentary vs. Presidential systems Federalism and/or corporatism Electoral rules and campaign finance laws Like economic institutions in China We have some examples of what fully developed, stable democracies look like n But how to reach this destination?

This Paper n Try to look at how countries have democratized in the past n n Review existing theories Present some new data and methods Look at the results and their implications Speculate about how these trends are changing in the 21 st Century n What, if anything, can the international community do to help?

Quick Peek at the Results n Modernization theory holds up well n n n Positive income effects at all levels of democratization Also some support for inequality effects Casts spotlight on partial democracies n n n Numerous Most volatile Hardest to predict/understand
 – Money matters n n n Higher income per")
Modernization Theory n Lipset (1959) – Money matters n n n Higher income per capita is associated with democratic governance Supported by evidence until… Przeworski, et. al. (PACL, 2000) n n Positive results were due to overaggregation of data Separate into democracies and all others n n Nothing predicts transitions up Once up, per capita income of over $4, 000 helps keep things stable
 n n n Rosendorff (2001) n n")
Other Theories n Acemoglu & Robinson (2003) n n n Rosendorff (2001) n n Inequality as well, plus increases in workforce and capital stock make revolutions less likely Haggard & Kaufman (1995) n n Transitions are economically based, as they redistribute income from rich to poor Nonlinear impact of inequality on transitions Inflation & low growth: transitions out of autocracy Schmitter, O’Donnell – Consolidation n Factors promoting transition could make it fragile

Data: Partial Democracies n PACL employ a dichotomous regime type n Democracy if: n n n Chief executive elected Legislature exists and is elected More than one political party At least one successful transition of power Autocracy otherwise We employ a trichotomous measure, including partial democracy

Distribution of Polity Scores Fraction . 2 . 1 0 -10 -9 -8 -7 -6 -5 -4 -3 -2 -1 0 1 2 Polity Score 3 4 5 6 7 8 9 10

Distribution of Polity Scores. 2 Fraction Autocracy. 1 0 -10 -9 -8 -7 -6 -5 -4 -3 -2 -1 0 1 2 Polity Score 3 4 5 6 7 8 9 10

Distribution of Polity Scores Full Democ. . 2 Fraction Autocracy. 1 0 -10 -9 -8 -7 -6 -5 -4 -3 -2 -1 0 1 2 Polity Score 3 4 5 6 7 8 9 10

Distribution of Polity Scores Full Democ. . 2 Partial Democ. Fraction Autocracy. 1 0 -10 -9 -8 -7 -6 -5 -4 -3 -2 -1 0 1 2 Polity Score 3 4 5 6 7 8 9 10

World Democratization Trends, 1955 -2000

Regional Democratization Trends, 1955 -2000 Africa Asia Australia Europe North & Central America South America

Transition Frequencies 1 -Year A P D A 97. 47 1. 89 0. 63 P 5. 12 91. 97 2. 90 1. 00 0. 87 98. 13 D

Transition Frequencies 5 -Year 1 -Year A P D A 97. 47 1. 89 0. 63 A 89. 64 7. 13 3. 24 P 5. 12 91. 97 2. 90 P 20. 43 65. 76 13. 81 1. 00 0. 87 98. 13 D 3. 84 4. 13 92. 03 D

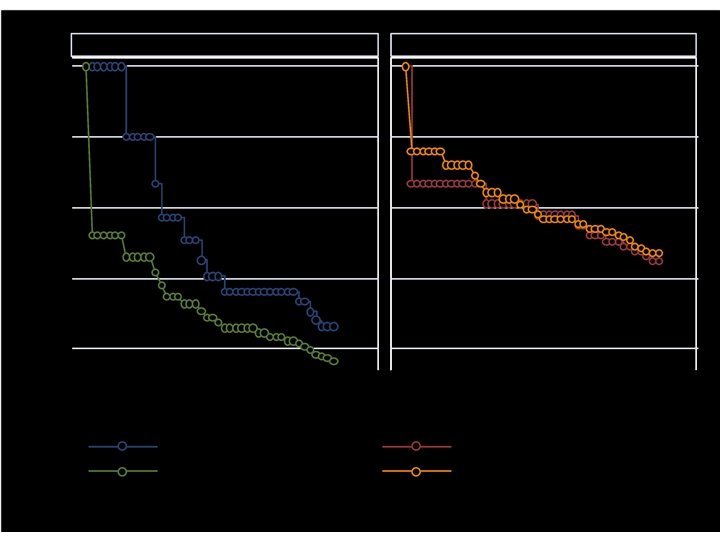
Transition Frequencies by Type and Year 8 6 Autocracy 8 66 obs. 6 4 4 2 2 0 22 obs. 0 1956 1960 1970 1980 year 1990 2000 1956 1960 A P 1990 2000 8 44 obs. 6 25 obs. 6 Partial Dem. 4 4 2 2 0 0 1956 1960 6 1980 year A D 8 8 1970 1980 year P A 1990 2000 1956 1960 8 6 4 4 2 2 0 1980 year D A 1990 14 obs. Democracy 0 1970 1980 year P D 16 obs. 1956 1960 1970 1990 2000 1956 1960 1970 1980 year D P 1990 2000

Data: Previous Transitions n n Previous attempts at transition may affect success of current attempt Is it like: n n Trying to quite smoking (+); or A sign of structural instability (-) Hard to capture this systematically We use “Sumdown, ” the sum of previous downward Polity movements n Example: Turkey, 1955 -2000

Illustration of Prev. Trans Variable for Turkey, 1955 -2000 Polity Score Prev. Trans 30 26 25 27 Polity Scale 20 9 10 11 8 9 4 0 0 7 9 8 7 1 -2 -5 -10 1955 1965 1975 Year 1985 1995 2000

Data: Inequality n n Plays a big role in many stories, including Acemoglu and Robinson Previous measures are rather incomplete n n Even Denninger and Squire agree with this We create a new measure n n Idea: infant mortality is caused by both health conditions & inequality So regress IM on health correlates and take the residual as a measure of inequality

Infant Mortality Residual vs. Gini Coefficient

Econometric Approaches n Tobit n n n Markov n n n Traditional regression approach, using full data range But with limits at – 10 and 10 Breaks data into three categories: autocracy, partial democracy, full democracy Looks at impact of variables on transition probabilities Duration Analysis n Analyzes length of time until a given transition occurs
 Acemoglu & Robinson: Inequality (-), Inequality 2")
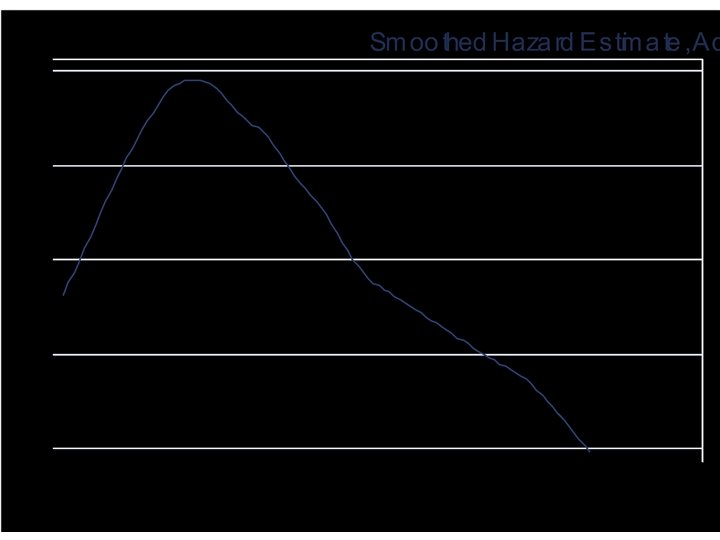
Predictions n n n Modernization: GDP/capita (+) Acemoglu & Robinson: Inequality (-), Inequality 2 (-) Rosendorff: Inequality (-), DWorkforce (-), DCapital. Stock (-) Haggard & Kaufmann: GDP growth (+), inflation(-) Consolidation: non-monotone hazard

Markov Analysis Autocracy GDP/cap Inequality Previous Attempts Partial Democracy

Duration Analysis n Question: What prevents newly democratized countries from backsliding? n n Can ask this for full or partial democracies n n Different from the question of what gets them democratic in the first place I. e. , most newly democratized nations will start off as partial democracies Tricky estimation, since we have repeated events (can democratize more than once)

Conclusion n Modernization theory holds up well n n With 3 -way dependent variable, income level does predict transitions out of autocracy Helps keep partials from backsliding Acemoglu and Robinson get some support Focus debate on partial democracies n n n Increasingly common Most volatile Hardest to predict

Markov Analysis Probability Autocracy Partial Dem. Full Democracy Variable
- Slides: 31