Democracy at Work how what and why Analysis


 in european company (SE) agreements")


 Les administrateurs salariés en France : contribution à")
- Slides: 14
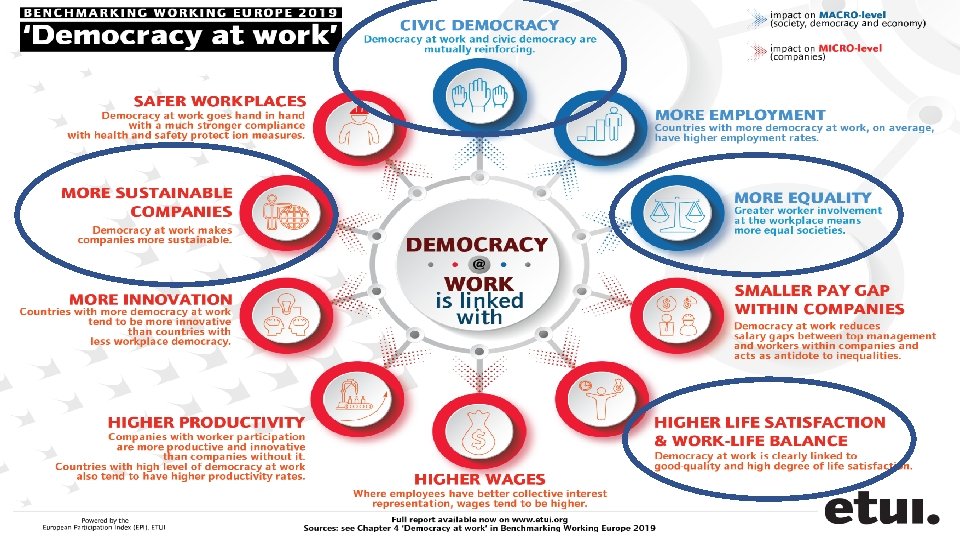
Democracy at Work: how, what and why? Analysis and perspectives for European policy Aline Hoffmann, ETUI Civil Society Days 2019 Sustainable Democracy in Europe Workshop 6: Economy and democracy in the labour market: for a resilient and sustainable pathway Based on Stan De Spiegelaere, Aline Hoffmann, Romuald Jagodzinski, Sara Lafuente Hernandez and Sigurt Vitols in ETUI & ETUC, Benchmarking Working Europe, 2019: 67 -89
Source: Benchmarking Working Europe 2019.
D@W strenghtens political democracy • Democracy at work and political democracy are mutually reinforcing • People who are involved in company decision-making vote more, are more interested in politics and see themselves as more able political citizens. 79% % employees who voted 68% % employees considering themselves as able to influence politics 49% 35% % employees interested in politics 21% very low democracy at work very high democracy at work
D@W keeps inequality at bay More equal countries Less equal countries Countries with high democracy at work are more equal Countries with low democracy at work Countries with high democracy at work
D@W means better jobs Democracy at work goes hand in hand with higher quality jobs and more life satisfaction. 7. 9 Very high democracy at work wages€ 3, 000 • Countries with high democracy at work tend to have higher wages. € 2, 500 € 2, 000 € 1, 500 Life satisfaction (0 -10) € 1, 000 € 500 7. 0 Very low democracy at work € 0 countries with low democracy at work countries with high democracy at work
D@W is good for your health Companies with works councils and/or Health and safety representatives have better H&S policies
D@W for more sustainable companies Companies with board-level employee representation score higher on many indicators about sustainabiliy no BLER 60 56 55 51 50 47 46 45 39 40 35 43 42 34 39 43 37 35 30 community involvement business behavior human resources environment human rights corporate governance
The palette of workers’ participation rights
Transnational Democracy @ Work Board level employee representation (BLER) in european company (SE) agreements European Works Councils Active European Works Councils (EWCs) over time 1200 1000 800 More and more employees in multinationals are covered by a European Works 600 43 1985 1990 1995 International BLER possible International BLER guaranteed In 2018 there are 1150 EWCs mobilizing approximately 20. 000 EWC employee representatives 200 N=58 Mononational BLER 534 400 0 1150 2005 2010 2015 BLER is Europeanizing: 25 SE agreements (43%) provide for international representation, and 30 (52%) make it possible. This allows more inclusive representation in SE boards. 3; 5% 25; 43% 30; 52%
But really, why Democracy at Work? FUNDAMENTAL RIGHT TO SELFDETERMINATION DEMOCRACY IN ALL SPHERES OF LIFE STAKEHOLDERS MATTER MORE THAN SHAREHOLDERS OWNING A COMPANY SHOULDN’T MEAN ABSOLUTE CONTROL EQUALITY, ALSO IN COMPANIES
ETUC demands
Thank you for your attention! Aline Hoffmann ahoffmann@etui. org Download full version Benchmarking Chapter at www. etui. org
References and sources Conchon A. (2014) Les administrateurs salariés en France : contribution à une sociologie de la participation des salariés aux décisions de l’entreprise, Ph. D dissertation under the supervision of Michel Lallement and Annette Jobert, Paris : Conservatoire national des Arts et Métiers ETUC 11 th Annual Gender Equality Survey (2018) Eurostat (2013) ETUI database of EWCs and SE works councils, www. ewcdb. eu ESENER Round 2: European survey of enterprises on new and emerging risks (2014). ESS Round 8: European Social Survey Round 8 Data (2016). Data file edition 2. 1. NSD - Norwegian Centre for Research Data, Norway – Data Archive and distributor of ESS data for ESS ERIC. OECD Database (2013) Piasna, A. (2017). “Bad jobs” recovery? European Job Quality Index 2005 -2015 (ETUI working paper No. 2017. 06) (p. 43). Brussels: European Trade Union Institute. Vitols, S. (2011) The Sustainable Company, ETUI, Brussels. Vitols, S. (2013) European Participation Index Waddington J. and Conchon A. (2016) Board Level Employee Representation in Europe, ETUI, Brussels EWPCC Database on SE board-level employee representatives, accessed December 2018 More information and explanation about the data and graphs can be found in Benchmarking Working Europe 2019.