
Demo Bioconductor 92316120 95325113 95325102 o o eset

Demo Bioconductor 組員: 92316120 江建霖 95325113 謝紹陽 95325102 李祥豪
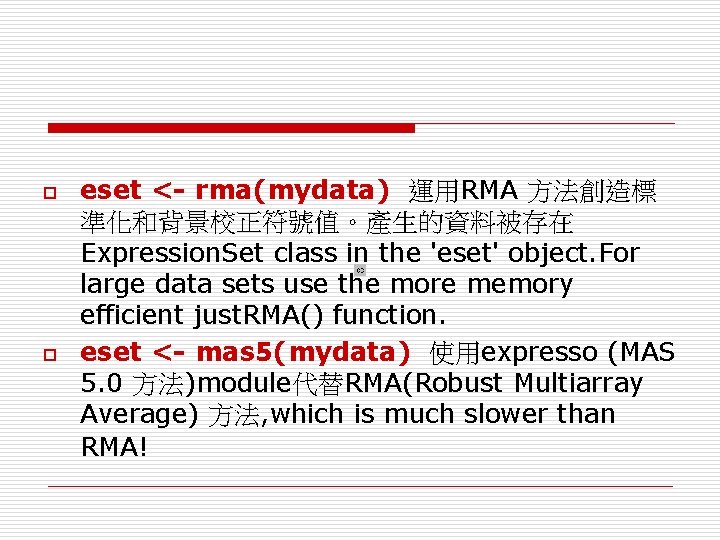
o o eset <- rma(mydata) 運用RMA 方法創造標 準化和背景校正符號值。產生的資料被存在 Expression. Set class in the 'eset' object. For large data sets use the more memory efficient just. RMA() function. eset <- mas 5(mydata) 使用expresso (MAS 5. 0 方法)module代替RMA(Robust Multiarray Average) 方法, which is much slower than RMA!
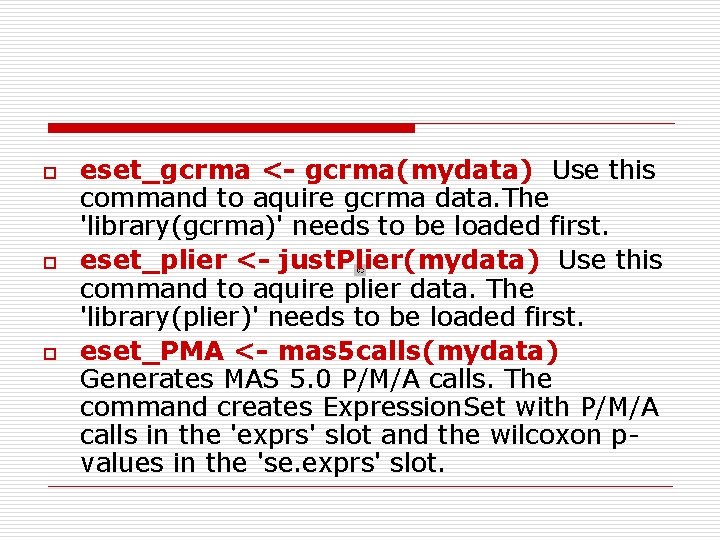
o o o eset_gcrma <- gcrma(mydata) Use this command to aquire gcrma data. The 'library(gcrma)' needs to be loaded first. eset_plier <- just. Plier(mydata) Use this command to aquire plier data. The 'library(plier)' needs to be loaded first. eset_PMA <- mas 5 calls(mydata) Generates MAS 5. 0 P/M/A calls. The command creates Expression. Set with P/M/A calls in the 'exprs' slot and the wilcoxon pvalues in the 'se. exprs' slot.
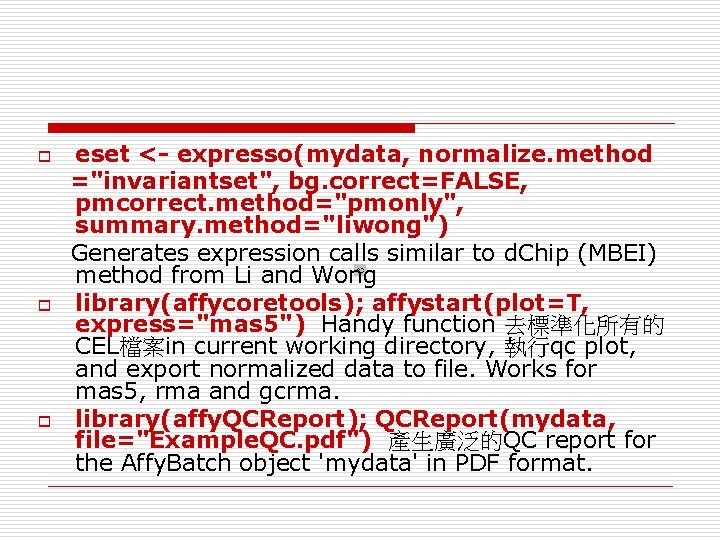
o o o eset <- expresso(mydata, normalize. method ="invariantset", bg. correct=FALSE, pmcorrect. method="pmonly", summary. method="liwong") Generates expression calls similar to d. Chip (MBEI) method from Li and Wong library(affycoretools); affystart(plot=T, express="mas 5") Handy function 去標準化所有的 CEL檔案in current working directory, 執行qc plot, and export normalized data to file. Works for mas 5, rma and gcrma. library(affy. QCReport); QCReport(mydata, file="Example. QC. pdf") 產生廣泛的QC report for the Affy. Batch object 'mydata' in PDF format.
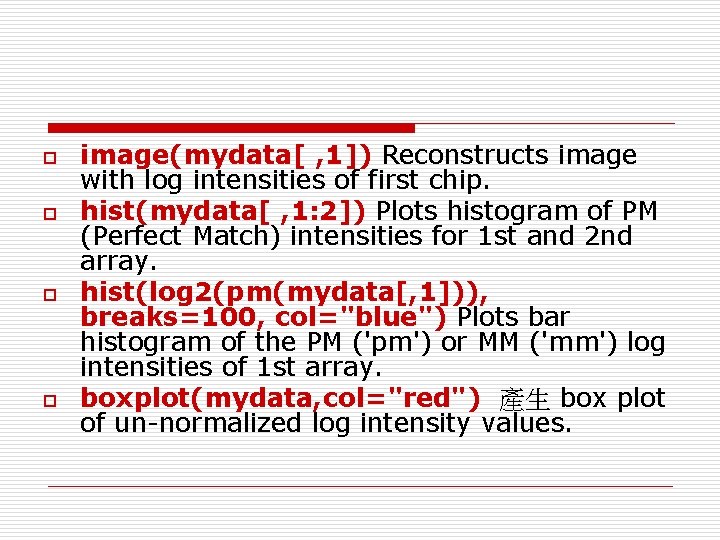
o o image(mydata[ , 1]) Reconstructs image with log intensities of first chip. hist(mydata[ , 1: 2]) Plots histogram of PM (Perfect Match) intensities for 1 st and 2 nd array. hist(log 2(pm(mydata[, 1])), breaks=100, col="blue") Plots bar histogram of the PM ('pm') or MM ('mm') log intensities of 1 st array. boxplot(mydata, col="red") 產生 box plot of un-normalized log intensity values.
o o o boxplot(data. frame(exprs(eset)), col="b lue", main="Normalized Data") 產生box plot of normalized log intensity values. mva. pairs(pm(mydata)[, c(1, 4)]) Creates MA-plot for un-normalized data. A MA-plot is a plot of log-intensity ratios (Mvalues) versus log-intensity averages (Avalues) between selected chips (here '[1, 4]'). mva. pairs(exprs(eset)[, c(1, 4)]) Creates MA-plot for normalized data.

Thanks for your listening
- Slides: 7