DEMAND SUPPLY AND PRICE Chapters 4 5 6


")


")


 • British Petroleum (BP) opens two new oil refineries in")
")


")


- Slides: 89
DEMAND, SUPPLY, AND PRICE Chapters 4, 5, & 6
Chapter 4: Section 1 What is Demand?
Scenario I • Proctor & Gamble introduced disposable diapers to the marketplace in 1961. At first parents only used Pampers for special occasions. Today, 95% of American parents use disposable diapers at a cost of $2, 100 a child. Why do you think the change took place so gradually? ANSWER: • Change in preferences, Faster Pace Society today, Easier Disposal Today, Advertising, More Choices today, Substitutes, and etc.
Supply and Demand • Demand--- The amount of a good or service that consumers are willing and able to BUY at various prices • Consumers individually and collectively have a great influence on the price of all goods and services. • Supply--- The amount of a good or service that producers will offer to SELL at various prices • Businesses and Firms-- people who want to sell items decide how much to sell and at what price. • A market represents actions between buyers and
• Voluntary Exchange-- the basis of activity in a market economy. – The seller sets the price – The buyer agrees to the by the purchase. – Supply and demand shows this voluntary exchange.
Graphing a Demand Curve • Demand Schedule is a table that shows prices and the quantity demanded at each price. Price Per Soda $0. 25 $. 50 $. 75 $1. 00 $1. 25 $1. 50 Quantity Demanded
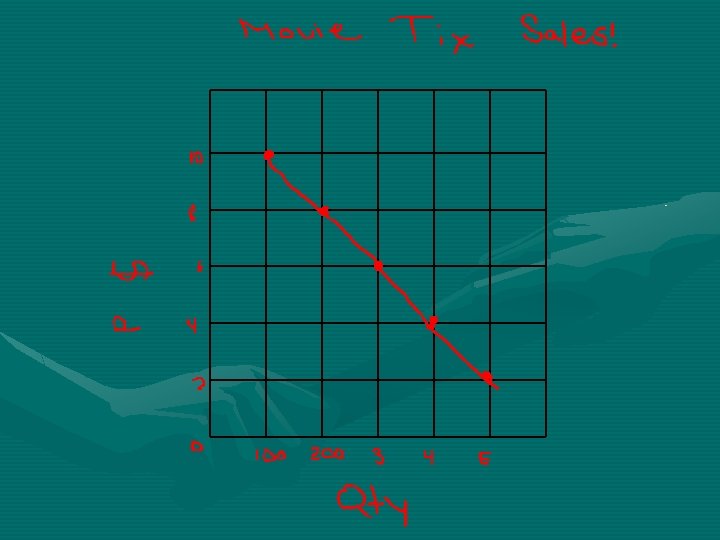
CONSTRUCT A DEMAND SCHEDULE USING THE FOLLOWING INFORMATION: • A local movie theatre does an experiment every Monday afternoon to see how many people will come see a movie at different prices. Here is what they found: at $2 per ticket 500 people bought tickets, at $4 per ticket 400 people bought tickets, $6 = 300, $8= 200, $10 = 100.
PRICE per movie ticket $2 QUANTITY of movie tickets DEMANDED 500 tickets
PRICE per movie ticket $2 QUANTITY of movie tickets DEMANDED 500 tickets $4 400 tickets $6 300 tickets $8 200 tickets $10 100 tickets
Demand Curve • Demand Curve-- Shows/graphs the quantity demanded of a good or service at each possible price.
• Use the information from the demand schedule to CONSTRUCT A DEMAND CURVE. Plot the points first, and then connect them. Label the line D 1. • *Make sure to include: a title, labels for the x and y axis, and numbers that are labeled consistently
Demand • The Law of Demand- A rule or theory that states: • 1) As PRICE goes UP, the quantity consumers DEMAND goes DOWN. • 2) As PRICE goes DOWN, quantity DEMANDED goes UP. • More will be demanded at lower prices and less at higher prices • There is an INVERSE relationship between price and quantity demanded
• At which price will the movie theater make the most money (or maximize their profit)? • TOTAL REVENUE= Price x Quantity • TR= P x Q • ANSWER: $6 per ticket x 300 tickets= $1800 • At all other prices, theater will make less TOTAL REVENUE than it will if it sells tickets for $6
Law of Demand
Graphing A Demand Curve Demand Schedule Price of Widgets $1. 00 # of Widgets People want to buy 100 $2. 00 90 $3. 00 70 $4. 00 40
Shifts in Demand Schedule Price of Widgets # of Widgets People Want to Buy $1. 00 (100) To 80 $2. 00 (90) To 70 $3. 00 (70) To 50 $4. 00 (40) To 10
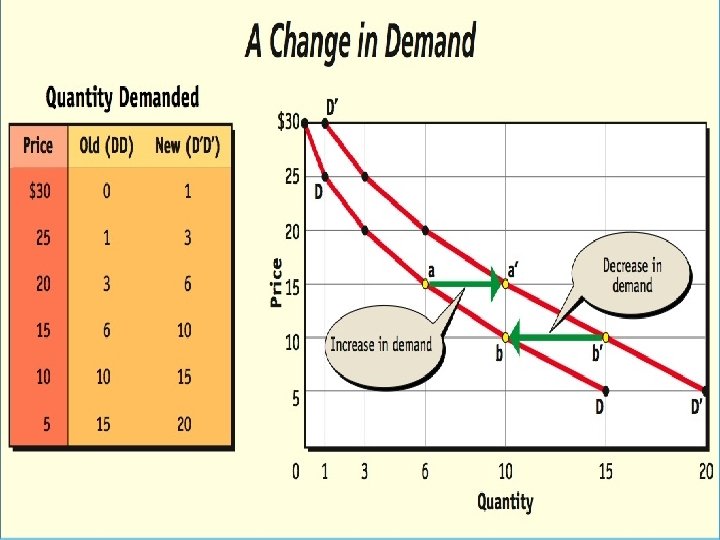
Change in Demand
Change in Demand Price D 0 to D 1: Increase in Demand 6 D 1 D 0 7 13 Quantity
• What is a change in quantity demanded ? • Change in Qd is along the demand curve and shows a change in the quantity of the product purchased in response to a change in price. WALKING TO ECONOMICS CLASS IN AN UNCROWDED HALL.
Change in Quantity Demanded Price A to B: Increase in quantity demanded A 10 B 6 D 0 4 7 Quantity
• Utility is the term used to mean customer satisfaction, or the power a good or service has to satisfy a want. First Can Second Can Third Can • Example: Energy Drink Fourth Can Fifth Can
• Marginal Utility- People will purchase additional items until the satisfaction from the last unit is equal to the price. • Law of Diminishing Utility- The lessening of this satisfaction with each additional purchase is called diminishing marginal utility.
Chapter 4: Section II Factors Affecting Demand
• What are some reasons that people substitute one product for another? • What are some reasons that people continue to buy a product despite its price?
– Income effect is when people are limited by their income as to what they can purchase. – Substitution effect is when people can replace one product with another if it satisfies the same need.
• What are some examples of how demand might change?
Determinants of Demand • Consumer Tastes • Changes in prices of substitutes • Changes in prices of complements • Consumer Income • Change in consumer expectations • Population changes • Advertising
Consumer Income & Tastes • As incomes rise, consumers are able to buy more products at each and every price. • As incomes fall, consumers buy less of goods at each and every price -Rises move right -Decreases move left • Consumer tastes can be affected as well -Advertising, done right, increases popularity and increases demand -If a product grows tiring, demand can fall -Technology can create new tastes as well
Substitutes • A change in price of related products can cause a change in demand Substitutes -Products that can be used in place of other products i. e. butter vs. margarine Butter price goes up, margarine demand increases • Demand for a product tends to increase when its substitutes price goes up
Complements • Complements -Related goods that when use of one increases the use of the other • Personal computers and software complementary goods -Price of computers go down and demand goes up for computers and software -Gillette razors and razor blades Razors low, razor blades high
Number of Consumers/Population • An increase of consumers can cause the market demand to shift – Older generations joining in from CDs to i. Pods – Book fans changing over to e. Readers
Godfather • • • Demand for narcotics is created Substitute for the other vices that Don Corleone offers Expectations are that the narcotic business will grow Sadly, it can also be a compliment to other vices Quantity demanded will go up simply due to addiction – “In the first year your end should be 3 -4 million dollars and then it will go up”
Changes in Expectations • Future technologies might cause people to hold their purchases -Ipods coming out, cds went down • Expectations could go the other way as well If people think food shortages could be a reality for the next year they will stock up, driving demand up.
Tastes & Preferences • The year is 1968 and Al’s General Store has just received a new supply of Bell Bottom Jeans. • What will happen to the demand for Bell Bottoms in 1968?
Income • Ford Motor Company announces that all salaries of employees will be cut in half at its Detroit plant. • What happens to the demand for steak and lobster in Detroit?
Substitutes • Coffee prices soar to a new high in the U. S. due to a recent embargo of Columbia. • What will happen to the demand for tea? • Butter VS Margarine • Paperclips VS Staples
Complementary Goods • Lockport’s Wal-Mart has dropped the price of all cameras by 70%. • What will happen to the demand for film in the Lockport area? • What are some other examples of complements?
Population • Hurricane Katrina refugees move to Baton Rouge, LA from New Orleans, LA. • What happens to the demand for televisions in Baton Rouge?
Chapter 4: Sections 3 Elasticity of Demand
Elasticity of Demand • How much consumers respond to a given price is elasticity. • Demand Elasticity occurs when the demand for some goods is GREATLY AFFECTED by the PRICE
Elastic Demand Curves • Coffee is elastic: FOLGERS VS MAXWELL HOUSE • Butter is elastic: Land O’ Lakes VS Parkay • Pop is elastic: Pepsi VS Coca-Cola Classic.
Inelastic Demand Curves • Inelastic Demand- occurs when the demand for some goods is LESS AFFECTED by price. • Give examples of inelastic goods. • Ex: Gasoline, Insulin, medicines and other items that are essentially needs. (how easy is it to live without it? Any alternatives? )
How does Elasticity Affect Me? • % of a PERSONAL BUDGET SPENT on that item affects elasticity of demand (the higher the % of budget, the more elastic the demand. • How much TIME consumers have to adjust to the new price affects the elasticity of demand (more time makes for greater elasticity).
Elastic/Inelastic Curves • An Inelastic good is a necessity and will be bought at any time when needed no matter the price – The most inelastic curve is a straight vertical line • Elastic goods are things that can come and go, matter the price. Wants… – The most elastic curve is a straight horizontal line
Muppets • Mortgages are inelastic – You’ll have one/rent no matter what – While you can choose where you live if you’re invested in your home it would be hard to cut away • The medical expenses Mr. Applegate has to incur are also inelastic. He must pay it. • Especially during this time period the money lenders and mortgages holders could raise and lower as wanted…
Elastic or Inelastic?
Chapter 5: Section I What is Supply?
Scenario 2 • In the early days of the telephone, human operators had to physically connect each call. The phone companies always thought that they would have enough operators to do the job. As the telephone became increasingly popular, what happened to the cost of labor for operations? • About what percentage of your calls today involve contact with a telephone operator? • Why were telephone companies willing to supply more automated methods of connecting telephone
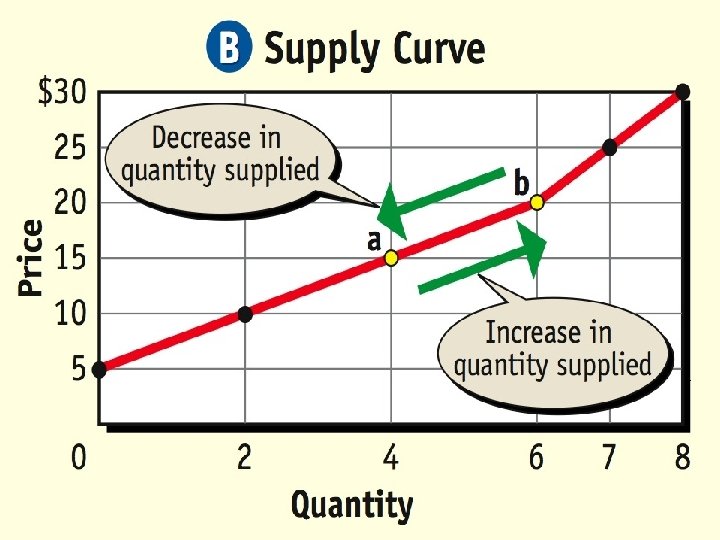
Law of Supply • Supply is the willingness and ability of producers to provide goods to the consumer. • Law of Supply- As prices rise, the quantity supplied generally rises. As prices fall, the quantity supplied falls (Direct Relationship).
Law of Supply
Graphing a Supply Curve Supply Schedule Price of Widgets $1. 00 # of Widgets Sellers want to Sell 10 $2. 00 40 $3. 00 70 $4. 00 140
Shifts in Supply Schedule Price of Widgets Number of Widgets Sellers Want to Sell $1. 00 (10) To 20 $2. 00 (40) To 60 $3. 00 (70) To 100 $4. 00 (140) To 180
Changes in Supply
Change in Supply S 0 to S 1: Increase in supply Price S 0 S 1 8 6 5 7 Quantity
Change in Quantity Supplied Price A to B: Increase in quantity supplied S 0 B 20 A 10 5 10 Quantity
Supply Shifters • • Cost of Inputs Productivity Technology Taxes and Subsidies Expectations Government regulations Number of firms/sellers
Cost of Inputs • A change in the cost of inputs can cause a change in supply -Supply can increase because of a decrease in the cause of inputs such as labor or packaging -If the prices of in puts drops producers are willing to produce more -An increase in cost of inputs has the opposite effect -If inputs are high producers are not producing as much, causing a shift to the left (curve)
Productivity • When management inspire, or workers decide to work harder/efficiently, productivity increases. • Thus more of a unit is produced at every price which can shift the curve to the right • If workers are unmotivated, untrained, or unhappy productivity decreases causing a shift to the left. • Less goods brought to market at every price
Technology • New technologies tend to shift the supply curve to the right (increase) • New machines, chemicals, or industrial processes can affect supply by lowering the cost of production or by increasing productivity • However equipment can break down, or technology might be difficult to obtain. • This would shift to the left (but not usually)
Taxes and Subsidies • Firms view taxes as costs • If the producer’s inventory is taxed or if fees are paid to receive a license to produce, the cost of production goes up • Taxes go down and production costs go down • Subsidy – A government payment to an individual, business, or other group to encourage or protect a certain type of economic activity.
Technology • Expectations about future price of a product can also affect the supply curve – If producers think the price of their product will go up, they may withhold some of the supply – This causes the curve to shift left – If they think their prices will lower they may try to produce as much as possible sending the curve Right.
Government Regulations • When the gov’t establishes new regulations, the cost of production can be affected • Cars – When the gov’t mandates new auto safety features such air bags and emission controls, cars cost more to make – Companies produce fewer cars at each price in the market because they are more costly to make • Increased or tighter regulations shift the curve left (decrease) but relaxed regulations allow producers to lower costs of production and move the curve right (increase)
Number of Firms/Sellers • Each of the fore mentioned factors can cause a shift in the market supply curve and so can the number of suppliers • More firms in the industry = the supply curve moving right. The larger number of firms the greater the supply • Sellers enter and leave the market all the time • Internet helps firms to enter and leave
Cost of Inputs • INPUTS = Raw Materials, Wages of workers, Insurance, Utilities, and etc. • The PRICE of Iron Ore INCREASES at a local steel mill. • What will happen to the supply curve for steel?
Productivity • Management increases the number of workers hired for the second quarter by 30% in a computer factory. • What will happen to the supply of computers?
Technology • TECHNOLOGY able to produce more in the same amount of time usually lowers costs of production • Eli Whitney invented the Cotton Gin that allowed one man to pick cotton at the rate of five men. • What did the Cotton Gin do to the supply of cotton in the South during the 1800’s?
Taxes • The City of Chicago has just raised the tax on cigarettes by another dollar? • What will happen to the supply curve for cigarettes in Chicago? • Subsidy-government payment to an individual, business, farmer, to encourage them to produce goods in a market causes an increase in supply
Government Regulations • Government mandates new safety regulations that cars must have new emissions controls and air bags? • What happens to the cost of production? • The price the consumer pays? • And the supply curve of cars?
# of Sellers/Firms (Competition) • British Petroleum (BP) opens two new oil refineries in Joliet. • What will happen to the supply curve for oil in the total industry?
Chapter 5: Section 2 No Chapter 5: Section 3 (Business Unit)
Law of Diminishing Returns • Adding units to increase production increases total output for a limited time period. • The extra output for each additional unit will eventually decrease. • Businesses will continue to add units of a factor of production until doing so increases revenue. # of workers # Widgets produced 1 4 2 8 3 11 4 13 5 13
• Finding the right amount of workers to have in a business – Too many and you’re loosing money and productivity – Too few and there won’t be enough people to run the business
Chapter 6: Prices and Decision Making
Prices in the Market • Price- monetary value of a product as established by supply and demand– signal that helps us make our economic decisions. • Rationing- distributing goods and services without prices. EXAMPLE: World Wars 1 & 2 • “Black Market”- market where prices are made illegally and products are sold illegally EXAMPLE: illegally selling people’s organs
• How do sellers often time try to convince buyers to agree to the price of a product? • Warranty, Deal (Buy 1 Get One Free), Sales, Advertising, and etc.
• Why do higher prices encourage more competitors to enter an industry? • Answer: If the price goes up, possible competitors now see that there is more money to be made than before. The gain seems more worth the risk than it did before.
Market Price • When quantity supplied equals quantity demanded = market price (equilibrium price) • When Supply curve crosses Demand curve
Shift in Supply Affects Market Price
Factors Affecting Market Price • How will the market price be affected if: • Supply increases, Demand is the same? • Supply decreases, Demand is the same? • Supply stays the same, Demand increases? • Supply stays the same, Demand decreases?
Reading the Curve • SURPLUS -- Q demanded is less than the Q supplied. • SHORTAGE – Q demanded is more than the Q supplied. Ex: Play. Station 3 s were in a shortage at Christmas; parking spaces at LTHS
If price is too low… Price S 7 6 5 D Shortage 12 - 6 = 6 6 12 Quantity
If price is too high… Surplus 14 - 6 = 8 Price S 9 8 7 D 6 8 14 Quantity
Price Restrictions • Price Ceilings – The maximum legal price that can be charged – Examples: • • • Gasoline prices in the 1970 s Housing in New York City Proposed restrictions on ATM fees • Price Floors – The minimum legal price that can be charged. – Examples: • Minimum wage