Demand for Health Care Production Function for Health

 Health Status")


 p Income and education")
")


 Price of insurance • In the previous example, the")


 n Group model n")


: per capita")
 and Robinson (2000): found mixed")


- Slides: 64
Demand for Health Care
Production Function for Health p Health = H(medical care, other inputs, time) Health Status H H 2 H 1 Iatrogenic disease M 1 M 2 M 3 Medical Care Spending
Health Status Measurements p Mortality: probability of death p Morbidity: probability of illness/disability p Quality of life: QALY
Top 10 Causes of Death Measured in 1000 s Cause of Death 1980 Cause of Death Number Percent 1989. 8 100. 0 1. Heart disease 761. 1 38. 3 2. Malignant neoplasms 416. 5 20. 9 3. Cerebrovascular diseases 170. 2 4. Unintentional injuries 2006 Number Percent 2, 426. 3 100. 0 1. Heart disease 631. 6 26. 0 2. Malignant neoplasms 559. 9 23. 1 8. 6 3. Cerebrovascular diseases 137. 1 5. 7 105. 7 5. 3 4. Chronic lower respiratory diseases 124. 6 5. 1 5. Chronic obstructive pulmonary diseases 56. 0 2. 8 5. Unintentional injuries 121. 6 5. 0 6. Pneumonia and influenza 54. 6 2. 7 6. Diabetes mellitus 72. 5 3. 0 7. Diabetes mellitus 34. 9 1. 8 7. Alzheimer’s disease 72. 4 3. 0 8. Chronic liver disease and cirrhosis 30. 6 1. 5 8. Pneumonia and influenza 56. 3 2. 3 9. Atherosclerosis 29. 5 1. 5 9. Nephritis 45. 3 1. 9 10. Suicide 26. 9 1. 4 10. Septicemia 34. 2 1. 4 All Causes
Work Days Lost and Activity Impairments, 1996
Health Status Determinants Health = H(medical care, other inputs, time) p Income and education p Environmental and lifestyle factors Ø Diet, exercise, sexual behavior, substance abuse, violence p Genetic factors p The role of public health Ø Immunization, clean air/water, food handling
Demand for Medical Care p Demand Function QMC = M(P; HS, DC, ES, PF) n Health status: acute/chronic care n Demographic characteristics: n Economic standing n Physician factors $ Q age, gender, population
Effect of Insurance on Demand Price D 100% D 50% D 0% P 0 ½ P 0 Q 1 Q 2 Medical Care
Physician Induced Demand p S & D may not be independent due to principalagent problem p Graphical story p Empirical evidence is mixed n Fuchs and Kramer (1986): # of physicians and fees are positively correlated n Reinhardt (1985): physicians migrate to high fee areas
Estimating Demand p Problem Set #8 p Price elasticity of demand E = %ΔQ %ΔP p Income elasticity of demand E = %ΔQ %ΔM
Select Studies on Elasticity of Demand
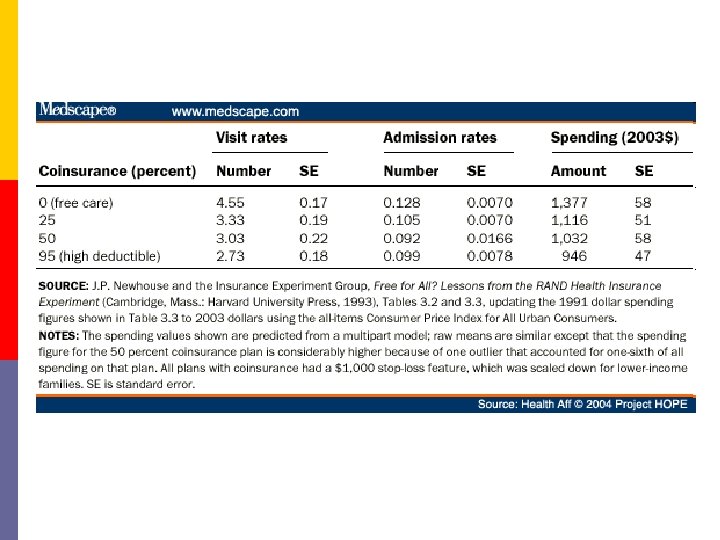
RAND Experiment: 1974 -82 p Randomly assigned 2, 000 non-elderly families to insurance plans differing in 2 characteristics: n Coinsurance rate: 0, 25%, 50%, 95% n Annual spending cap of $1, 000 p Examined 2 measures: n Health spending n Health outcomes
RAND Experiment Spending p Research question: How did assignment to groups affect spending?
Data from Manning WG et al. 1987. “Health insurance and the demand for medical care: Evidence from a randomized experiment. ” American Economic Review, 77(3): 251 -277.
RAND Experiment Spending p Research question: How did assignment to groups affect spending? p Economic lesson: increase the price and reduce the amount consumed
RAND Experiment Health Outcomes p Study question: How did assignment to groups affect outcomes? p For average person – no substantial health benefits from free care n Exception: poor and chronically ill did better with free care (hypertension, vision, dental care)
RAND Experiment Conclusions p Instead of free for all care: n Targeted benefits for chronic conditions n Exempt low-income from cost sharing p Study changed policy debate n Cost sharing limits demand without substantially harming health
Market for Health Insurance
Types of insurance p Social insurance n Medicare n Medicaid p Indemnity insurance n Provides reimbursement for expenditures or loss of income n Premiums (price) reflects expected loss (cost) p p p Hospitalization Physician services Major medical Dental Disability income protection Long-term care
Insurance Theory p People prefer to avoid risky outcomes n May be willing to pay to avoid risky outcomes
Expected Utility Theory Assumes diminishing marginal utility of income Utility Expected Utility without insurance Utility when healthy U 90 86 PH = probability of being healthy PS = probability of being sick PH + P S = 1 E(U) = PHU($40, 000) + PSU($20, 000) = PH • 90 + PS • 70 Let PS =. 20 70 E(U) = (. 80)90 + (. 20)70 = 86 Utility when sick $20 E(Y) = (. 80)(40, 000) + (. 20)(20, 000) = $36, 000 $36 $40 Medical illness costs $20, 000 Income (thousands)
Expected Utility Theory Utility from a certain income of $35, 000 Utility U 90 86 Paying $5, 000 to insurer leaves consumer with 86 utils, which equals E(U) without insurance. 70 Loading fee $20 Expected medical costs $35 $36 $40 Income (thousands)
Determinants of HI Demand 1) Price of insurance • In the previous example, the consumer will forego health insurance if the premium is greater than $5, 000. 2) Degree of Risk Aversion • Greater risk aversion increases the demand for health insurance. 3) Income • Larger income losses due to illness will increase the demand for health insurance. 4) Probability of Illness • • • Consumers demand less insurance for events most likely to occur (e. g. dental visits). Consumers demand less insurance for events least likely to occur. Consumers more likely to insure against random events.
Health Insurance and Market Failure p Income tax treatment p Information problems n Moral hazard n Adverse selection n Free riders
Tax Subsidy p Employer-paid health insurance is exempt from federal, state, and Social Security taxes èEmployee will prefer to purchase insurance through work, rather than on his own.
is $1, 000 per week and income tax rate is 28% $50 weekly insurance premium Employee Purchased Employer Purchased p Income p 28% tax p after tax p insurance p net pay p Income p insurance p subtotal p 28% tax p net pay $1, 000 <280> 720 <50> 670 $1, 000 <50> 950 <266> 684
Adverse Selection p Occurs because one party to a contract has more information than the other n Too many high risk users contaminate the risk pool; drives premiums up n Creates incentives for low risk users to drop out
Moral Hazard p Occurs when one party to a contract cannot monitor the other party’s performance n Insured people engage in more risky behavior n Insured people are likely to spend more on health care The Peltzman Effect
Insurers’ Response to Market Failure p Response to overspending: n Deductibles n Coinsurance p Response to adverse selection: n Require physical exams n No preexisting conditions will be covered
Efficient Pooling? p Experience rating p Community rating p Cream skimming p Self-insurance
Managed Care
Managed Care p Contractual arrangements that integrate financing and delivery of medical care n Prepaid health plans (Prospective payment) n Limited benefits n Risk-sharing arrangements
History of Managed Care p Kaiser Permanente n Largest non-profit HMO p 8. 7 members p 156, 000 employees p 13, 700 physicians p 37 medical centers p 400 medical offices p HMO Act (1973) Sidney Garfield and Henry Kaiser n Subsidies to non-profit groups to start HMOs
HMO Enrollment, 1970 -2006
Types of Managed Care Plans p Health maintenance organizations (HMO) n Group model n Staff model n Network model p Preferred provider organizations (PPO) n Similar to network model except enrollees can go outside network p Point-of-Service plans (POS) n Hybrid of HMO and PPO
Percentage of American Workers in Managed Care
Managed Care Cost Savings: Theory p Selection of providers n gatekeepers p Cost sharing arrangements n Capitation for general practitioners n Risk-sharing contracts p Bonuses p Withholdings p Practice guidelines and utilization review n n “evidence-based” medicine plans Pre-authorization Second-opinions Hospitalists “gatekeeper”
Managed Care Cost Savings: Evidence p RAND (Manning et al, . 1984): per capita costs 28% lower under HMO due to fewer hospital admissions and shorter stays p Miller and Luft (1994, 1997): HMO cost savings of 10 -15% due to shorter hospital stays, fewer tests, less costly procedures p Glied (1999): overall evidence inconclusive since managed care attracts healthier enrollees
Managed Care Quality: Evidence p Miller and Luft (1997) and Robinson (2000): found mixed evidence on overall quality differences p Ware et al. (1996), Robinson (2000), and Hellinger (1998): poorer outcomes among members of vulnerable subpopulations—sick, elderly, poor
Managed Care and Its Public Image p Considerable economic success p Cultural and political failure p Patient/Provider Backlash n Patient rights n Humana law suit p cost-based criteria rather than medical-need
The Future of Managed Care p Patients – Model too restrictive p Employers – Concerned over litigation prospects, disgruntled employees p Payers – Discovered cost control is unpopular and dangerous to corporate survivability p Providers – Risk sharing is risky. Balking at dual role of agent of patient (associated concern with quality) and agent of society (associated concern with costs)
A New Direction p Consumer driven health care – build on tradition of individual autonomy and cost conscious consumers n n Complementary medicine Informed consent Expanding use of Internet Direct-to-consumer advertising p Employer desire to get out of the health care business p Public distrust for government-run programs
Market for Health Care Professionals Physicians Nurses Dentists
Labor Market Theory p Competitive Model n Hiring Rule: MRP = w p Imperfectly Competitive Model n Barriers to entry n Imperfect information n Third-party payment S 1 Wage W 1 D 1 = MRP 1 L 1 Physicians
Human Capital Model p Medical degree as an investment $ Med Degree Benefits BA Degree Foregone Income Age Direct Cost
Human Capital Model p Investment Rule: invest if PV of Net Benefits > 0 Can solve for internal rate of return for which NB = 0 Mincer Earnings Equation: ln. Y = β 0 + β 1 S + β 2 X + ε
Estimated Rates of Return Primary Care Physicians Dentists Medical Specialists Lawyers 15. 9% 20. 7% 20. 9% 25. 4% Business 29. 0% Source: Weeks, Wallace, and Welch. “A Comparison of the Educational Costs and Incomes of Physicians and Other Professionals, ” New England Journal of Medicine 330(18), 1994. Problem Set #30
Market for Physician Services p Education Requirements n 4 years Med school + intern + residency p 126 medical schools in United States enrolling 70, 000 students p Graduating 16, 000 per year p 25% are International Medical Graduates n Long training times mean inelastic labor supply p Licensing and Certification
Active Physicians in the U. S.
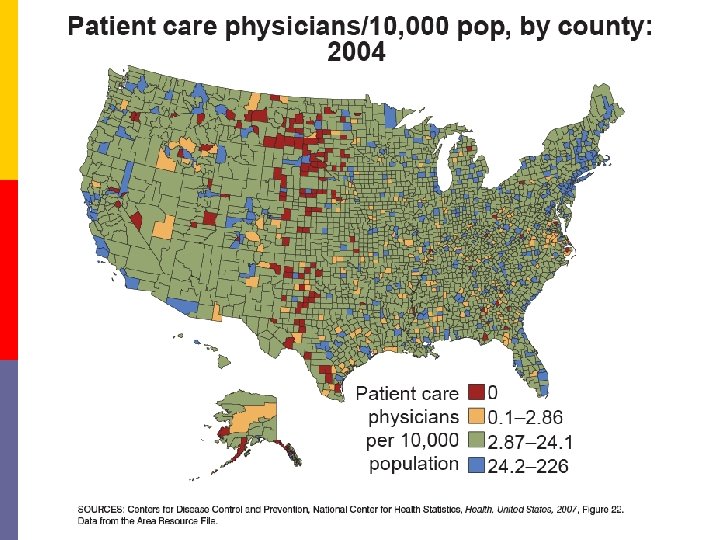
Specialty and Geographic Distribution p Primary care vs. specialty care n 50% target? p Urban vs. rural n Pennsylvania: Pittsburgh-Philadelphia: p 25% of population, but 50% of physicians
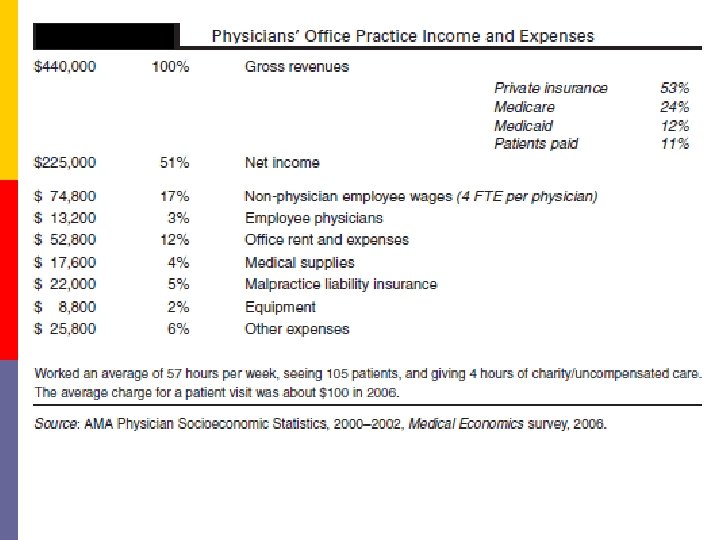
The Business of Being a Physician p Physician Compensation
Medical Practice Incomes of Physicians
The Business of Being a Physician p Physician Compensation p Pricing physician services n Price Discrimination n UCR fees n Medicare RVS
Pricing Physicians’ Services CPT code Description 2000 2005 2010 $1, 423 $1, 292 $1, 375 1, 853 1, 794 1, 947 27130 Total hip replacement 33533 Single CABG 43239 Upper GI endoscopy 223 300 327 67210 Treatment of retinal lesion 599 560 628 92980 Insertion of coronary stent 979 772 818 93000 Electrocardiogram 26 24 20 99203 Office visit, new patient 83 90 98 99213 Office visit, established patient 44 49 66 99223 Initial hospital care 147 151 190 99292 Additional 30 minutes of critical care 90 108 117 Source: Centers for Medicare and Medicaid Services, Physician Fee Schedule Search, http: //www. cms. hhs. gov/pfslookup. Accessed February 17, 2010
The Business of Being a Physician p Physician Compensation p Pricing physician services p Organization of physicians’ practices n EOS: group practice p 1965: 10% p 1991: 33% n Treatment variations across regions
Models of Physician Behavior p Monopolistic competitor n Output rule: MR = MC (and set P off of Demand) p Price discrimination n Output rule: MRA = MRB = MC p Imperfect agent n Physician-induced demand
Controlling Physician Behavior p Do physicians respond to incentives? n Reduced FFS: increased follow-ups? Unbundling? n Clinical rules: more referrals? p Empirical evidence n n Randomized trials (RAND experiment) Same disease studies (Epstein, Begg, and Mc. Neil, 1986) Same physician studies (Welch, Hillman, and Pauly, 1990) physicians used more services in fee-for-service plans than prepaid plans
The Market for Nursing Services RN: AA or BA or 3 -yr HD LPN: 12 -14 month program $65, 000 $40, 000 Active RNs (thousands) RNs per 100, 000 population Nursing Programs First-Year Enrollment Nursing Graduates 1970 750 368 1, 340 1980 1, 273 560 1, 385 105, 952 75, 523 1990 1, 790 714 1, 470 108, 580 66, 088 2000* 2, 190 778 688 103, 999 32, 543 2007* 2, 468 819 709 180, 127 56, 446 43, 103 * Baccalaureate program only. Source: Health, United States, 2009. Available at http: //www. cdc. gov/nchs/hus. htm; Statistical Abstract of the United States 2010. Available at http: //www. census. gov/compendia/statab/.
The Market for Dental Services General Dentistry Orthodontists Oral Surgeons Dental Hygienists Dental Assistants $154, 000 $190, 000 $ 67, 000 $ 33, 000 Active Dentists (thousands) Dentists per 100, 000 population Dental Schools First-Year Enrollment Dental Graduates 1970 96. 0 47 53 -- 3, 749 1980 121. 9 54 60 6, 132 5, 256 1990 147. 5 59 58 3, 979 4, 233 2000 168. 0 61 55 4, 314 4, 171 2007 -- -- 56 4, 733 4, 714 Source: Health, United States, 2009. Available at http: //www. cdc. gov/nchs/hus. htm